Lesson 9 of 12 · about 50 minutes · Updated November 21, 2026
Land, Labor, Fees and Money: The Rest of the Price
You'll be able to
- Explain the seven parts of a new home's sales price in NAHB's survey and the survey's limits.
- Read Census Survey of Construction and Building Permits Survey data on new-home prices, size, lots and permit values for Idaho and the West.
- Tell building permit, impact and utility connection fees apart under Idaho Code 67-8203 and add up the public fees on a sample house from published schedules.
- Compare Idaho construction wages with national wages using BLS OEWS data.
- Compute how mortgage rates change a monthly payment and explain builder rate buydowns.
- Read a homebuilder's Form 10-K for gross margin, pre-tax margin and incentives, and weigh NAHB's regulation estimate against other evidence.
Start here: the short version
- Materials and labor are about two-thirds of the price. In the National Association of Home Builders (NAHB) survey of the 2024 building year, construction cost was 64.4 percent of the average new-home sales price of $665,298, the finished lot 13.7 percent, and builder profit before taxes 11.0 percent. NAHB is the home building industry's trade group, the survey had 41 usable builder responses, and the results are national only.1
- The lot's share has fallen to a record low in that survey. The finished lot was 26.0 percent of the price in 2004 and 13.7 percent in 2024, while construction cost rose from 51.7 to 64.4 percent.2
- Public fees on a new house differ by more than double between Idaho cities. Our sum of published 2026 schedules for a hypothetical 2,000 square foot house: $18,822 in Meridian (city impact fees, the Ada County Highway District road fee of $5,803 and city water and sewer assessments, before the building permit) against $8,878.82 in Twin Falls (every city fee we found, including the building permit).34567
- Idaho trades earn about the national wage or less. In May 2025 the median hourly wage for construction and extraction jobs was $27.00 in Idaho and $28.63 nationally; for plumbers it was $25.18 in Idaho and $30.67 nationally (U.S. Bureau of Labor Statistics).89
- Money got much more expensive. Freddie Mac's weekly 30-year fixed rate averaged 2.96 percent in 2021 and 6.56 percent in 2026 through Nov. 19 (our averages of the weekly survey). On a $400,000 loan that is $1,677.80 against $2,544.08 a month in principal and interest.10
- Builders are paying down buyers' rates and cutting margins. D.R. Horton, the largest U.S. builder and active in Idaho, reported a home sales gross margin of 20.2 percent for the year ended Sept. 30, 2026, down from 21.5 percent, citing "higher incentives, including mortgage rate buydowns." Lennar's incentives averaged $62,700 a home, 13.8 percent of home sales revenue, in its year ended Nov. 30, 2025.1112
- Regulation's share is an industry estimate, not a measurement. NAHB's 2021 study put regulation at 23.8 percent of a new home's price ($93,870), from surveys of 57 developers and 280 builders. It is the most quoted number in the fee fight and the one with the least independent checking.1314
Law: Idaho Code as amended through the 2026 regular session. Fees: published schedules of the Ada County Highway District (effective March 1, 2026), Meridian (Feb. 1, 2023 impact fees; June 1, 2026 water and sewer assessments), Boise (effective Oct. 1, 2026), Twin Falls (master fee schedule as posted in November 2026; impact fees effective Jan. 1, 2026; water and sewer fees for Oct. 1, 2025 to Sept. 30, 2026) and Coeur d'Alene (undated city estimate). Data: NAHB Cost of Constructing a Home 2024 (Jan. 20, 2025); Census Bureau Survey of Construction, Characteristics of New Housing 2025 (July 1, 2026); Census Building Permits Survey 2025; BLS Occupational Employment and Wage Statistics, May 2025; Freddie Mac Primary Mortgage Market Survey through Nov. 19, 2026; D.R. Horton Form 10-K for fiscal 2026 (filed Nov. 18, 2026) and Lennar Form 10-K for fiscal 2025. Checked Nov. 21, 2026. Fees and rates change often; check the issuing office or the newest release.
Lesson 8 followed the lumber, drywall, concrete and copper that go into a house (Raw Materials: How Much, Why, and the Trend). This lesson follows everything else a buyer pays for: the land under the house, the people who build it, the fees cities and districts charge before the first shovel, the cost of money, and what the builder keeps. It uses three kinds of evidence and labels each one: government data (the Census Bureau, the Bureau of Labor Statistics, Freddie Mac's survey), published fee schedules from Idaho cities and districts, and industry surveys and company filings (NAHB, builders' annual reports to the Securities and Exchange Commission).
Three warnings run through the whole lesson. First, no public dataset breaks down the price of a new home in Idaho. The best breakdown is NAHB's, it is national, and it comes from a few dozen builders. Second, a fee schedule is a law or rule, but a "fee for a typical house" is always someone's calculation, so we show ours. Third, the parts of the price move at different speeds: lumber can double and fall back in a year (lesson 8), a city's impact fee changes every few years, and the interest rate changes every week.
Other lessons cover nearby ground and this one links rather than repeats. The law of impact fees, the fee-or-tax cases and the full Meridian, Boise and Twin Falls fee tables are in Impact Fees, Urban Renewal and Who Pays. How farmland becomes platted lots is in Subdivisions and Plats Step by Step. Home prices against inflation are in Prices and Rents vs. Inflation, and the long history of who could afford to own in Idaho is in Homeownership in Idaho, 1900 to 2026. The permit fees a builder pays at the counter, step by step, are in Getting a Residential Permit: City vs. County.
The whole price on one page
What the NAHB survey is, and what it is not
Every two or three years since 1998, NAHB has asked builders to split the sales price of a typical home they built into seven parts. For the 2024 survey, conducted in the fall of 2024, NAHB e-mailed a questionnaire to a sample of 4,000 builders, stratified by builder size and by Census region, and after an outlier check had usable answers from 41 builders. Respondents described "the typical single-family home built by their firms during 2024."1
NAHB's own caveats belong in any story that uses the numbers. The report says the survey "is not designed to capture representative characteristics of the average home built during a particular year," that the sample "is not large enough for a geographic breakdown," and that because a different set of builders answers each time, users "should be cautious when comparing results across multiple years."1 NAHB economist Eric Lynch repeated in replies on the association's blog that the sample is too small for regional results.15 The survey's average house (2,647 square feet on a 20,907 square foot lot, $665,298) is larger and pricier than the Census Bureau's averages for the same period, which NAHB explains partly by the survey's tilt toward smaller builders who build more expensive homes.116
With those limits stated, it is still the only public breakdown of a new home's price by component that covers decades. No Idaho agency, university or trade group publishes an Idaho version.
The seven pieces of the price
| Part of the sales price (NAHB 2024) | Average dollars | Share of price | What it includes |
|---|---|---|---|
| Finished lot | $91,057 | 13.7% | Land, plus streets, utilities and approvals to make it buildable, plus financing on the lot |
| Construction cost | $428,215 | 64.4% | Everything paid to build the house: labor, subcontractors, materials, permits and fees, design |
| Financing | $10,220 | 1.5% | Interest and loan costs during construction |
| Overhead and general expenses | $38,248 | 5.7% | Office, staff, insurance, warranty reserves and other company costs |
| Marketing | $5,633 | 0.8% | Advertising, model homes, signs |
| Sales commission | $18,955 | 2.8% | Agent and in-house sales commissions |
| Profit (before taxes) | $72,971 | 11.0% | What is left for the builder |
| Total sales price | $665,298 | 100.0% | Due to rounding, parts may not add exactly |
Source: NAHB, Cost of Constructing a Home 2024, Table 1, an industry survey of 41 builders.1 NAHB says each category "includes all the costs paid by a builder that go into a particular item, including labor costs paid directly by the general contractor, the cost of hiring subcontractors, and the cost of materials, however they are purchased."1 That matters for this lesson: NAHB does not split labor from materials, so the construction cost line mixes the two. Lesson 8 shows what NAHB has estimated about materials alone.
Construction cost per square foot of finished floor area in the survey was about $162 in 2024 ($428,215 divided by 2,647 square feet), up from $153 in 2022, $114 in 2019 and $80 in 2011, all in dollars of each year and not adjusted for inflation.17 NAHB credited "ongoing shortages of construction labor" and the faster wage growth they caused for much of the 2022 to 2024 increase and said building material prices "explained much of the cost increase in 2022" but had been "relatively well-behaved more recently."17
Inside the construction cost
NAHB splits construction cost into eight stages and 36 items. The biggest single items in 2024 were framing including the roof structure ($49,763, 11.6 percent of construction cost) and excavation, foundation, concrete, retaining walls and backfill ($43,002, 10.0 percent). Plumbing, electrical and heating and air (HVAC) rough-ins were each about 6.3 to 6.4 percent, cabinets and countertops 4.5 percent, exterior wall finish 5.7 percent and roofing 3.9 percent.1
Two shifts stand out in NAHB's history table. Framing fell from 20.5 percent of construction cost in 2022 to 16.6 percent in 2024, the lowest since NAHB began measuring that stage in 2013, as lumber prices came down from their 2021 and 2022 peaks. The major system rough-ins (plumbing, electrical, HVAC, not counting fixtures) rose from 13.4 percent in 2013 to 19.2 percent in 2024; electrical alone went from 4.0 to 6.4 percent of construction cost over those years.17 NAHB's table does not say why. Lesson 7 (Why Quality Can Fall Even as Code Grows) covers the code changes in those systems, and lesson 2 covers which editions Idaho adopted.
The fee lines hidden in "site work"
Public fees sit inside the "site work" stage of NAHB's construction cost. In 2024 builders reported building permit fees of $7,640 (1.8 percent of construction cost), impact fees of $6,367 (1.5 percent) and "water and sewer fees, inspections" of $6,260 (1.5 percent): $20,267 together, about 4.7 percent of construction cost and 3.0 percent of the sales price (our calculation from Table 1).1 Fees charged to the developer of the lot, and the streets and pipes the developer builds, are not in these lines; they are buried in the finished lot price. So the survey's fee lines are a floor for public costs, not a total.
In NAHB's history table, building permit fees ranged from 0.8 to 2.1 percent of construction cost between 1998 and 2024, and impact fees from 0.6 to 1.6 percent. Neither shows a steady climb in share; both rose in dollars as houses got more expensive.17
The long view: lot, construction and profit since 1998
The finished lot's share of the price was 23.6 percent in 1998 and peaked at 26.0 percent in 2004, during the last land boom. It has fallen in most surveys since and hit 13.7 percent in 2024. Construction cost went the other way, from a low of 48.1 percent in 2007 to 64.4 percent in 2024. Pre-tax profit has stayed in a band of 6.8 percent (2011, just after the crash) to 12.0 percent (2002); NAHB puts the long-run average since 1998 at 9.8 percent.2
A falling lot share does not mean land got cheap. The lot's dollar value in 2024, $91,057, was higher than in 1998 (23.6 percent of $226,680, about $53,500, our calculation from Table 2). The house on top of the lot simply grew more expensive faster. NAHB's report notes that lot availability "has been a major headwind for homebuilders over the last decade."162
How we figured it: dollars and shares from the NAHB tables
Inputs. NAHB Table 1 (2024 dollars and shares) and Table 2 (shares and average price for each survey year, 1998 to 2024).12
Steps. Construction cost per square foot: $428,215 / 2,647 = $161.77, which NAHB rounds to $162. Fees as a share: ($7,640 + $6,367 + $6,260) = $20,267; $20,267 / $428,215 = 4.73 percent of construction cost; $20,267 / $665,298 = 3.05 percent of the sales price. The 1998 lot in dollars: 0.236 x $226,680 = $53,496. Lot share of the 2024 price: $91,057 / $665,298 = 13.69 percent.
Limits. All dollars are nominal (not adjusted for inflation). Each survey has different builders, so comparisons between years are rough. The survey is national; Idaho builders may differ.
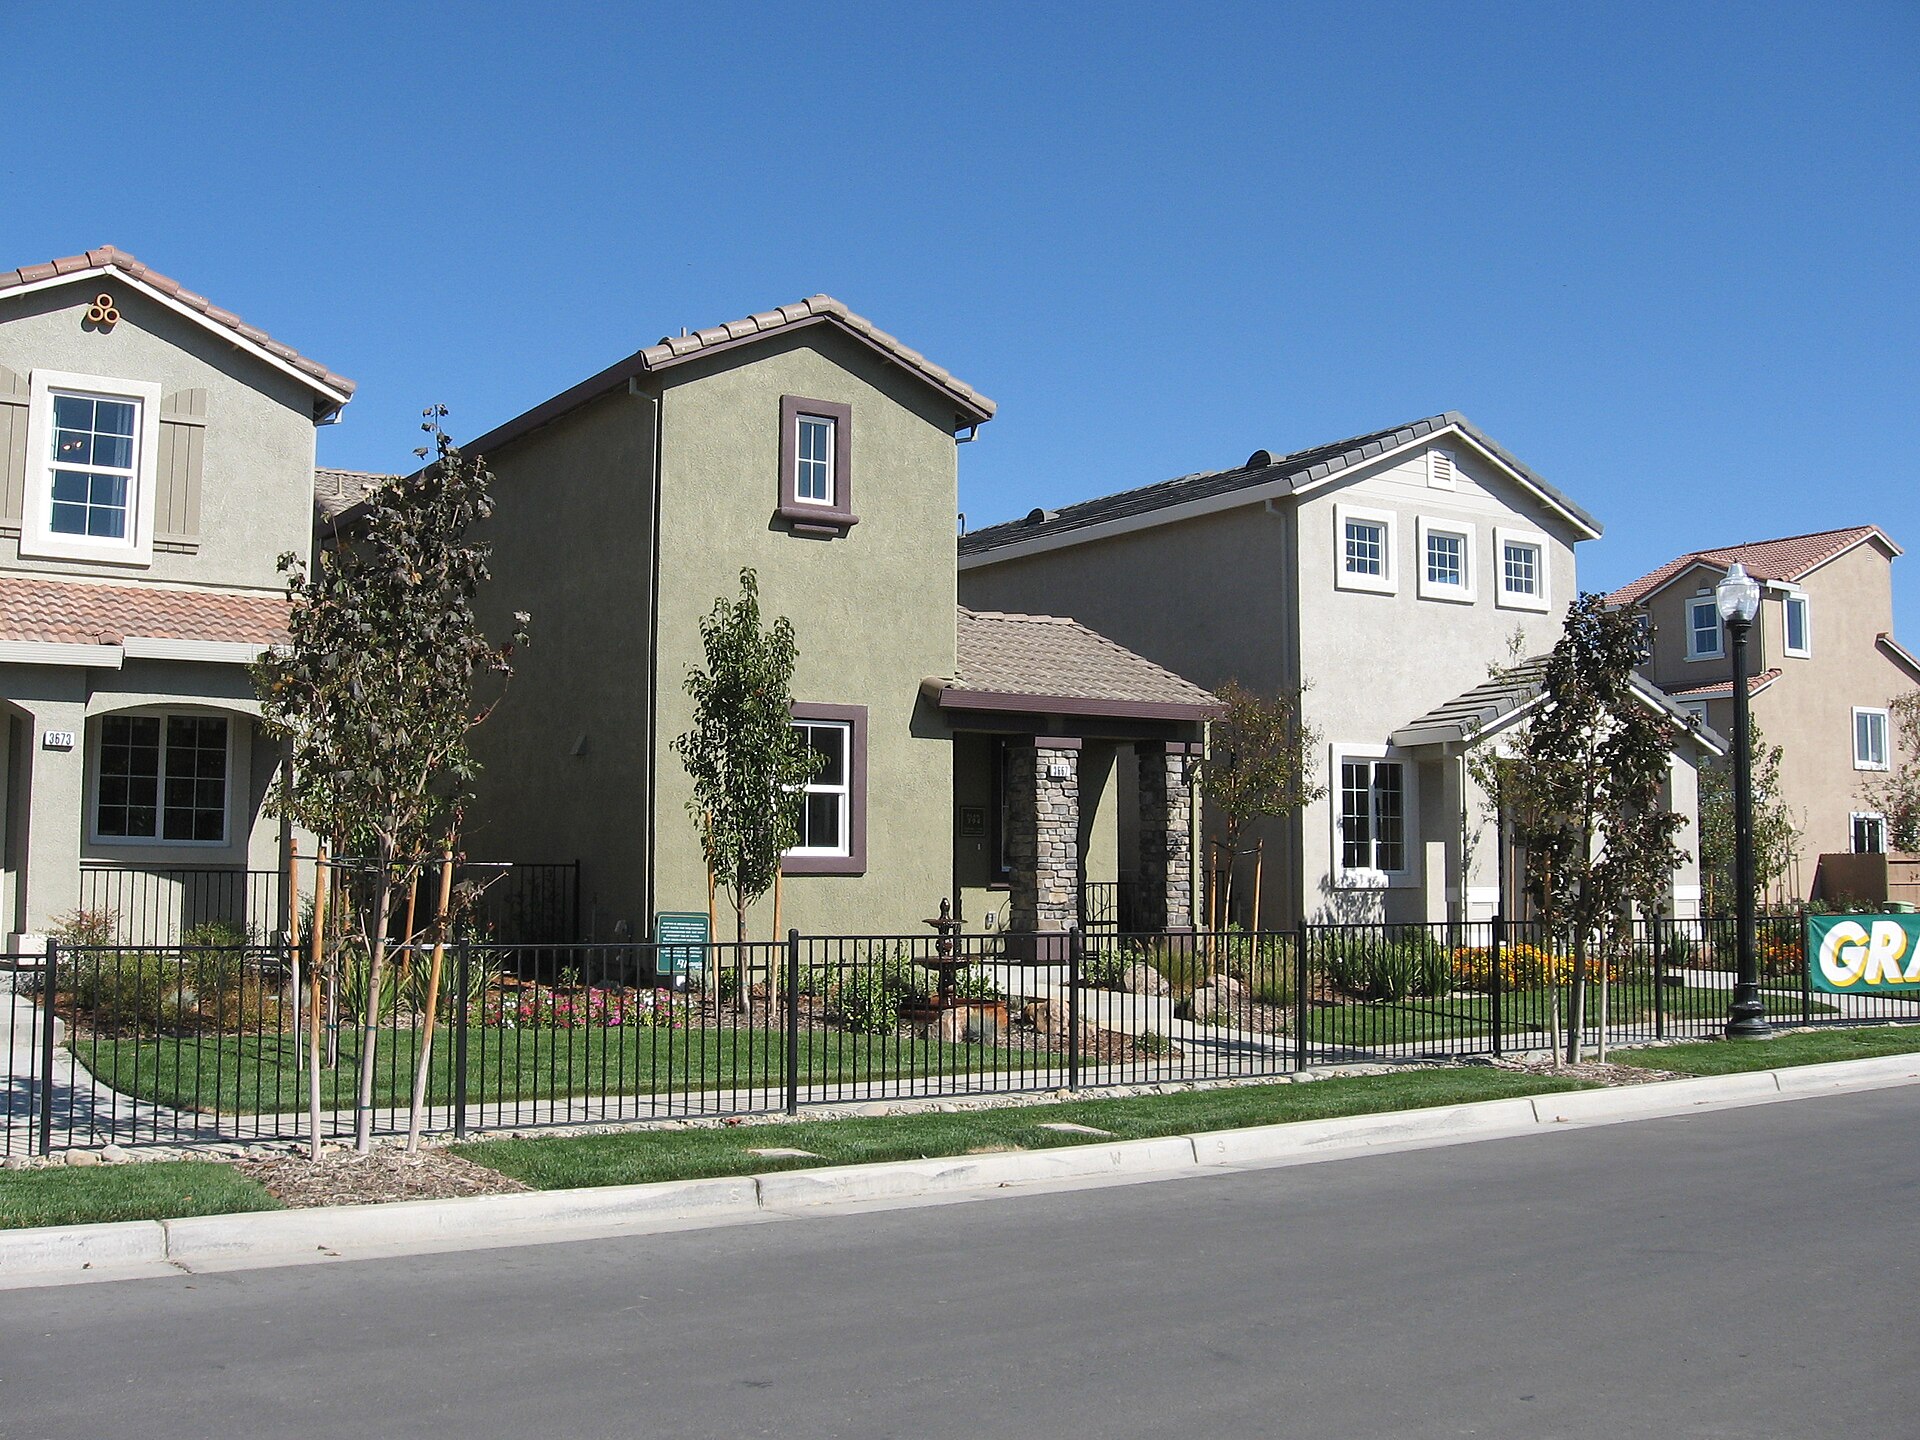

The government yardstick: the Census Survey of Construction
What the Census measures
The Census Bureau's Survey of Construction (SOC) samples new homes and publishes their characteristics every year; NAHB itself calls it "a much larger sample" designed to produce the national averages its own survey cannot.1 It is the standard source for the size, price and lot of new houses. It reports the nation and four regions; Idaho is in the West region with Montana, Wyoming, Colorado, New Mexico, Arizona, Utah, Nevada, Washington, Oregon, California, Alaska and Hawaii. The SOC publishes no Idaho figure, so any Idaho new-home price comes from somewhere else (a multiple listing service, an assessor or a builder).18
The Census released its 2025 annual tables on July 1, 2026. Of 1,005,000 single-family homes completed in 2025, the median size was 2,142 square feet. Of 678,000 new single-family homes sold in 2025, the median sales price was $417,400 and the average $523,800.1819
Price, size and lot, 2000 to 2025
| Year | Median price, new single-family sold, U.S. | Median price, West | Median price per sq. ft., U.S. | Median price per sq. ft., West | Median size completed, U.S. (sq. ft.) | Median size, West |
|---|---|---|---|---|---|---|
| 2000 | $169,000 | $196,400 | $65.59 | $72.28 | 2,057 | 2,014 |
| 2005 | $240,900 | $332,600 | $83.61 | $106.29 | 2,227 | 2,236 |
| 2010 | $221,800 | $259,300 | $77.48 | $89.11 | 2,169 | 2,143 |
| 2015 | $294,200 | $348,500 | $92.14 | $110.95 | 2,467 | 2,435 |
| 2020 | $330,900 | $414,400 | $112.47 | $148.88 | 2,261 | 2,242 |
| 2022 | $434,500 | $568,200 | $156.37 | $209.68 | 2,299 | 2,284 |
| 2024 | $420,300 | $550,900 | $155.51 | $210.98 | 2,146 | 2,131 |
| 2025 | $417,400 | $541,900 | $154.79 | $212.50 | 2,142 | 2,090 |
Sources: Census Bureau, Characteristics of New Housing 2025, tables of median and average sales price, median and average square feet (single-family completed) and median price per square foot (single-family sold). Nominal dollars.192021
Four facts come out of that table. The median new home in the West cost $541,900 in 2025, about $124,500 more than the national median, and the gap was wider than in 2000 ($27,400). From 2000 to 2025 the West's median rose 176 percent and the nation's 147 percent, both in nominal dollars (our calculation). Prices per square foot in the West roughly tripled ($72.28 to $212.50). And houses did not keep growing: the median new home completed in 2025 (2,142 square feet) was smaller than in 2015 (2,467), and in the West the median was 2,090 square feet, about the size of 2000's.192021
Lots got smaller too. The median lot of a new single-family house sold in the West was 5,969 square feet in 2025, down from 6,591 in 2009; nationally it was 8,307 square feet. In 2025, 65 percent of new homes sold in the West sat on lots under 7,000 square feet, against 55 percent in 2009.2223 Smaller houses on smaller lots are how builders have kept a lid on the price per home while the price per square foot rose. Inflation-adjusted comparisons of Idaho home prices are in Part A, lesson 9; this lesson does not repeat them.
The cheap end of the new-home market nearly vanished in the West. Of an estimated 150,000 new single-family homes sold in the West in 2025, about 3,000 (2 percent) sold for under $300,000, against 13 percent of Western sales in 2020. Nationally 18 percent still sold under $300,000 in 2025, most of them in the South.24
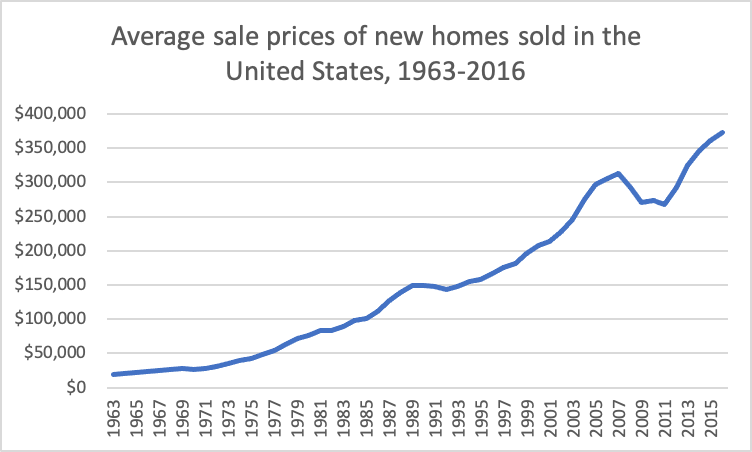

Idaho in the permit data
The only Idaho-wide number on what new houses cost to build comes from building permits. The Census Building Permits Survey collects, from each permit office, the number of new homes authorized and their "valuation," which the Census defines as "the estimated value of the residential structure as shown on the building permit." If no value is on the permit, the Census accepts the permit official's estimate.25 The value covers the structure, not the lot, and it is the value written on the permit, which is often set from a valuation table rather than the builder's real cost.
| Year | Idaho single-family units permitted | Idaho total valuation | Idaho average per unit | U.S. average per unit |
|---|---|---|---|---|
| 2015 | 7,784 | $1.754 billion | $225,398 | $238,904 |
| 2020 | 14,969 | $3.472 billion | $231,918 | $248,554 |
| 2025 | 14,112 | $4.243 billion | $300,660 | $320,814 |
Source: Census Bureau, Building Permits Survey, annual state files for 2015, 2020 and 2025 (units and valuation, imputed totals). Averages are our calculation: valuation divided by units.2627 On permits, the average new Idaho house was valued about 6 percent below the national average in 2025, and its permitted value rose about 30 percent from 2020 to 2025 (nominal). Read beside the Census sale prices above, the permit values suggest that the structure itself is valued in Idaho close to the national average, while Western sale prices run well above it; the permit data cannot say how much of that gap is land, fees, profit or demand, because permits record only the structure.
Land: what a "finished lot" costs and why
Raw land vs. a finished lot
A buyer sees one price, but a builder buys a lot that has already passed through several hands and several public approvals. A farm field becomes a finished lot when a developer gets it annexed or zoned, records a subdivision plat, builds the streets, water and sewer lines, storm drains and irrigation ditches inside it, and pays the fees owed at the development stage. The steps are in Subdivisions and Plats Step by Step, and the loss of farmland that feeds the lot supply is in Farmland to Rooftops. NAHB's "finished lot cost" line counts all of that, plus the cost of financing the lot, which is why its 2024 average ($91,057) is much more than the price of raw ground.1
NAHB's 2021 regulation study, a separate survey of 57 land developers, gives a rough idea of how much of a lot's price comes from government requirements at the development stage. Developers estimated that regulation during development (approval costs, development requirements beyond what the developer would otherwise build, the cost of applying for and waiting on approvals, and fees) came to 10.5 percent of the final house price, or $41,330 on the $394,300 average new-home price at the time. That is the developers' own estimate of costs that would not exist without regulation, and like all of NAHB's numbers it is a national industry survey.1314
What the data say about land prices
There is no Idaho price index for residential lots. The SOC reports lot size, not lot price, for homes sold, and the Census sale price includes the lot.22 County assessors value land each year, and the Idaho State Tax Commission compiles those values (see Reading Your Assessment and Levy), but an assessed land value is an estimate for tax purposes, not a sale price. Sale prices are hard to get as well: the Idaho Capital Sun reported in 2021 that Idaho "is one of 10 states where there is no legal obligation to publicly disclose the sale price," and that assessors rely mainly on the Intermountain Multiple Listing Service and a voluntary disclosure form, a problem Ada County assessors said was worst for commercial and land sales.28 Real estate listing services and private data firms track lot sales; their numbers are proprietary and not used here.
Two public facts still bear on land in Idaho. First, lots are shrinking: the West's median new-home lot was 5,969 square feet in 2025, and two-thirds of Western new homes sold that year sat on lots under 7,000 square feet.2223 Second, the 2026 Legislature passed starter-home and accessory dwelling unit laws aimed at lot size and land use in larger cities; what they require and when is covered in The 2026 Housing Laws, and this lesson does not repeat it.
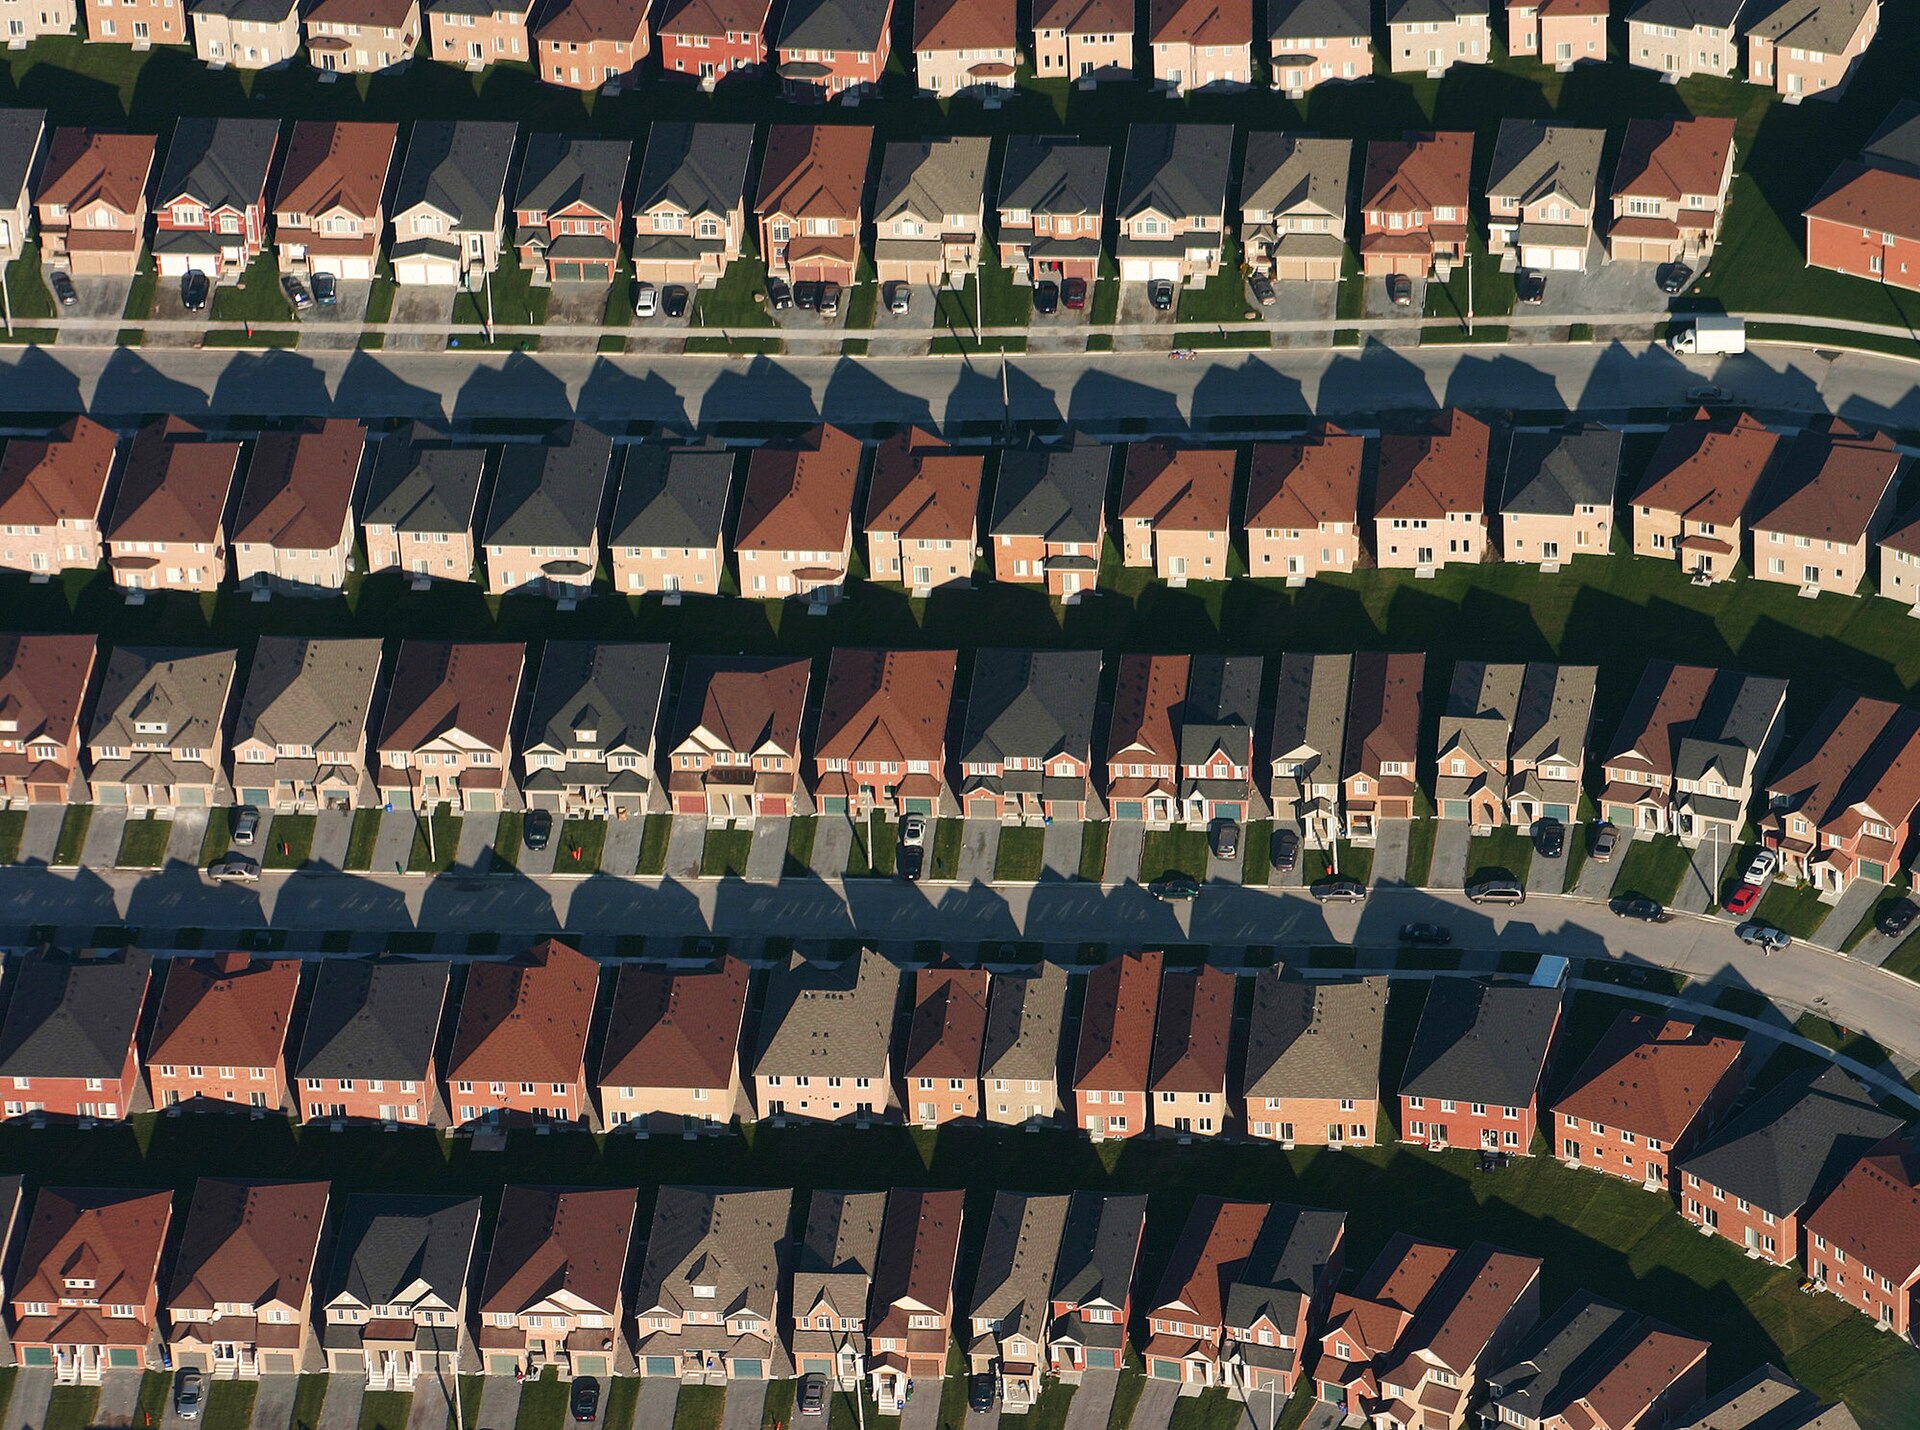

Labor: who builds the house and what they earn
Labor is inside every line
No survey cited here gives labor's share of a new home's price. NAHB's construction cost items mix labor and materials because most of the work is done by subcontractors who quote an installed price.1 Lesson 7 covers the labor supply itself (how many Idahoans work in construction, the loss of trades after 2008, apprenticeships). This section gives the wage data.
What Idaho trades earn
The Bureau of Labor Statistics' Occupational Employment and Wage Statistics (OEWS) survey estimates employment and wages by occupation for every state and metropolitan area. The figures are for each occupation in all industries (a carpenter working for a commercial contractor counts the same as one framing houses) and they are wages only, without employer-paid benefits or payroll taxes.8
| Occupation (SOC code), May 2025 | Idaho employment | Idaho median hourly | U.S. median hourly | Boise City metro median | Twin Falls metro median |
|---|---|---|---|---|---|
| All occupations (00-0000) | 857,440 | $23.06 | $24.51 | $23.60 | $21.83 |
| Construction and extraction occupations (47-0000) | 56,350 | $27.00 | $28.63 | $27.38 | $23.38 |
| Carpenters (47-2031) | 8,380 | $25.00 | $29.12 | $24.45 | $22.82 |
| Construction laborers (47-2061) | 10,850 | $22.57 | $22.66 | $22.84 | $20.51 |
| Electricians (47-2111) | 5,690 | $30.29 | $30.38 | $29.62 | $27.89 |
| Plumbers, pipefitters and steamfitters (47-2152) | 3,090 | $25.18 | $30.67 | $27.38 | $24.38 |
| Construction and building inspectors (47-4011) | 1,000 | $30.56 | $35.91 | $30.14 | $36.41 |
Source: BLS OEWS, May 2025 estimates for Idaho, the United States, the Boise City metropolitan area and the Twin Falls metropolitan area, retrieved through the BLS public data interface by series ID (for example OEUS160000000000047000008 for the Idaho construction and extraction median).892930 Small cells are less reliable: the Twin Falls metro inspector figure rests on an estimated 30 jobs.30
The Idaho pattern is consistent: construction pay is a little below the national median, and Magic Valley pay is below the Boise area's. Idaho's construction median ($27.00) is 94 percent of the national median; Twin Falls' ($23.38) is 82 percent (our calculation). Relative to other Idaho jobs, though, construction pays well: the Idaho construction median is about 17 percent above the median for all Idaho occupations ($23.06), about the same premium as nationally (our calculation).8930
The annual mean wages tell the same story: $58,890 for Idaho construction and extraction workers against $65,360 nationally; $66,600 for Idaho electricians against $71,490; $58,450 for Idaho plumbers against $72,170.89 A buyer paying a Western price for a new home is not mostly paying for higher Idaho wages; the wage data and the permit valuations both point the same way.
What the wage data cannot show is how labor costs changed for builders during the boom, because builders pay subcontractors by the job or by the square foot, and those prices are not public. NAHB attributed part of the 2022 to 2024 rise in construction cost to faster wage growth from labor shortages, an industry statement rather than a measurement.17
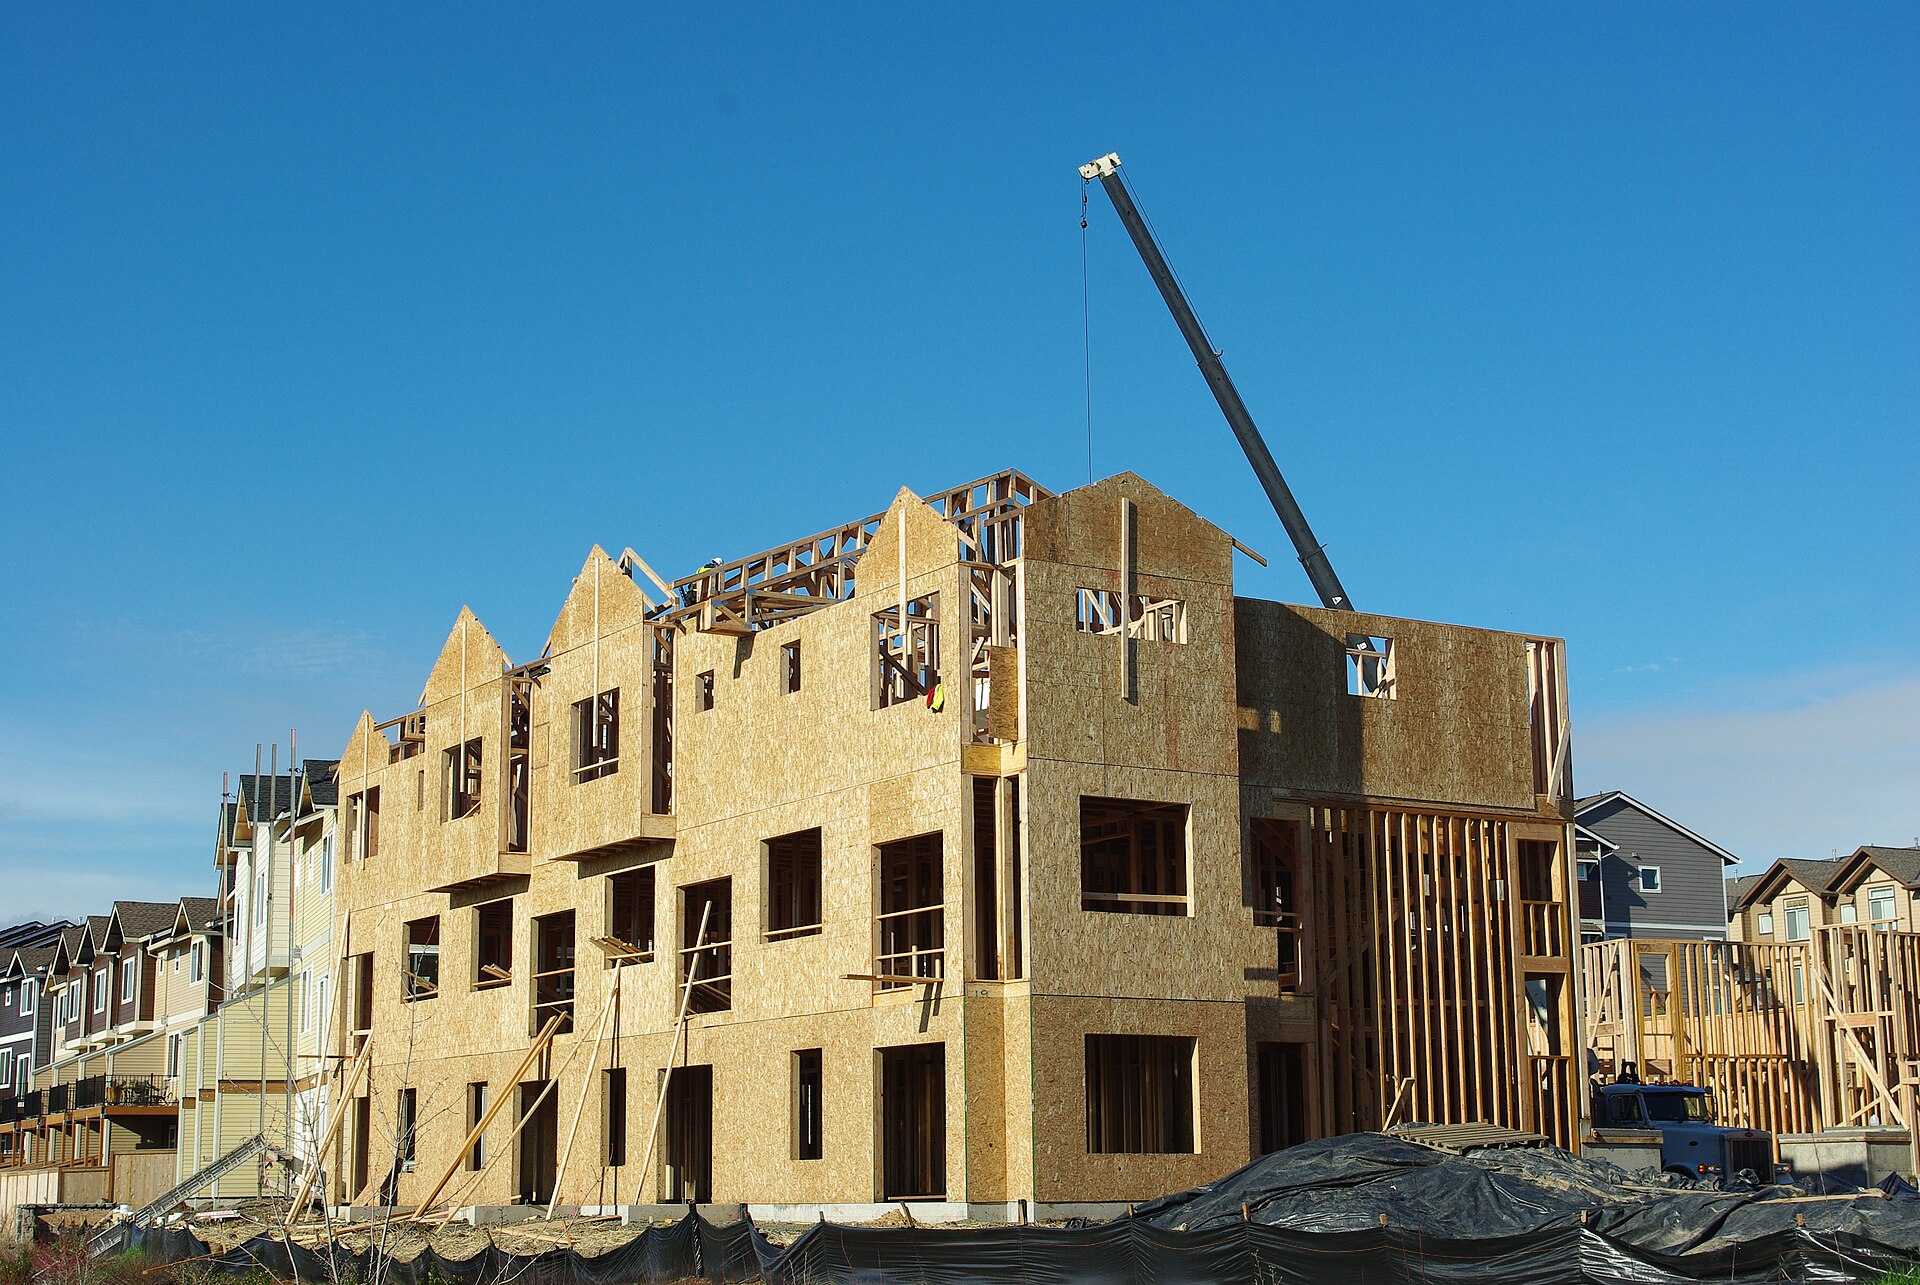

Fees: what Idaho cities and districts charge a new house
Four kinds of fees, four sets of rules
A new house in an Idaho city pays up to four kinds of one-time public charges. Each has its own legal basis, and Idaho law keeps them apart.
- Building permit, plan review and trade permit fees. These pay for checking plans and inspecting the work. The Idaho Development Impact Fee Act says an impact fee "does not include" a "charge or fee to pay the administrative, plan review, or inspection costs associated with permits required for development" (Idaho Code 67-8203(9)(a)).31 Many Idaho cities set the building permit fee from the project's value, using a table of dollars per thousand of valuation. Twin Falls, for example, sets valuation from the International Code Council's Building Valuation Data, published each August, and charges a residential plan review fee of 30 percent of the building permit fee.326 The ICC says it developed that data "to aid jurisdictions in determining permit fees."33 Lesson 3 walks through a permit at the counter.
- Impact fees. A payment "imposed as a condition of development approval to pay for a proportionate share of the cost of system improvements needed to serve development" (Idaho Code 67-8203(9)). Impact fees may pay only for the public facilities the Act lists: water, wastewater, roads, stormwater, parks and public safety (67-8203(24)). A fee "shall not exceed a proportionate share of the cost of system improvements" and may be collected no earlier than the start of construction or the issuance of a building permit, unless the developer agrees otherwise (Idaho Code 67-8204(1) and (3)).3134 The definitions section was last amended in 2026 (2026 Session Laws ch. 203, according to the section's history note); Part B identifies the 2026 change that added fire protection and ambulance service districts to the entities that may charge impact fees.31
- Utility connection and capacity fees. The Act excludes "connection or hookup charges" and availability charges for services provided directly to the development (67-8203(9)(b) and (c)).31 Those fees fall under other laws, including the rule that a taxing district's fees for services "shall be reasonably related to, but shall not exceed, the actual cost of the service being rendered" (Idaho Code 63-1311(1)).35 The Idaho Supreme Court cases on when such a fee becomes an illegal tax are in Part B, lesson 7.
- Fees and improvements at the subdivision stage. Streets and pipes inside a subdivision, plat review fees and any "voluntary" payments in a development agreement are paid by the developer and show up in the lot price, not on the house's permit.
A city may exempt affordable housing from impact fees only if its long-range plan supports the exemption and the exempt project's share is paid "through a revenue source other than development impact fees" (Idaho Code 67-8204(10)).34 In other words, an exemption moves the cost to someone else; it does not erase it.
A hypothetical 2,000 square foot house in four Idaho cities
To compare cities, we built one made-up house: a detached single-family home with 2,000 square feet of heated floor area, on a lot already served by city water and sewer, with a declared construction value of $300,660, the average value per new single-family unit on Idaho building permits in 2025.26 Then we added the fees in each city's published schedule. Where a schedule could not be found or confirmed, we left that fee out and say so. This is an illustration, not a quote for any real permit.
| Fee (hypothetical house) | Meridian | Boise (Central Bench) | Twin Falls | Coeur d'Alene (city's own example) |
|---|---|---|---|---|
| City impact fees | $5,516 (parks $4,119, police $402, fire $995; 1,701 to 2,500 sq. ft.) | $6,534.06 plus 1% surcharge $65.34 = $6,599.40 (1,401 to 2,100 sq. ft.) | $4,982 (police $276, fire $1,105, parks $1,918, streets $1,683) | $1,839.82 |
| Road impact fee (Ada County Highway District) | $5,803 | $5,803 | None (no countywide highway district fee) | None listed |
| Water connection or assessment | $1,696 water assessment | Not included (not confirmed) | $449.28 water meter fee at permit | $2,672 water capitalization plus $130 meter |
| Sewer connection or assessment | $5,807 sewer assessment | Not included (not confirmed) | $512.54 capacity fee plus $105 tap | $3,325 sewer capitalization |
| Building permit and plan review | Not included (schedule not reachable) | Not included (not confirmed) | $1,900 permit plus $570 plan review (30%) | $1,553.75 permit plus $155.38 plan review |
| Trade permits | Not included | Not included | $360 (mechanical, electrical and plumbing, $120 each) | $400 (mechanical and plumbing; electrical by the state) |
| Other listed | $300 street trees; $75 stormwater and $50 encroachment marked "may or may not apply" | |||
| Total of fees counted | $18,822 | $12,402.40 | $8,878.82 | $10,500.95 (city's total) |
Sources: ACHD Ordinance 254; Meridian Ordinance 22-2004 and the city's June 1, 2026 water and sewer assessments; Boise impact fee schedule effective Oct. 1, 2026; Twin Falls master fee schedule, impact fees effective Jan. 1, 2026, and 2025 to 2026 sewer and water connection fees; City of Coeur d'Alene "Estimated Residential Construction Fees" page, which uses a $200,000 average project value and does not show a date.4353667373839
How we figured it: the fee stack for a hypothetical house
The made-up house. 2,000 square feet of climate-controlled floor area, detached, one dwelling, inside city limits, with water and sewer at the lot line. Declared value $300,660, which is Idaho's 2025 Building Permits Survey valuation ($4,242,918,000) divided by single-family units (14,112).26
Meridian. Impact fees for 1,701 to 2,500 square feet: $4,119 + $402 + $995 = $5,516. ACHD single-family road fee $5,803. Water assessment $1,696. Sewer assessment $5,807. Total $18,822. The Meridian building permit was left out because the city's fee pages were behind a browser check we could not pass; Meridian's assessments notice does not say whether its amounts are per single-family home, so we treated them as one home's charge, as Part B did.345
Boise, Central Bench planning area. 1,401 to 2,100 square feet: regional parks $1,721.11 + local parks $2,220.56 + fire $2,056.52 + police $535.87 = $6,534.06; plus the 1 percent surcharge for capital plan preparation ($65.34) = $6,599.40; plus ACHD $5,803 = $12,402.40. Boise water and sewer connection charges were not confirmed for this lesson, so neither is included.364
Twin Falls. Building permit for $300,660 of value: the schedule charges $895 for the first $100,000 plus $5 for each additional $1,000 "or fraction thereof"; $200,660 over $100,000 is 201 thousands or fractions, so $895 + $1,005 = $1,900. Residential plan review at 30 percent: $570. Mechanical, electrical and plumbing residential permits at $120 each for 0 to 2,500 square feet, separate permit for each trade: $360. Impact fees $4,982. Sewer capacity $512.54 and 4-inch tap $105. Water meter fee $449.28. Total $8,878.82. Left out: the $3,088.47 charge when the city itself installs the service line and meter, which depends on who does the work.673738 The schedule's footnote also says the declared value for a home may not be more than 20 percent above or below the average per square foot value of homes permitted in Twin Falls the prior fiscal year, so a real permit's value could differ from ours.6
Coeur d'Alene. We did not compute this column; it is the city's own published example for a house with a $200,000 average project value, and it lists water and sewer hookup, two area fees, stormwater and encroachment fees as items that "may or may not apply."39
Limits. The four totals cover different lists of fees, so they are not a ranking. Fee schedules change yearly; the Twin Falls water and sewer schedules we used ran through Sept. 30, 2026. Private utility charges, irrigation district or ditch company charges, school "voluntary" payments and the developer's subdivision costs are not included anywhere.
The comparison shows where the money goes more than which city is "expensive." In Ada County the road fee alone ($5,803) is about the size of Meridian's or Twin Falls' whole city impact fee, because the Act lets a "single countywide" highway district charge an impact fee and the Ada County Highway District is one; Part B explains why the highway districts in Twin Falls, Jerome and Gooding counties do not charge one.431 In Meridian the water and sewer assessments ($7,503) are larger than the city's impact fees.5 And the permit and plan review fees, the part of the bill most often blamed for slow approvals, were about $2,470 of Twin Falls' $8,878.82, or 28 percent (our calculation).6 The fee bar chart in the Pictures section below draws these totals beside NAHB's national average.
Jerome, Nampa, Caldwell and the small towns
We could not confirm a current residential fee schedule from a primary record for Jerome, Nampa or Caldwell for this lesson. Caldwell's city code has an impact fee chapter for police, fire and parks and recreation, adopted by Ordinance 2671 in 2007 and amended in 2021, that refers to a separate fee schedule we did not find.40 Nampa's 2019 impact fee increase is described in Part B. Part B also found no published impact fee schedule for Jerome, Gooding, Buhl or Hagerman. The Development Impact Fee Act requires any city that charges impact fees to prepare an annual report on them, so a records request to the city clerk is the way to find out whether a fee exists and what it raised (see Idaho Public Records Requests).
Regulation in the price: the 23.8 percent figure and its limits
What NAHB estimated
The number most often quoted in Idaho fee and code debates is NAHB's: "regulations imposed by government at all levels account for 23.8 percent of the final price of a new single-family home built for sale." Applied to the average new-home price of $394,300 at the time (spring 2021), that was $93,870: $41,330 from regulation during land development and $52,540 from regulation during construction, or 10.5 and 13.3 percent of the price. The 2016 edition of the study had put the share at 24.3 percent; NAHB's 2011 study had put the dollar figure at $65,224 and the 2016 study at $84,671.13
How NAHB got there matters. It sent a survey to a panel of 2,071 members who develop lots, and 57 gave complete usable answers; it added special questions to its monthly builder sentiment survey (the NAHB/Wells Fargo Housing Market Index) and 280 builders answered them. The questions asked developers for costs as a share of the lot price and builders for costs as a share of construction cost. NAHB then converted the answers to shares of a house price using its own assumptions about construction costs, loan terms, build times and margins.14
| Regulatory cost category (NAHB 2021) | Share reporting it | Share of final house price, averaged across all homes |
|---|---|---|
| During lot development (57 developers) | ||
| Cost of applying for zoning approval | 98.1% | 1.6% |
| Hard costs of compliance (fees, required studies) | 100.0% | 3.0% |
| Land dedicated to government or left unbuilt | 94.0% | 2.8% |
| Development standards beyond the ordinary (setbacks and similar) | 85.4% | 2.3% |
| OSHA and other labor requirements | 58.3% | 0.5% |
| Pure cost of delay | 95.9% | 0.4% |
| All development regulation | 100.0% | 10.5% |
| During construction (280 builders) | ||
| Fees paid by the builder after buying the lot | 91.1% | 3.1% |
| Changes to building codes over the past 10 years | 90.2% | 6.1% |
| Architectural design standards beyond the ordinary | 57.5% | 2.7% |
| OSHA and other labor requirements | 63.8% | 1.1% |
| Pure cost of delay | 89.5% | 0.2% |
| All construction regulation | 98.9% | 13.3% |
| Total | 23.8% | |
Source: NAHB, Government Regulation in the Price of a New Home: 2021, Table 1 (industry survey). Developers who reported delays said they averaged roughly 6 months.14 The single largest item is builders' estimate of what building code changes over the previous 10 years added: 6.1 percent of the price. Fees, the item most often argued about at city councils, came to 3.0 percent at the development stage plus 3.1 percent at the construction stage in NAHB's estimate.14
The best case for the number, and the best case against it
For it. The builders and developers who answer are the people who write the checks, and NAHB asks for things they can reasonably know. The study also says plainly what it is not: it "is not arguing that all regulation is bad or should be eliminated," nor "trying to estimate a share of regulation that may be excessive." Its purpose, NAHB says, is a "numerical estimate of how much regulation exists and its aggregate dollar value" for policymakers.13 Some items in it, such as impact and permit fees, can be checked against published schedules, as this lesson does for four Idaho cities.
Against it. The estimate rests on small, self-selected samples of an industry group that takes public positions on many of the rules it is measuring. NAHB acknowledges that builders cannot split costs by level of government, so a city council, the Legislature, a federal agency and a model code committee all land in the same total.14 The survey counts costs and not benefits: a sewer plant paid by impact fees, a fire separation required by code or a stormwater pond required by a permit have value to the buyer and the neighbors that the 23.8 percent does not subtract. And "regulation" in the survey includes the cost of time, which depends on estimates of carrying costs rather than records.
Research that complicates the story. Not every study finds that fees simply raise prices and choke supply. Gregory Burge and Keith Ihlanfeldt studied Florida counties from 1993 to 2003 and found that impact fees for services other than water and sewer "increase the construction of small homes within inner suburban areas and of medium and large homes within all suburban areas." Their explanation was that fees can reduce local opposition and the other, slower ways communities ration growth.41 That is one study from one state two decades ago, and it does not show that a particular Idaho fee is set right; it shows that the sign of the effect is an empirical question.
What Idaho records can test
The fee portion of the NAHB estimate can be checked in Idaho with public records: impact fee schedules, utility connection fees, building permit schedules and each city's annual impact fee report. The fee stack above is one such check. The other portions (the cost of code requirements, delays, and land set aside) cannot be checked from any Idaho dataset we found. Lesson 2 covers which code editions Idaho adopted and the fights over them; the Legislature's fiscal notes on code bills are the closest public estimates of code costs.
Money: financing the build and the buyer
The builder's money
Builders borrow to buy lots and to build, then repay the loans when a house sells. In the NAHB survey, financing during construction was $10,220, 1.5 percent of the price, in 2024, down from 1.9 percent in 2022; the lot line also includes financing on the lot.12 Large public builders finance more of their work with their own cash and bond markets; small builders depend on bank construction loans, whose rates are negotiated loan by loan and are not published for Idaho. We found no public Idaho data on construction loan rates or terms.
The buyer's money
The cost of a mortgage is the part of the price that changed most since 2021. Freddie Mac's Primary Mortgage Market Survey (PMMS) publishes a weekly average rate for a 30-year fixed-rate mortgage. Averaging the weekly figures by calendar year (our calculation):
| Year | Average 30-year fixed rate | Low week | High week |
|---|---|---|---|
| 2019 | 3.94% | 3.49% (Sept. 5) | 4.51% (Jan. 3) |
| 2020 | 3.11% | 2.66% (Dec. 24) | 3.72% (Jan. 2) |
| 2021 | 2.96% | 2.65% (Jan. 7) | 3.18% (April 1) |
| 2022 | 5.34% | 3.22% (Jan. 6) | 7.08% (Oct. 27) |
| 2023 | 6.81% | 6.09% (Feb. 2) | 7.79% (Oct. 26) |
| 2024 | 6.72% | 6.08% (Sept. 26) | 7.22% (May 2) |
| 2025 | 6.60% | 6.15% (Dec. 31) | 7.04% (Jan. 16) |
| 2026 (through Nov. 19) | 6.56% | 5.98% (Feb. 26) | 7.40% (Oct. 8) |
Source: Freddie Mac, PMMS weekly history file, 30-year fixed series, downloaded Nov. 20, 2026; yearly averages, lows and highs are our calculation. The most recent weekly figure was 7.28 percent on Nov. 19, 2026.1042 For perspective, the same file shows a 1981 average of 16.64 percent and a 2000 average of 8.05 percent.10
How we figured it: what the rate does to a monthly payment
Hypothetical loan. $400,000 borrowed for 30 years at a fixed rate, principal and interest only (no taxes, insurance or mortgage insurance). The amount is made up for illustration.
Formula. Monthly payment = L x r / (1 - (1 + r) to the power -360), where L is the loan and r the annual rate divided by 12.
Results. At 2.96 percent (2021 average): $1,677.80. At 6.56 percent (2026 average to date): $2,544.08. Difference: $866.28 a month. At 5.56 percent (one point lower than 6.56): $2,286.24, or $257.84 a month less than at 6.56 percent, about $92,822 over 360 payments if the loan ran its full term.10
Limits. Real loans differ in points, fees, down payment and the buyer's credit. A rate "buydown" can be permanent or temporary; a temporary one lowers the payment only for the first year or years.
Rate buydowns and incentives
When rates rose, large builders began paying part of buyers' interest costs instead of cutting list prices. A buydown is a payment, usually made at closing, that lowers the buyer's rate; when the builder pays it, it is a cost of selling the house. D.R. Horton's 2026 annual report says the company uses "a variety of incentives, including mortgage rate buydowns," and that its home sales gross margin fell to 20.2 percent from 21.5 percent "reflecting a 2% decline in our average sales price and higher incentives, including mortgage rate buydowns."11 Lennar's 2025 annual report says its sales incentives, "primarily price discounts on individual homes and financing incentives," averaged $62,700 a home (13.8 percent of home sales revenue) in fiscal 2025, against $48,800 (10.3 percent) in 2024 and $42,900 (8.8 percent) in 2023.12
Incentives change what a "price" means. A buyer who takes a builder-paid buydown pays the full list price but a lower rate; another buyer may take a lower price at the market rate. Census sale prices and permit values do not capture the buydown. Lesson 10 covers what a buyer can learn from a purchase contract; programs that help first-time buyers in Idaho with down payments and rates are in First-Time Buyer Assistance.
Builder margins: what the annual reports show
Reading a 10-K
Publicly traded builders file an annual report, Form 10-K, with the Securities and Exchange Commission. Two numbers in it matter for this lesson. The home sales gross margin is home sales revenue minus the cost of the homes sold (land, construction and some financing), divided by revenue. It is before the company's overhead, sales and administrative costs. Pre-tax income is what is left after those costs. Neither is broken out by state.
| Measure | D.R. Horton (year ended Sept. 30, 2026) | Lennar (year ended Nov. 30, 2025) | NAHB survey, 2024 (industry survey) |
|---|---|---|---|
| Home sales gross margin | 20.2% (21.5% in fiscal 2025) | 17.7% (22.3% in fiscal 2024) | Not reported |
| Pre-tax profit | Homebuilding pre-tax income 11.2% of homebuilding revenue (13.1% in fiscal 2025) | Not used here | 11.0% of sales price |
| Overhead (selling, general and administrative) | Homebuilding SG&A 8.9% of homebuilding revenue (8.3% in fiscal 2025) | Not used here | Overhead 5.7%, marketing 0.8%, commission 2.8% |
| Homes and average price | 84,202 homes closed, average closing price $363,600 | 82,583 homes delivered, average sales price $391,000 | Typical home, average price $665,298 |
| Sales incentives | "higher incentives, including mortgage rate buydowns" | $62,700 a home, 13.8% of home sales revenue | Not reported |
| Idaho mention | Idaho listed in the Northwest reporting region | Idaho listed in the West segment; deliveries rose in Idaho and Utah and average price rose only in Idaho within the segment | No state detail |
Sources: D.R. Horton, Inc., Form 10-K for fiscal 2026, filed Nov. 18, 2026; Lennar Corporation, Form 10-K for fiscal 2025, filed Jan. 28, 2026; NAHB 2024 survey.114344121 Lennar's report says that in its West segment, home sales revenue fell because deliveries fell "in all states in the segment except in Idaho and Utah" and the average sales price fell "in all the states in the segment except in Idaho."44
Two things are worth noticing. D.R. Horton's homebuilding pre-tax margin (11.2 percent) is close to the NAHB survey's pre-tax profit share (11.0 percent), from very different sources. And both big builders' margins fell as incentives rose, which is the practical meaning of Lennar's phrase that it uses "gross margin as a shock absorber" to keep sales moving.44 Margins are not fixed; they absorb part of rate and demand changes. These two companies are national, not Idaho-specific, and Idaho also has many private builders whose margins are not public.
Idaho compared with the United States
| Part of the price | What Idaho data show | What U.S. or West data show | Comparison |
|---|---|---|---|
| Structure value on permits | $300,660 average per new single-family unit, 2025 | $320,814 U.S., 2025 | Idaho about 6% lower (our calculation)26 |
| Sale price of a new home | No Census figure for Idaho | Median $541,900 West, $417,400 U.S., 2025 | Idaho is in the higher-priced West region19 |
| Construction wages | Median $27.00 an hour, May 2025 | $28.63 U.S. | Idaho about 6% lower89 |
| Public fees on a new house | $8,878.82 (Twin Falls) to $18,822 (Meridian, without the building permit), hypothetical 2,000 sq. ft. house, 2026 | $20,267 permit, impact and water and sewer fees, NAHB 2024 average | Different houses and fee lists; NAHB's home is larger and pricier1 |
| Mortgage rates | Same national market | 6.56% average 2026 to date | No Idaho difference measured10 |
| Lot size | No Idaho figure | Median lot 5,969 sq. ft. West, 8,307 U.S., 2025 | West lots about 28% smaller22 |
The picture is consistent across sources even though none of them is Idaho-specific on every point: the structure and the wages in Idaho cost about what they cost nationally or a bit less, fees vary more between Idaho cities than between Idaho and the national average, and the West's prices are higher than the nation's mainly in the parts of the price that public data do not split out for Idaho (land, profit and demand).
Pictures, Numbers and Infographics
| Measure | Idaho | U.S. or other region | Place or year | Source |
|---|---|---|---|---|
| Construction cost share of new-home price | No Idaho survey | 64.4% ($428,215 of $665,298) | U.S., 2024 | NAHB survey1 |
| Finished lot share | No Idaho survey | 13.7% (26.0% in 2004) | U.S., 2024 | NAHB survey2 |
| Builder pre-tax profit share | No Idaho survey | 11.0% (long-run average 9.8%) | U.S., 2024 | NAHB survey2 |
| Permit, impact and water and sewer fees | $8,878.82 to $18,822 (hypothetical house, four cities, different fee lists) | $20,267 | Idaho 2026; U.S. 2024 | City schedules; NAHB631 |
| ACHD road impact fee, single-family | $5,803 | None outside Ada County | Effective March 1, 2026 | ACHD4 |
| Median new home price | No Idaho figure | $541,900 West; $417,400 U.S. | 2025 | Census SOC19 |
| Median size of new home completed | No Idaho figure | 2,090 sq. ft. West; 2,142 U.S. | 2025 | Census SOC20 |
| Median lot, new home sold | No Idaho figure | 5,969 sq. ft. West; 8,307 U.S. | 2025 | Census SOC22 |
| Average permit value per new single-family unit | $300,660 | $320,814 U.S. | 2025 | Census BPS, our calculation26 |
| Median hourly wage, construction and extraction | $27.00 (Twin Falls metro $23.38) | $28.63 U.S. | May 2025 | BLS OEWS830 |
| 30-year fixed mortgage rate, yearly average | National market | 2.96% (2021); 6.56% (2026 to Nov. 19) | U.S. | Freddie Mac PMMS, our averages10 |
| Builder home sales gross margin | Not reported by state | D.R. Horton 20.2% (FY2026); Lennar 17.7% (FY2025) | National companies active in Idaho | Forms 10-K1144 |
| Regulation's share of new-home price | No Idaho estimate | 23.8% ($93,870) | U.S., 2021 | NAHB study13 |
Common mistakes
- Treating the NAHB breakdown as an Idaho breakdown. It is a national survey of 41 builders, and NAHB says the sample is too small for a geographic breakdown.115 Use it for proportions, not for Idaho dollars.
- Comparing NAHB's average price with the Census price. NAHB's $665,298 is not a national average new-home price; NAHB itself says it ran roughly $150,000 above the Census figure for the latest year then available. For averages, the Census SOC is the source.119
- Calling the 23.8 percent a measured cost. It is an estimate from surveys of builders and developers, with NAHB's own conversion assumptions. Quote it as "NAHB estimated," with the sample sizes.14
- Adding up fee lists that are not alike. One city's total may include water and sewer and the building permit, another's may not. Our Meridian figure leaves out the building permit; our Twin Falls figure includes it. A fair comparison lists every line.36
- Calling a connection fee an impact fee. The Development Impact Fee Act excludes connection or hookup charges and plan review and inspection fees from its definition of an impact fee, so they follow different rules (Idaho Code 67-8203(9)).31
- Reading a permit valuation as the price of a house. The Building Permits Survey records "the estimated value of the residential structure as shown on the building permit," which leaves out the lot and is often set by a table, not by the builder's real costs.25
- Comparing nominal prices across decades as if they were real. Every dollar figure in this lesson is nominal unless it says otherwise; inflation-adjusted Idaho prices are in Part A, lesson 9.
- Assuming a list price is the price paid. Builders' incentives averaged $62,700 a home at Lennar in fiscal 2025; a buydown changes the cost of a home without changing its recorded price.12
- Treating gross margin as profit. A builder's gross margin comes before overhead, sales and administrative costs. D.R. Horton's 20.2 percent gross margin became an 11.2 percent homebuilding pre-tax margin.11
What we know, what we don't, and what the data can show
What we know
- Nationally, construction cost is the largest part of a new home's price (64.4 percent in the 2024 NAHB survey) and the finished lot's share has fallen since 2004.2
- One-time public fees on a new house in Idaho cities in 2026 ranged in our hypothetical from under $9,000 (Twin Falls, all city fees counted) to about $18,800 (Meridian, without the building permit), and the Ada County Highway District fee alone was $5,803.634
- Idaho construction wages are near or below national medians, and lower in the Twin Falls area than in the Boise area.83029
- Mortgage rates in 2023 to 2026 averaged more than twice their 2021 level, and large builders responded with incentives that cut their margins.101112
- New homes in the West sell for far more than the national median, while their median size and lot have shrunk.192022
What we don't know
- The breakdown of a new home's price in Idaho: no public survey splits Idaho prices into land, construction, fees, financing and profit.
- Idaho lot prices over time: there is no public lot price index, and Idaho does not require sale prices to be disclosed.28
- Labor's share of construction cost, and what subcontractors charged Idaho builders during the 2020 to 2022 boom.
- Current residential fee schedules for Jerome, Nampa, Caldwell, Gooding, Buhl and Hagerman, which we could not confirm from a primary record for this lesson.
- How much of the NAHB regulation estimate applies in Idaho, where codes, fees and approval times differ from the national average.
- Private Idaho builders' margins and incentives, which are not public.
What the data can show
- Census Building Permits Survey (state, county and place files): the number and average permit value of new homes in each Idaho city or county by year, for tracking construction values over time.26
- City and district fee schedules and the annual impact fee reports the Development Impact Fee Act requires (explained in Part B, lesson 7): the fees on a sample house in any city, and how much impact fee money each city raised and spent.
- BLS OEWS: wages by trade in Idaho and its metro areas each May, for comparing labor costs with the nation.8
- Census Survey of Construction: size, lot, price and price per square foot of new homes in the West region since 1999 or earlier.19
- Freddie Mac PMMS: weekly mortgage rates since 1971, for payment comparisons.10
- Builders' Forms 10-K and quarterly 10-Q reports: margins, incentives and average prices for public companies, with occasional state-level remarks.44
- County assessor land values and the State Tax Commission's yearly reports: trends in assessed land value, with the caution that assessments are not sale prices.
Questions people ask
How much of a new home's price is the house itself?
In NAHB's 2024 national survey, construction cost (labor, materials, subcontractors, permits and fees, design) was 64.4 percent of the average price. The finished lot was 13.7 percent; the rest went to financing, overhead, marketing, commissions and pre-tax profit.1 Idaho has no comparable survey.
Do impact fees make Idaho houses more expensive?
They add a one-time cost that the builder pays at permit and usually passes into the price; in our hypothetical, city impact fees ran from $4,982 in Twin Falls to $6,599.40 in Boise's Central Bench area, plus $5,803 for the road fee anywhere in Ada County.7364 Whether they raise prices more than the alternatives (property taxes, utility rates, or slower approvals) is disputed; one Florida study found that some impact fees increased construction.41 The law and the arguments are in Part B, lesson 7.
Why does a new home cost more in the West than in the rest of the country?
The Census shows the gap (a $541,900 median in the West against $417,400 nationally in 2025) but not its causes.19 Idaho's permit values and construction wages are near or below national levels, which points away from the structure and the labor and toward land, demand and other costs that public data do not separate for Idaho.268
Are builders making record profits?
Not in the latest filings. D.R. Horton's home sales gross margin fell from 21.5 to 20.2 percent in fiscal 2026 and Lennar's from 22.3 to 17.7 percent in fiscal 2025, as both used more incentives. NAHB's survey put pre-tax profit at 11.0 percent of the price in 2024, against a 9.8 percent average since 1998.11442 Public companies are not the whole market, and private builders' margins are not published.
What is a builder rate buydown?
A payment, usually at closing, that lowers the buyer's interest rate for the life of the loan or for the first years. When a builder pays it, it is a sales cost the builder absorbs instead of cutting the price. In our hypothetical, one percentage point off a $400,000 loan at 6.56 percent lowers principal and interest by $257.84 a month.10 Both D.R. Horton and Lennar describe financing incentives in their annual reports.1112
Where can I find the fees a new house pays in my city?
Most cities post a fee schedule or master fee resolution on the building or planning department page; Twin Falls posts its master fee schedule with the building fees highlighted, and Coeur d'Alene posts a sample estimate.639 Where nothing is posted, the city clerk can provide the current fee resolution and the annual impact fee report under the public records law (Idaho Public Records Requests).
Does the state set building permit fees?
Cities and counties that run their own building departments set their own fees by ordinance or resolution; Twin Falls, for example, uses the ICC's valuation data and a city table.326 In places where a city or county does not run its own program, permits come from the state Division of Occupational and Professional Licenses; lesson 1 (Who Touches a New House) maps who issues which permit and lesson 3 covers the fees at the counter.
Hard questions
Should new homes pay the full cost of the public facilities growth needs?
For higher fees: existing residents already paid for today's roads, parks and plants, and the Development Impact Fee Act limits fees to a "proportionate share" of new system improvements, so a fee charges new homes only for what they add.34 Against: fees are paid up front by the first buyer, while the facilities serve everyone for decades; spreading the cost through taxes or rates would lower the entry price of a home. What the evidence shows: fees are a few percent of a new home's price in Idaho cities (our hypothetical) and nationally (NAHB), and one study found certain fees can increase construction; no Idaho study measures who ends up bearing them.141
Is regulation the main reason new homes cost so much?
Yes, say builders: NAHB's surveys put regulation at about a quarter of the price, with code changes the largest single item.14 No, say others: the estimate is an industry survey without independent checks, it counts costs but not benefits such as safety and energy savings, and land, rates and demand moved prices far more from 2020 to 2026. What the evidence shows: Idaho can verify the fee portion from schedules; the code and delay portions have no Idaho measurement. Mortgage rates alone added $866 a month to the same $400,000 loan between 2021 and 2026 (our calculation).10
Should Idaho collect its own data on what new homes cost?
For: every housing debate in the Legislature and city halls leans on national industry numbers, and Idaho's sales prices are not public.28 Against: requiring sale price disclosure would change long-standing Idaho practice, and a state survey of builders would cost money and could duplicate data that private firms already sell. What the evidence shows: the public data that exist (permits, wages, fee schedules) can answer part of the question; the land and profit shares would need new data.
Are builder incentives good for buyers?
For: a buydown lowers a monthly payment that rate increases had pushed out of reach, and builders say incentives keep sales and construction going. Against: buydowns hide the real price, can make a home harder to resell at the same price, and a temporary buydown ends. What the evidence shows: incentives were large (13.8 percent of Lennar's home sales revenue in fiscal 2025) and came out of builders' margins.1244 How Idaho buyers fared after temporary buydowns ended is not measured in any public data we found.
For reporters and advocates
Public records that exist. City and county fee schedules and fee resolutions; each city's annual impact fee report and capital improvements plan under the Development Impact Fee Act; building permit records showing declared valuation and fees paid; utility connection fee schedules and the rate studies behind them; highway district impact fee ordinances (ACHD's Ordinance 254 and its capital improvements plan); the Census Building Permits Survey place files for any Idaho city; county assessor land values; and council minutes for every fee vote (see Idaho Open Meetings). Records requests go under Idaho Code Title 74 (see Idaho Public Records Requests).
Questions to ask. What does a 2,000 square foot house pay in all public fees here, line by line, and when did each fee last change? How much impact fee money did the city collect last year, and on which projects was it spent? What valuation does the building department assign a typical house, and from which table? Which builders in town are public companies, and what do their filings say about incentives? What share of new homes sold this year came with a rate buydown (builders and lenders may say; no public record shows it)?
Use the numbers carefully. Label NAHB figures as industry surveys with their sample sizes. Say "our calculation" for any fee stack and list what it includes. Use Census West figures for Idaho only as a regional comparison. Never infer a named builder's Idaho margins from a national 10-K.
The Magic Valley angle. Twin Falls posts its fees, and the whole public fee bill for a hypothetical house there was under $9,000 in 2026; Part B found that Kimberly has an impact fee ordinance; and we could not find published fee schedules for Jerome, Gooding, Buhl or Hagerman. Wages in the Twin Falls metro area run below the Boise area's for every construction trade in the table above except building inspectors.630 A records request to each small city for its fee resolution and any impact fee report would fill the gap. Lesson 12 (How to Report on Building Quality and Permitting) has the full reporting workflow, and How to Report on Housing covers housing stories more broadly.
Where to go next
- Census Bureau: Characteristics of New Housing: Free annual tables on new homes' size, lot, price and features for the U.S. and four regions; download the Excel tables and look for the West region columns, since there is no Idaho breakdown.
- Census Bureau: Building Permits Survey: Free monthly and annual counts of new housing units and permit valuation for every Idaho county and permit-issuing city; useful for tracking local building and average permit values.
- BLS: Occupational Employment and Wage Statistics: Free wage and employment estimates by occupation for Idaho and its metro areas each May; use the one-screen data search to pick an occupation and area.
- Freddie Mac: Primary Mortgage Market Survey: Free weekly mortgage rate averages since 1971 with a downloadable history file; national, not Idaho-specific.
- SEC EDGAR company filings search: Free access to public homebuilders' 10-K and 10-Q reports; search a company name and open the annual report to find gross margin, incentives and market lists.
- Idaho Development Impact Fee Act, Idaho Code Title 67 Chapter 82: The free official text of the law that governs city, county and district impact fees in Idaho, for readers checking a local fee against the statute.
- NAHB Eye on Housing economics blog: The home building industry group's free economics blog, with posts on construction costs, lot prices and regulation; useful for industry data, which should be labeled as industry research.
Still being checked (9 items)
These points could not be fully confirmed against a primary source when this lesson was written and fact checked in November 2026. The text above states each one as uncertain.
- Meridian's building permit and plan review fees for a new house: the city's fee pages were behind a browser check we could not pass, so the Meridian fee total leaves them out.
- Boise's water and sewer connection charges and building permit fee for a new house were not confirmed for this lesson.
- Current residential fee schedules (building permit, impact and connection fees) for Jerome, Nampa, Caldwell, Gooding, Buhl and Hagerman could not be confirmed from a primary record.
- Twin Falls water and sewer connection fee schedules we used ran through Sept. 30, 2026; we did not find the schedule for fiscal 2026-27 and did not confirm whether the amounts changed Oct. 1, 2026.
- The Coeur d'Alene fee estimate page shows no date or square footage; we report it as the city published it.
- Whether Meridian's June 1, 2026 water and sewer assessment amounts apply to every single-family home: the notice does not say single-family.
- We read Burge and Ihlanfeldt (2006) only in its abstract and conclusion as posted by the author, not the full journal version.
- No public Idaho data on residential lot prices, construction loan rates, subcontractor prices, the share of Idaho new-home sales with rate buydowns, or private builders' margins were found.
- NAHB said in January 2025 that a 2026 update of its cost survey was in progress; we did not find a newer edition as of Nov. 21, 2026.
Last verified November 21, 2026. General education, not legal, tax, financial or real estate advice; every figure names its source and year in the Notes and Sources below. Data is revised: check the newest release before relying on any number.
Notes
- Eric Lynch, NAHB Economics and Housing Policy, Cost of Constructing a Home 2024, Jan. 20, 2025: methodology (questionnaire to 4,000 builders, 41 usable responses, fall 2024 survey), caveats, and Table 1, Single-Family Price and Cost Breakdowns, 2024 National Results. Industry survey (read Nov. 21, 2026). Read it online. ↩
- NAHB, Cost of Constructing a Home 2024, Table 2, Single-Family Homes Sales Price Breakdown History, 1998 to 2024, and text (long-run average pre-tax profit share 9.8 percent since 1998). Industry survey (read Nov. 21, 2026). Read it online. ↩
- City of Meridian, Ordinance No. 22-2004, amending Meridian City Code 10-7-12(E)(2), "Impact Fee Schedule Effective February 1, 2023" (residential fees by climate-controlled floor area; 1,701 to 2,500 sq. ft.: parks $4,119, police $402, fire $995, total $5,516) (read Nov. 21, 2026). Read it online. ↩
- Ada County Highway District, "ACHD NEWS: Impact Fee, CIP Update Approved," Dec. 5, 2025: Ordinance No. 254 approved 4-1, $5,803 per single-family home and $2,371 per multifamily unit, expected effective March 1, 2026 (read Nov. 21, 2026). Read it online. ↩
- City of Meridian, "Water and Sewer Assessments," effective June 1, 2026: sewer assessments $5,807 (previously $5,411), water assessments $1,696 (previously $1,514) (read Nov. 21, 2026). Read it online. ↩
- City of Twin Falls, Master City-Wide Fee Schedule, Exhibit B, "Current Master Fee Schedule with Building Permit Fees Highlighted" (building permit fee table; residential plan review 30 percent of the building permit fee; mechanical, electrical and plumbing residential permits $120 for 0 to 2,500 sq. ft.; re-inspection $50; Building footnote 1 on declared value), as posted in November 2026 (read Nov. 21, 2026). Read it online. ↩
- City of Twin Falls Planning and Zoning Department, "Impact Fees (Jan 2026)," per City Council decision of Dec. 8, 2025, effective Jan. 1, 2026 (single-family: police $276, fire $1,105, parks $1,918, streets $1,683, total $4,982) (read Nov. 21, 2026). Read it online. ↩
- U.S. Bureau of Labor Statistics, Occupational Employment and Wage Statistics, May 2025 estimates for Idaho (series OEUS1600000000000 plus occupation and data type codes, for example OEUS160000000000047000008, median hourly wage, construction and extraction occupations), retrieved through the BLS public data API Nov. 20, 2026; OEWS state data index page linked (read Nov. 21, 2026). Read it online. ↩
- U.S. Bureau of Labor Statistics, OEWS, May 2025 national estimates (series OEUN0000000000000 plus occupation and data type codes), retrieved through the BLS public data API Nov. 20, 2026 (read Nov. 21, 2026). Read it online. ↩
- Freddie Mac, Primary Mortgage Market Survey, weekly history file (PMMS_history.csv), 30-year fixed-rate series, April 2, 1971 to Nov. 19, 2026, downloaded Nov. 20, 2026. Yearly averages, lows, highs and payment examples are our calculation (read Nov. 21, 2026). Read it online. ↩
- D.R. Horton, Inc., Form 10-K for the fiscal year ended Sept. 30, 2026, filed Nov. 18, 2026, Management's Discussion and Analysis (home sales gross margin 20.2 percent vs. 21.5 percent; homebuilding SG&A 8.9 percent vs. 8.3 percent; homebuilding pre-tax income 11.2 percent vs. 13.1 percent of homebuilding revenues; incentives including mortgage rate buydowns) (read Nov. 21, 2026). Read it online. ↩
- Lennar Corporation, Form 10-K for fiscal 2025, notes to financial statements, revenue recognition (sales incentives averaged $62,700 per home, 13.8 percent of home sales revenues, in fiscal 2025; $48,800 and 10.3 percent in 2024; $42,900 and 8.8 percent in 2023) (read Nov. 21, 2026). Read it online. ↩
- Paul Emrath, NAHB, Government Regulation in the Price of a New Home: 2021, special study, May 5, 2021: summary and Figure 1 (23.8 percent; $93,870 on an average new-home price of $394,300; $41,330 development and $52,540 construction; $65,224 in the 2011 study and $84,671 in 2016; 24.3 percent in 2016). Industry survey (read Nov. 21, 2026). Read it online. ↩
- NAHB, Government Regulation in the Price of a New Home: 2021, Methodology section and Table 1, Average Regulatory Costs (land developer survey sent to 2,071 members, 57 usable responses; special questions on the March 2021 NAHB/Wells Fargo Housing Market Index, 280 builder responses; average delay roughly 6 months) (read Nov. 21, 2026). Read it online. ↩
- Eric Lynch, "Cost of Constructing a Home in 2024," Eye on Housing (NAHB economics blog), Jan. 23, 2025, including the author's replies to readers on sample size and regional results (read Nov. 21, 2026). Read it online. ↩
- NAHB, Cost of Constructing a Home 2024, sections "Home and Lot Size" and "Sales Price" (average 2,647 sq. ft. finished area, 20,907 sq. ft. lot; comparison with Census averages; lot availability "a major headwind") (read Nov. 21, 2026). Read it online. ↩
- NAHB, Cost of Constructing a Home 2024, Table 3, Single-Family Homes Construction Cost Breakdown History, 1998 to 2024, and text on construction cost per square foot ($80 in 2011 to $162 in 2024) and its causes. Industry survey (read Nov. 21, 2026). Read it online. ↩
- U.S. Census Bureau, Survey of Construction, Characteristics of New Housing, annual data for 2025 released July 1, 2026, "Highlights of Annual 2025 Characteristics of New Housing" (1,005,000 single-family homes completed, median 2,142 sq. ft.; 678,000 sold, median price $417,400, average $523,800) (read Nov. 21, 2026). Read it online. ↩
- U.S. Census Bureau, Survey of Construction, Characteristics of New Housing, annual data for 2025 released July 1, 2026, Sale Price table (soldprice_cust.xls), sheet "Median and Average Sales Price of New Single-Family Houses Sold," United States and regions, 1999 to 2025 (read Nov. 21, 2026). Read it online. ↩
- U.S. Census Bureau, Survey of Construction, Characteristics of New Housing, annual data for 2025 released July 1, 2026, Square Feet table (squarefeet_cust.xls), sheet "Median and Average Square Feet of Floor Area in New Single-Family Houses Completed," United States and regions (read Nov. 21, 2026). Read it online. ↩
- U.S. Census Bureau, Survey of Construction, Characteristics of New Housing, annual data for 2025 released July 1, 2026, Sale Price Per Square Foot table (soldpricesqft_cust.xls), median and average price per square foot of floor area, new single-family houses sold, United States and regions (read Nov. 21, 2026). Read it online. ↩
- U.S. Census Bureau, Survey of Construction, Characteristics of New Housing, annual data for 2025 released July 1, 2026, Lot Size table (soldlotsize_cust.xls), sheet "Median and Average Lot Size of New Single-Family Houses Sold," excluding condominiums, United States and regions, 2009 to 2025 (read Nov. 21, 2026). Read it online. ↩
- U.S. Census Bureau, Survey of Construction, Characteristics of New Housing, annual data for 2025 released July 1, 2026, Lot Size table (soldlotsize_cust.xls), sheet "Lot Size of New Single-Family Houses Sold" (percent under 7,000 sq. ft.: West 55 percent in 2009, 65 percent in 2025) (read Nov. 21, 2026). Read it online. ↩
- U.S. Census Bureau, Survey of Construction, Characteristics of New Housing, annual data for 2025 released July 1, 2026, Sale Price table (soldprice_cust.xls), sheet "Number of New Single-Family Houses Sold by Sales Price," United States and West, 2020 to 2025 (thousands of houses and percent distribution) (read Nov. 21, 2026). Read it online. ↩
- U.S. Census Bureau, Building Permits Survey, "Definitions" (valuation: "the estimated value of the residential structure as shown on the building permit") (read Nov. 21, 2026). Read it online. ↩
- U.S. Census Bureau, Building Permits Survey, annual state file for 2025 (st2025a.txt): Idaho 1-unit buildings 14,112 units, valuation $4,242,918 thousand; United States 911,903 units, $292,551,243 thousand. Averages per unit are our calculation (read Nov. 21, 2026). Read it online. ↩
- U.S. Census Bureau, Building Permits Survey, annual state files for 2015 (Idaho 7,784 units, $1,754,497 thousand; U.S. 695,998 units, $166,276,881 thousand) and 2020 (Idaho 14,969 units, $3,471,574 thousand; U.S. 979,360 units, $243,423,623 thousand) (read Nov. 21, 2026). Read it online. ↩
- Idaho Capital Sun, "As tax gap widens, Idaho 1 of 10 states with no obligation to disclose property's sale price," Aug. 31, 2021 (news report quoting Ada County Assessor Bob McQuade and chief deputy assessor Brad Smith) (read Nov. 21, 2026). Read it online. ↩
- U.S. Bureau of Labor Statistics, OEWS, May 2025 estimates for the Boise City, Idaho metropolitan statistical area (area 14260; series OEUM001426000000 plus codes), retrieved through the BLS public data API Nov. 20, 2026 (read Nov. 21, 2026). Read it online. ↩
- U.S. Bureau of Labor Statistics, OEWS, May 2025 estimates for the Twin Falls, Idaho metropolitan statistical area (area 46300; series OEUM004630000000 plus codes; construction and building inspectors employment estimate 30), retrieved through the BLS public data API Nov. 20, 2026 (read Nov. 21, 2026). Read it online. ↩
- Idaho Code section 67-8203, Definitions, subsections (9) (development impact fee and its exclusions) and (24) (public facilities); history: added 1992, ch. 282; amended through 2026, ch. 203 (read Nov. 21, 2026). Read it online. ↩
- City of Twin Falls Building Safety Department, "Plan Review and Permit Fee Policy" (effective Jan. 1, 2025, use of the International Code Council's Building Valuation Data published each August) (read Nov. 21, 2026). Read it online. ↩
- International Code Council, Building Safety Journal, "Building Valuation Data" (explains that the Code Council developed the data "to aid jurisdictions in determining permit fees" and that it is not an estimating guide) (read Nov. 21, 2026). Read it online. ↩
- Idaho Code section 67-8204, Development impact fee ordinance requirements, subsections (1) (proportionate share), (3) (time of collection) and (10) (affordable housing exemption funded from other revenue); history: added 1992, amended 1996 and 2002 (read Nov. 21, 2026). Read it online. ↩
- Idaho Code section 63-1311(1), fees for services of taxing districts "reasonably related to, but shall not exceed, the actual cost of the service being rendered"; history: added 1996, amended 1997 (read Nov. 21, 2026). Read it online. ↩
- City of Boise, "Boise City Impact Fee Schedule effective October 1, 2026" (Central Bench planning area, 1,401 to 2,100 sq. ft.: regional parks $1,721.11, local parks $2,220.56, fire $2,056.52, police $535.87, total $6,534.06; 1 percent surcharge for capital improvement plan preparation) (read Nov. 21, 2026). Read it online. ↩
- City of Twin Falls, "2025-26 Sewer Connection Fees," effective Oct. 1, 2025 through Sept. 30, 2026 (single family residence capacity fee $512.54; 4-inch residential tap fee $105.00) (read Nov. 21, 2026). Read it online. ↩
- City of Twin Falls, "2025-26 Water Connection Fees," effective Oct. 1, 2025 through Sept. 30, 2026 (1-inch meter fee $449.28 assessed at building permit; city installation of service line and meter $3,088.47) (read Nov. 21, 2026). Read it online. ↩
- City of Coeur d'Alene Building Department, "Estimated Residential Construction Fees" (example for a single-family dwelling with an average project value of $200,000, estimated total $10,500.95; no date shown on the page) (read Nov. 21, 2026). Read it online. ↩
- Caldwell City Code, Title 10, Chapter 9, Article on development impact fees, sections 10-09-04 to 10-09-11 (police, fire, and parks and recreation; Ord. 2671, April 3, 2007; Ord. 3374, Dec. 6, 2021), American Legal Publishing (read Nov. 21, 2026). Read it online. ↩
- Gregory Burge and Keith Ihlanfeldt, "Impact fees and single-family home construction," Journal of Urban Economics 60(2):284-306 (2006); abstract and conclusion as posted by the author (panel of 41 Florida counties, 1993 to 2003) (read Nov. 21, 2026). Read it online. ↩
- Freddie Mac, "Mortgage Rates," Primary Mortgage Market Survey page (read Nov. 21, 2026). Read it online. ↩
- D.R. Horton, Inc., Form 10-K for fiscal 2026, Item 1, Business (84,202 homes closed at an average closing price of $363,600; Northwest reporting region includes Idaho) (read Nov. 21, 2026). Read it online. ↩
- Lennar Corporation, Form 10-K for the fiscal year ended Nov. 30, 2025, filed Jan. 28, 2026, Item 1 and Management's Discussion and Analysis (gross margins on home sales 17.7 percent vs. 22.3 percent; 82,583 deliveries; average sales price $391,000; Homebuilding West segment results naming Idaho; "gross margin as a shock absorber") (read Nov. 21, 2026). Read it online. ↩
Check yourself
1. In NAHB's 2024 Cost of Constructing a Home survey, what share of the average new-home sales price was construction cost?
NAHB's Table 1 for 2024 shows construction cost of $428,215, 64.4 percent of the $665,298 average price; 13.7 percent was the finished lot and 11.0 percent profit.
2. How many usable builder responses did NAHB's 2024 construction cost survey have?
NAHB e-mailed 4,000 builders and, after an outlier analysis, had usable responses from 41, which is why NAHB says the sample is too small for regional results.
3. Under Idaho Code 67-8203(9), which of these is NOT an impact fee?
The Development Impact Fee Act's definition excludes connection or hookup charges, availability charges for services provided directly to the development, and plan review and inspection fees.
4. What was the Ada County Highway District's road impact fee for a single-family home under Ordinance 254, effective March 1, 2026?
ACHD's Dec. 5, 2025 bulletin reports Ordinance 254 at $5,803 per single-family home and $2,371 per multifamily unit; $4,982 is Twin Falls' total city impact fee.
5. In our hypothetical 2,000 square foot house, which Twin Falls fee is set at 30 percent of the building permit fee?
The Twin Falls master fee schedule sets the residential plan review fee at 30 percent of the building permit fee ($570 on a $1,900 permit in our example).
6. What was the median hourly wage for construction and extraction occupations in Idaho in May 2025, according to BLS OEWS?
OEWS May 2025: Idaho $27.00, United States $28.63, Twin Falls metro $23.38; $30.29 was the Idaho median for electricians.
7. Freddie Mac's 30-year fixed rate averaged 2.96 percent in 2021 and 6.56 percent in 2026 through Nov. 19. On a hypothetical $400,000, 30-year loan, about how much more is the monthly principal and interest at the 2026 rate?
Our calculation from the PMMS averages: $2,544.08 at 6.56 percent minus $1,677.80 at 2.96 percent equals $866.28 a month.
8. What did Lennar's Form 10-K for fiscal 2025 report about sales incentives?
Lennar's 10-K says incentives, mainly price discounts and financing incentives, averaged $62,700 per home, 13.8 percent of home sales revenue, in fiscal 2025, up from $48,800 (10.3 percent) in 2024.
9. NAHB's 2021 study estimated regulation at 23.8 percent of a new home's price. Which item was the largest single category?
In NAHB's Table 1, builders' estimate of code changes over the previous 10 years was 6.1 percent of the house price, the largest item; builder fees were 3.1 percent.
10. What does the Census Building Permits Survey 'valuation' measure?
The Census defines valuation as the estimated value of the residential structure shown on the permit, or the permit official's estimate if none is listed; it excludes the lot.
Terms in this lesson
- Finished lot
- A lot ready to build on: land plus zoning and plat approvals, streets, utilities and development fees. NAHB's finished lot cost also includes financing on the lot.
- Construction cost (NAHB)
- Everything a builder pays to build the house itself, including labor, subcontractors, materials, permits and fees, and design, grouped by NAHB into eight stages.
- Impact fee
- Under Idaho Code 67-8203, a one-time payment imposed as a condition of development approval for a proportionate share of system improvements such as roads, parks, public safety, water and sewer facilities.
- Connection or capacity fee
- A one-time charge to hook a new building to a city water or sewer system or buy into its capacity; excluded from the Idaho definition of an impact fee and governed by other laws.
- Plan review fee
- A fee for checking construction plans before a permit is issued; Twin Falls sets it at 30 percent of the building permit fee for homes.
- Permit valuation
- The estimated value of a structure written on a building permit, often taken from the International Code Council's Building Valuation Data; used to set permit fees and reported to the Census.
- Survey of Construction (SOC)
- The Census Bureau's survey of new homes that publishes their size, lot, price and features each year for the nation and four regions.
- Building Permits Survey (BPS)
- The Census Bureau's monthly and annual count of new housing units authorized by permit offices, with their permit valuation, by state, county and place.
- OEWS
- The Bureau of Labor Statistics' Occupational Employment and Wage Statistics survey, which estimates employment and wages by occupation for states and metropolitan areas each May.
- Primary Mortgage Market Survey (PMMS)
- Freddie Mac's weekly survey of average mortgage rates, including the 30-year fixed rate, published since 1971.
- Rate buydown
- A payment, often made by the seller or builder at closing, that lowers a buyer's mortgage interest rate permanently or for the first years of the loan.
- Gross margin
- Revenue minus the direct cost of the homes sold, divided by revenue; it comes before overhead, selling and administrative costs, so it is larger than profit.
- Form 10-K
- The annual report a publicly traded company files with the Securities and Exchange Commission, with audited financial statements and management's discussion of results.
- The limit in Idaho Code 67-8204(1): an impact fee may not exceed the share of system improvement costs attributable to the new development.
Sources
- NAHB, Cost of Constructing a Home 2024 (industry survey) (2026-11-21) checked 2026-11
- NAHB, Government Regulation in the Price of a New Home: 2021 (industry survey) (2026-11-21) checked 2026-11
- U.S. Census Bureau, Characteristics of New Housing 2025 (Survey of Construction) (2026-11-21) checked 2026-11
- U.S. Census Bureau, Building Permits Survey, annual state file 2025 (2026-11-21) checked 2026-11
- U.S. Bureau of Labor Statistics, Occupational Employment and Wage Statistics, May 2025, Idaho (2026-11-21) checked 2026-11
- Freddie Mac, Primary Mortgage Market Survey weekly history (2026-11-21) checked 2026-11
- Idaho Code 67-8203, Development Impact Fee Act definitions (2026-11-21) checked 2026-11
- Idaho Code 67-8204, Development impact fee ordinance requirements (2026-11-21) checked 2026-11
- Ada County Highway District, Ordinance 254 impact fee update bulletin (2026-11-21) checked 2026-11
- City of Twin Falls, Master Fee Schedule with building permit fees (2026-11-21) checked 2026-11
- City of Boise, Impact Fee Schedule effective Oct. 1, 2026 (2026-11-21) checked 2026-11
- City of Meridian, Ordinance 22-2004 impact fee schedule (2026-11-21) checked 2026-11
- D.R. Horton, Inc., Form 10-K for fiscal 2026 (2026-11-21) checked 2026-11
- Lennar Corporation, Form 10-K for fiscal 2025 (2026-11-21) checked 2026-11