Lesson 5 of 13 · about 55 minutes · Updated November 17, 2026
Farmland to Rooftops
You'll be able to
- Read Census of Agriculture tables correctly, including the farm definition, land in farms, cropland, irrigated land, principal-county assignment and the 1997 coverage adjustment.
- Compare Idaho's farmland and irrigated land with the United States from 1978 to 2022, and adjust land values for inflation with the CPI-U.
- Describe county-level farmland change in Ada, Canyon, Kootenai and the Magic Valley counties, and explain why some county numbers swing between censuses.
- Use NRI and NLCD estimates of developed land, including margins of error and the difference between land cover and land use.
- Explain how Idaho statutes handle irrigation water and water rights when farmland is subdivided or annexed.
- Identify the public records that show farmland conversion since 2022, before the 2027 Census of Agriculture is released.
Start here: the short version
- Idaho has less land in farms than it did in 1978. The USDA Census of Agriculture counted 14,699,100 acres in farms in 1978 and 11,547,963 acres in 2022, a drop of 21.4 percent. Land in farms nationwide fell 13.3 percent over the same years.1234
- Irrigated land held up better, until recently. Idaho counted 3,475,392 irrigated acres in 1978 and 3,167,499 in 2022 (down 8.9 percent), while irrigated land in the U.S. grew 9.1 percent. Between the 2017 and 2022 censuses Idaho's irrigated land fell by 230,767 acres, or 6.8 percent.12
- Ada County lost more than half its farmland. Land in farms in Ada County went from 247,232 acres in 1982 to 112,556 in 2022 (down 54.5 percent), and its cropland from 108,519 acres to 42,862.56
- Developed land in Idaho grew 76.0 percent from 1982 to 2022. The USDA's National Resources Inventory estimates 562.9 thousand acres of developed non-federal land in 1982 and 990.5 thousand in 2022. The U.S. grew 65.5 percent.7
- The satellite record shows where. In our own analysis of the National Land Cover Database, Ada County added about 18,300 acres of developed land from 2001 to 2021 and Canyon County about 10,900, while Jerome County added about 1,200 and Twin Falls County about 3,700.8
- An advocacy group's study puts Idaho's 2001 to 2016 loss at about 69,000 acres. American Farmland Trust reported 68,823 acres of Idaho agricultural land lost to development, 26 percent of it among the nation's best farmland, with hotspots on the Rathdrum Prairie and in the Treasure and Magic Valleys.910
- Nobody publishes farmland converted since 2020, city by city. The next Census of Agriculture covers 2027, and based on the last cycle its results are not expected before about 2029.11
Data: USDA National Agricultural Statistics Service (NASS), 2022 Census of Agriculture (released February 2024), Idaho and U.S. volumes, plus the archived 1982, 1992, 2002 and 2012 Idaho and U.S. reports; USDA Natural Resources Conservation Service (NRCS), 2022 National Resources Inventory Summary Report (February 2026); USGS and the Multi-Resolution Land Characteristics Consortium (MRLC), National Land Cover Database 2001, 2011 and 2021 (our own analysis); Census Bureau Vintage 2025 county population estimates and 2000 to 2010 intercensal estimates; BLS CPI-U, U.S. city average, annual average 2025 = 321.943; Idaho Code as of Nov. 17, 2026. Checked Nov. 17, 2026. Agencies revise data; newer releases may differ.
Stand on the Ten Mile Road overpass in south Meridian, or on the edge of Jerome where Highway 93 meets the subdivisions north of town, and the question this lesson answers is in front of you: how much of Idaho's farm ground has turned into houses, roads, warehouses and parking lots, where, and how fast? People argue about it at every planning and zoning hearing in the Treasure Valley and, more and more, in the Magic Valley. Too often both sides argue from a single number pulled from a headline.
The honest answer is that four different public datasets each measure a piece of the change, and none of them measures all of it. The USDA Census of Agriculture counts farms and the land they operate every five years. The USDA National Resources Inventory (NRI) estimates how all non-federal land is used, including how much is developed. The National Land Cover Database (NLCD) classifies satellite images into land cover types, pixel by pixel. And water right and planning records show what happens to the irrigation that made southern Idaho's desert into farmland in the first place. This lesson walks through each one for Idaho, for the United States, and for the Treasure Valley (Ada and Canyon counties), the Magic Valley (Jerome, Twin Falls, Gooding, Lincoln, Minidoka and Cassia counties) and Kootenai County, then shows what they agree on, where they disagree, and why.
It builds on two related courses and does not repeat them: Water, Land and Agriculture explains Idaho water law and farm economics, and Water Rights and Ag Land for Residents covers wells, irrigation shares and living next to farms. Inside this module, How to Measure Growth Without Fooling Yourself explains estimates, base effects and the inflation adjustment used here; The Magic Valley Case Study follows Jerome, Twin Falls, Kimberly, Gooding, Buhl and Hagerman town by town; and Water, Schools and Roads covers the aquifer, curtailment orders and the other limits on growth.

What the Census of Agriculture counts, and what it does not
The Census of Agriculture is the only complete count of American farms. NASS mails it to every known farm operation for the census year, which ends in 2 or 7: the years in this lesson are 1978, 1982, 1987, 1992, 1997, 2002, 2007, 2012, 2017 and 2022. Before reading a single number from it, a reader needs five definitions.
A "farm" is any place that sells $1,000 of farm products
NASS defines a farm as "any place from which $1,000 or more of agricultural products were produced and sold, or normally would have been sold, during the census year." That definition has been used since the 1974 census, so the farm counts from 1978 on use the same yardstick.12 The $1,000 threshold has never been raised for inflation. In 1978 dollars it was a meaningful business; in 2025 dollars it is a few steers, an acre of hay or a backyard flock with egg sales. That is why Idaho had 5,785 farms of 1 to 9 acres in 2022, more than any other size class except 10 to 49 acres (6,977 farms).1 Some of those small places are rural home lots with a few animals or a hay field. A subdivision of five-acre lots can raise the farm count while the land actually farmed shrinks, which is why farm counts alone say little about farmland loss.
"Land in farms" includes rangeland, pasture and woodland
Land in farms is all the land an operation owns or rents and uses: cropland, pasture, rangeland, woodland, and the land under farmhouses, barns and lanes. In Idaho a large share is private rangeland. In 2022 Idaho had 11,547,963 acres in farms but only 5,623,516 acres of total cropland, and 3,167,499 acres of irrigated land.1 NASS counts all grazing land that is part of a farm or ranch, "except land used under government permits on a per-head basis," so federal grazing permits of that kind are left out.13 A change in land in farms can therefore reflect a ranch selling or leasing its private range, a rangeland lease moving to an operator based in another county, or a field becoming a subdivision. It is not a direct measure of land converted to houses.
Total cropland, in the NASS glossary, is cropland harvested, cropland used only for pasture or grazing, cropland on which crops failed or were abandoned, cropland in summer fallow, and idle cropland.13 Harvested cropland is the part actually harvested that year. Irrigated land is "all land watered by any artificial or controlled means," including pasture, with each acre counted once. For the question "how much good farmland is being built on," irrigated land and cropland are better measures than land in farms, and the module plan for this course says so directly: land in farms includes rangeland, so use irrigated cropland for conversion.
Each farm is counted in one "principal" county
County tables carry a trap most readers never see. NASS assigns each report "to a single 'principal' county," defined as "the county in which the majority of an operation's agricultural products are produced, as reported by the producer." Large operations with significant production in several counties may be split, but most are not.13 A dairy headquartered in Gooding County that farms ground in Jerome County may show all its acres in Gooding. If that dairy grows, merges or moves its headquarters, acres jump from one county to another with no shovel turned. This is the main reason Magic Valley county numbers bounce from census to census, and why Minidoka County's land in farms can rise 47 percent from 1982 to 2022 while its number of farms falls by half (see the county tables below).
From 1997 on, the counts are adjusted for farms the census missed
Every census misses some farms. Starting with 1997, NASS publishes figures adjusted for undercoverage, nonresponse and misclassification, using a separate area-based survey to estimate what the mail list missed. Earlier years were published unadjusted. The 2022 Idaho historical table prints 1997 both ways: adjusted, 25,590 farms and 12,057,001 acres in farms; not adjusted, 22,314 farms and 11,830,167 acres.113 Comparing 1978 (unadjusted) with 2022 (adjusted) is common and reasonable for a long view, but the break is real. This lesson shows long-run comparisons and also the 1997 to 2022 change, which is on one consistent basis.
Dollars are not adjusted for inflation, and small counties hide numbers
NASS says plainly that "Dollar figures are expressed in current dollars and have not been adjusted for inflation or deflation."12 Any real-dollar figure in this lesson is our own calculation with the module's one deflator, the BLS Consumer Price Index for All Urban Consumers (CPI-U). County tables also print (D) where a number is withheld to avoid disclosing a single operation. For example, Payette County's 2022 land in irrigated farms is shown as (D).14 A (D) is not a zero and should not be treated as one.
| Term | What it includes | Good for | Not good for |
|---|---|---|---|
| Farms (number) | Every place selling or able to sell $1,000 of farm products | Counting operations, small-farm trends | Measuring farmland; rural lots inflate it |
| Land in farms | Cropland, pasture, private rangeland, woodland, farmsteads | Long-run scale of agriculture | Measuring conversion; leases and principal-county shifts move it |
| Total cropland | Harvested, idle, fallow and pastured cropland, conservation acres | The land that can grow crops | Year-to-year swings in idle land |
| Irrigated land | All land irrigated in the census year | Southern Idaho's most valuable farm ground | Drought years, when less is watered |
| Value of land and buildings per acre | Producer's estimate of market value, Dec. 31 | Development pressure on farm prices | Comparing years without adjusting for inflation |
Idaho and the United States, 1978 to 2022
The statewide record runs through ten censuses. The table puts the main Idaho series side by side. The 1978 to 1992 figures come from the historical table in the 1992 Idaho report, published without the coverage adjustment; 1997 to 2022 come from the 2022 Idaho report, adjusted.12
| Census year | Farms | Land in farms (acres) | Average size (acres) | Total cropland (acres) | Harvested cropland (acres) | Irrigated land (acres) |
|---|---|---|---|---|---|---|
| 1978 | 24,249 | 14,699,100 | 606 | 6,540,493 | 4,820,928 | 3,475,392 |
| 1982 | 24,714 | 13,921,639 | 563 | 6,484,076 | 4,887,805 | 3,450,443 |
| 1987 | 24,142 | 13,931,875 | 577 | 6,742,285 | 4,349,122 | 3,219,192 |
| 1992 | 22,124 | 13,468,992 | 609 | 6,301,862 | 4,225,273 | 3,260,006 |
| 1997 (adjusted) | 25,590 | 12,057,001 | 471 | 6,435,446 | 4,581,227 | 3,543,805 |
| 2002 | 25,017 | 11,767,294 | 470 | 6,152,611 | 4,313,288 | 3,288,522 |
| 2007 | 25,349 | 11,497,383 | 454 | 5,918,899 | 4,225,786 | 3,299,889 |
| 2012 | 24,816 | 11,760,109 | 474 | 5,793,347 | 4,504,676 | 3,365,292 |
| 2017 | 24,996 | 11,691,912 | 468 | 5,894,676 | 4,576,077 | 3,398,266 |
| 2022 | 22,877 | 11,547,963 | 505 | 5,623,516 | 4,370,363 | 3,167,499 |
| Change 1978 to 2022 | -5.7% | -21.4% | -16.7% | -14.0% | -9.3% | -8.9% |
| Change 1997 to 2022 (one basis) | -10.6% | -4.2% | +7.2% | -12.6% | -4.6% | -10.6% |
Three things stand out. First, most of the long drop in Idaho's land in farms happened before 1997: 1.23 million acres fell out between 1978 and 1992, and the series shows a further drop of 1.4 million acres between 1992 and 1997 using the adjusted 1997 figure (12,057,001), or 1.6 million using the unadjusted one (11,830,167).12 The published tables do not explain that 1992 to 1997 step. Part of it may be ranches dropping private range or leases, and part may be changes in how the census was run (NASS took the census over from the Census Bureau for 1997), but we could not confirm a cause, and it is listed as unverified at the end of this lesson. It is not plausible that 1.4 million acres of Idaho farmland were paved in five years: the NRI estimates that all developed non-federal land in Idaho grew by 91.8 thousand acres between 1992 and 1997.7
Second, since 1997 land in farms has been nearly flat (down 4.2 percent), but cropland and irrigated land have both fallen faster (down 12.6 and 10.6 percent). The good ground is shrinking faster than the total.
Third, the 2017 to 2022 change is the sharpest of the irrigated series in the adjusted era: irrigated land fell 230,767 acres (6.8 percent) and total cropland 271,160 acres, while land in farms fell 143,949 acres.1 The census counts land actually irrigated in the census year, so a short water year, a curtailment order or a field left dry lowers the count even when the land and its water right are still there (see lesson 10 on the 2024 to 2026 curtailment orders). Some of the drop may be water not used rather than land lost; the census does not say which. The 2027 census will show how much came back.
The U.S. comparison
| Census year | U.S. farms | U.S. land in farms (acres) | U.S. total cropland (acres) | U.S. irrigated land (acres) | Idaho share of U.S. irrigated land |
|---|---|---|---|---|---|
| 1978 | 2,257,775 | 1,014,777,234 | 453,874,133 | 50,349,906 | 6.9% |
| 1982 | 2,240,976 | 986,796,579 | 445,362,028 | 49,002,433 | 7.0% |
| 1987 | 2,087,759 | 964,470,625 | 443,318,233 | 46,386,201 | 6.9% |
| 1992 | 1,925,300 | 945,531,506 | 435,365,878 | 49,404,030 | 6.6% |
| 1997 (adjusted) | 2,215,876 | 954,752,502 | 445,324,765 | 56,289,172 | 6.3% |
| 2002 | 2,128,982 | 938,279,056 | 434,164,946 | 55,311,236 | 5.9% |
| 2007 | 2,204,792 | 922,095,840 | 406,424,909 | 56,599,305 | 5.8% |
| 2012 | 2,109,303 | 914,527,657 | 389,690,414 | 55,822,231 | 6.0% |
| 2017 | 2,042,220 | 900,217,576 | 396,433,817 | 58,013,907 | 5.9% |
| 2022 | 1,900,487 | 880,100,848 | 382,356,350 | 54,930,363 | 5.8% |
| Change 1978 to 2022 | -15.8% | -13.3% | -15.8% | +9.1% | |
| Change 1997 to 2022 | -14.2% | -7.8% | -14.1% | -2.4% |
Sources for the table: 1978 to 1992 from the U.S. historical table in the 1992 report; 1997 to 2022 from the U.S. historical table in the 2022 report; the Idaho share is our calculation from the Idaho and U.S. irrigated acres.34
Idaho holds about 1.3 percent of the nation's land in farms but 5.8 percent of its irrigated land (2022). That is the heart of the Idaho farmland question: the state's agricultural wealth sits on a narrow band of irrigated ground along the Snake River Plain and in the Treasure Valley, and that band is also where nearly all of the state's population growth is happening. Idaho's share of U.S. irrigated land has slipped from 6.9 percent in 1978 to 5.8 percent in 2022, because irrigated land grew elsewhere (notably in the 1990s, partly from the coverage adjustment) while Idaho's did not.
What an acre is worth, after inflation
The census asks producers to estimate the market value of their land and buildings. The average for Idaho was $574 an acre in 1978 and $4,209 in 2022; for the U.S., $619 and $3,846.1234 Those are nominal dollars, and comparing them directly overstates the rise. Converted to 2025 dollars with the CPI-U, Idaho farm real estate was worth about $2,834 an acre in 1978, fell to about $1,565 in 1992 after the 1980s farm crisis, and rose to about $4,630 in 2022. The U.S. average went from about $3,056 to $4,231. In real terms Idaho went from below the national average to above it.15
| Census year | Idaho, nominal $/acre | Idaho, 2025 dollars | U.S., nominal $/acre | U.S., 2025 dollars | CPI-U annual average |
|---|---|---|---|---|---|
| 1978 | $574 | $2,834 | $619 | $3,056 | 65.2 |
| 1982 | $814 | $2,716 | $784 | $2,616 | 96.5 |
| 1987 | $572 | $1,621 | $627 | $1,777 | 113.6 |
| 1992 | $682 | $1,565 | $727 | $1,668 | 140.3 |
| 1997 | $1,035 | $2,076 | $967 | $1,940 | 160.5 |
| 2002 | $1,270 | $2,273 | $1,213 | $2,171 | 179.9 |
| 2007 | $1,972 | $3,062 | $1,892 | $2,938 | 207.342 |
| 2012 | $2,222 | $3,116 | $2,481 | $3,479 | 229.594 |
| 2017 | $2,866 | $3,764 | $2,976 | $3,909 | 245.120 |
| 2022 | $4,209 | $4,630 | $3,846 | $4,231 | 292.655 |
How we figured it: real land values
Real value = nominal value x (CPI-U 2025 / CPI-U of the census year). We used the BLS CPI-U, U.S. city average, all items, not seasonally adjusted (series CUUR0000SA0), annual averages: 2025 = 321.943, and the census-year values shown in the table.15 Example: Idaho 2022, $4,209 x (321.943 / 292.655) = $4,630. Results are rounded to the dollar. The CPI measures consumer prices, not land prices, so a "real" land value answers one question only: did farmland gain or lose purchasing power compared with the things households buy? The census value is the producer's own estimate as of Dec. 31 of the census year and includes buildings, so it is not a sales price for bare ground.
Land value is where development shows up first. A farm next to a growing city is worth more as future house lots than as a potato field, and the census averages reflect that. The county figures below show it most clearly.
The counties: Treasure Valley, Magic Valley and Kootenai
County tables tell a sharper story than the state total, with the principal-county caution above. The table uses each census's own published figure for that year: 1982 from the 1982 county table, 1992 from the 1992 county table, 1997 and 2002 from the 2002 county table, 2007 and 2012 from the 2012 county tables, and 2017 and 2022 from the 2022 county tables.61617185
| County | 1982 | 1992 | 1997 | 2002 | 2007 | 2012 | 2017 | 2022 | Change 1982 to 2022 |
|---|---|---|---|---|---|---|---|---|---|
| Ada | 247,232 | 232,879 | 239,500 | 223,388 | 191,477 | 144,049 | 112,370 | 112,556 | -54.5% |
| Canyon | 322,143 | 391,050 | 367,543 | 271,992 | 260,247 | 303,836 | 274,952 | 277,388 | -13.9% |
| Kootenai | 199,576 | 131,281 | 142,649 | 154,217 | 130,851 | 124,240 | 139,705 | 107,727 | -46.0% |
| Twin Falls | 578,526 | 489,993 | 460,179 | 441,121 | 439,537 | 484,004 | 468,809 | 459,167 | -20.6% |
| Jerome | 234,362 | 207,552 | 198,569 | 186,319 | 188,753 | 188,075 | 171,643 | 180,152 | -23.1% |
| Gooding | 242,195 | 227,114 | 222,747 | 194,827 | 223,068 | 239,640 | 188,353 | 212,600 | -12.2% |
| Lincoln | 162,304 | 132,429 | 136,972 | 127,853 | 117,377 | 129,724 | 134,911 | 104,847 | -35.4% |
| Minidoka | 209,567 | 208,161 | 209,586 | 228,459 | 226,161 | 244,094 | 267,567 | 308,562 | +47.2% |
| Cassia | 700,051 | 666,342 | 656,665 | 744,260 | 644,740 | 611,055 | 643,346 | 657,664 | -6.1% |
Land in farms, acres. 1982 and 1992 not adjusted for coverage; 1997 on adjusted.
Ada County is the clearest case of farmland turning into city. Its land in farms held near 230,000 to 240,000 acres from 1982 to 1997, then fell in every census through 2017, to 112,370 acres, and held at 112,556 in 2022. In 2022 only 16.7 percent of Ada County's land area was in farms, against 73.8 percent of Canyon County's and 47.1 percent of Jerome County's.5 The decline in Ada matches what any driver on Eagle Road, Chinden Boulevard or Ten Mile Road has watched since the 1990s.
Canyon County is different. Its land in farms swings from 391,050 acres (1992) to 271,992 (2002) to 303,836 (2012) to 277,388 (2022). Those swings are too large and too irregular to be houses alone; they are the signature of principal-county assignments and leases. Its number of farms actually rose, from 2,127 in 1982 to 2,311 in 2022, the opposite of most counties, and likely reflects the growth of small places on the urban edge counted as farms under the $1,000 rule.
In the Magic Valley, Jerome, Twin Falls, Gooding and Lincoln counties all have less land in farms than in 1982, but with ups and downs between censuses. Minidoka County rose by almost 100,000 acres while its farm count fell from 955 to 454, a pattern that fits large operations consolidating and reporting more land there. No one should read Minidoka's gain as new farmland created from desert, or Lincoln's 2017 to 2022 drop of 30,064 acres as subdivisions in Shoshone.
Farm counts by county
| County | 1982 | 1992 | 2002 | 2012 | 2017 | 2022 | Change 1982 to 2022 |
|---|---|---|---|---|---|---|---|
| Ada | 1,408 | 1,174 | 1,420 | 1,233 | 1,304 | 1,142 | -18.9% |
| Canyon | 2,127 | 1,873 | 2,233 | 2,331 | 2,289 | 2,311 | +8.7% |
| Kootenai | 615 | 541 | 828 | 824 | 1,073 | 968 | +57.4% |
| Twin Falls | 1,609 | 1,457 | 1,297 | 1,294 | 1,211 | 1,169 | -27.3% |
| Jerome | 867 | 815 | 635 | 560 | 486 | 448 | -48.3% |
| Gooding | 740 | 683 | 663 | 596 | 538 | 499 | -32.6% |
| Lincoln | 348 | 302 | 280 | 310 | 276 | 229 | -34.2% |
| Minidoka | 955 | 774 | 694 | 622 | 620 | 454 | -52.5% |
| Cassia | 870 | 788 | 692 | 668 | 585 | 554 | -36.3% |
Farms (number), same sources as the land table.61617185 Jerome County's farm count fell by almost half, from 867 to 448, while its land in farms fell 23.1 percent. Fewer, larger operations (especially dairies and the farms that grow their feed) are the main Magic Valley story; the loss of farms to houses is a smaller part of it there than in Ada County.
Irrigated land by county
| County | 1992 | 2007 | 2012 | 2017 | 2022 | Change 1992 to 2022 | Change 2017 to 2022 |
|---|---|---|---|---|---|---|---|
| Ada | 73,794 | 56,973 | 55,254 | 57,263 | 35,479 | -51.9% | -38.0% |
| Canyon | 215,279 | 197,322 | 225,310 | 213,410 | 207,577 | -3.6% | -2.7% |
| Kootenai | 18,723 | 11,035 | 13,778 | 13,659 | 6,315 | -66.3% | -53.8% |
| Twin Falls | 231,351 | 244,520 | 256,974 | 241,479 | 236,196 | +2.1% | -2.2% |
| Jerome | 150,444 | 150,842 | 148,950 | 134,860 | 139,509 | -7.3% | +3.4% |
| Gooding | 115,398 | 132,641 | 141,983 | 121,765 | 132,731 | +15.0% | +9.0% |
| Lincoln | 59,694 | 67,994 | 71,429 | 77,324 | 55,844 | -6.4% | -27.8% |
| Minidoka | 177,516 | 191,585 | 204,534 | 232,707 | 239,043 | +34.7% | +2.7% |
| Cassia | 252,012 | 249,848 | 237,831 | 259,331 | 274,053 | +8.7% | +5.7% |
Irrigated land, acres. 1992 from the 1992 county summary table; 2007 and 2012 from the 2012 irrigation table; 2017 and 2022 from the 2022 irrigation table.161814
Here the Treasure Valley and the Magic Valley split. Ada County lost 38,315 irrigated acres between 1992 and 2022, more than half, and 21,784 of them between 2017 and 2022 alone. Canyon County, despite adding about 44,000 residents from 2020 to 2025 (see below), still reported 207,577 irrigated acres in 2022, within 4 percent of 1992. Jerome, Twin Falls, Gooding, Minidoka and Cassia were roughly stable or up. Magic Valley irrigated ground has so far been reshuffled among operations more than it has been built on.
Cropland in four counties
| County | 1992 | 1997 | 2002 | 2007 | 2012 | 2017 | 2022 | Change 1992 to 2022 |
|---|---|---|---|---|---|---|---|---|
| Ada | 99,890 | 91,825 | 75,491 | 66,122 | 53,441 | 62,860 | 42,862 | -57.1% |
| Canyon | 245,963 | 242,491 | 203,192 | 191,719 | 217,846 | 219,414 | 228,177 | -7.2% |
| Jerome | 165,898 | 162,257 | 144,525 | 157,624 | 148,878 | 134,555 | 150,930 | -9.0% |
| Twin Falls | 292,686 | 310,663 | 268,011 | 267,067 | 275,101 | 257,344 | 249,600 | -14.7% |
Total cropland, acres, same sources.1617185 Ada County also reported 108,519 acres of cropland in 1982, so its cropland has fallen 60.5 percent since then.6
Farm real estate prices by county, 2017 and 2022
The value of land and buildings per acre shows the pull of nearby development. In 2022 the average was $13,588 an acre in Canyon County and $13,084 in Ada, more than three times the state average of $4,209. Kootenai County, at $11,050, doubled in nominal terms from 2017.5
| Place | 2017 nominal | 2022 nominal | 2017 in 2025 dollars | 2022 in 2025 dollars | Real change |
|---|---|---|---|---|---|
| United States | $2,976 | $3,846 | $3,909 | $4,231 | +8.2% |
| Idaho | $2,866 | $4,209 | $3,764 | $4,630 | +23.0% |
| Canyon | $8,240 | $13,588 | $10,822 | $14,948 | +38.1% |
| Ada | $9,511 | $13,084 | $12,492 | $14,393 | +15.2% |
| Kootenai | $5,525 | $11,050 | $7,257 | $12,156 | +67.5% |
| Jerome | $6,039 | $9,012 | $7,932 | $9,914 | +25.0% |
| Gooding | $6,016 | $7,101 | $7,901 | $7,812 | -1.1% |
| Minidoka | $4,539 | $6,202 | $5,962 | $6,823 | +14.4% |
| Twin Falls | $4,439 | $6,129 | $5,830 | $6,742 | +15.6% |
| Lincoln | $3,651 | $5,720 | $4,795 | $6,292 | +31.2% |
| Cassia | $3,190 | $4,486 | $4,190 | $4,935 | +17.8% |
Average value of land and buildings per acre; nominal from the 2022 Idaho county Table 8 and U.S. Table 1; real values are our calculation with CPI-U 2017 = 245.120, 2022 = 292.655, 2025 = 321.943.5315 Jerome County's farm ground was worth, on average, more than twice the state average in 2022. That price includes dairy buildings and the value of reliable water, but it also includes the option value of land near Jerome and the Interstate 84 interchanges.
Land cover from satellites: the National Land Cover Database
The Census of Agriculture counts what farmers report. The National Land Cover Database (NLCD), produced by the U.S. Geological Survey with the Multi-Resolution Land Characteristics Consortium (MRLC), classifies Landsat satellite images into land cover types for every 30-meter square (about 0.22 acre) of the lower 48 states. It does not care who owns the land or what the county assessor calls it; it records what covers the ground. That makes it the best public tool for seeing where fields became rooftops, and it is the data source behind both the American Farmland Trust and Boise State studies discussed below.
The classes that matter here
NLCD has four developed classes, defined by the share of each pixel covered by impervious surfaces such as roofs, roads and parking: developed open space (class 21, under 20 percent impervious, such as large-lot homes, parks and golf courses), low intensity (22, 20 to 49 percent), medium intensity (23, 50 to 79 percent, typical of new single-family subdivisions) and high intensity (24, 80 to 100 percent). The farm classes are pasture/hay (81) and cultivated crops (82). The legacy NLCD products cover 2001, 2004, 2006, 2008, 2011, 2013, 2016, 2019 and 2021.8 A newer Annual NLCD series covers every year from 1985 forward; the MRLC map service now lists an Annual NLCD land cover layer for 2024.19
What we measured, county by county
No agency publishes a county table of developed acres from NLCD, so we built one. The figures below are our own analysis, not an official statistic, and the method is in the box that follows.
| County | Developed 2001 (acres) | Developed 2011 | Developed 2021 | Added 2001 to 2021 | Percent change | Crop and hay cover change 2001 to 2021 | Developed share of county, 2021 |
|---|---|---|---|---|---|---|---|
| Ada | 82,800 | 91,500 | 101,100 | +18,300 | +22.1% | -13,500 (-15.1%) | 14.9% |
| Canyon | 50,800 | 57,200 | 61,700 | +10,900 | +21.4% | -12,500 (-4.5%) | 16.0% |
| Kootenai | 48,600 | 54,200 | 60,400 | +11,800 | +24.3% | -2,200 (-4.2%) | 7.2% |
| Twin Falls | 37,100 | 39,300 | 40,700 | +3,700 | +9.8% | -3,400 (-1.1%) | 3.3% |
| Jerome | 18,000 | 18,700 | 19,200 | +1,200 | +6.9% | -500 (-0.3%) | 5.0% |
| Gooding | 14,600 | 14,900 | 15,400 | +800 | +5.2% | -1,300 (-0.9%) | 3.3% |
| Lincoln | 10,000 | 10,100 | 10,200 | +200 | +2.0% | +1,500 (+1.5%) | 1.3% |
| Minidoka | 18,000 | 18,500 | 18,800 | +800 | +4.4% | -1,000 (-0.5%) | 3.9% |
| Cassia | 30,100 | 30,700 | 31,300 | +1,200 | +4.1% | +400 (+0.1%) | 1.9% |
Our analysis of NLCD 2001, 2011 and 2021 land cover; developed = classes 21 to 24; crop and hay = classes 81 and 82; rounded to the nearest 100 acres, percentages computed before rounding.820
The pattern matches the Census of Agriculture where both are reliable. Ada County added about 18,300 acres of developed land and lost about 13,500 acres of crop and hay cover in twenty years. Canyon County added about 10,900 acres of developed land and lost about 12,500 acres of crop and hay cover, a steadier and smaller change than the swings in its census land in farms, which reflect principal-county assignments and leases as much as land use. Kootenai County added about 11,800 developed acres, but its crop and hay cover was small to begin with (about 51,400 acres in 2001) and fell only about 2,200 acres, so most of its new developed land came from other cover types such as grass, shrub and forest.
The Magic Valley counties barely moved on this measure. Twin Falls County added about 3,700 developed acres, Jerome County about 1,200, Gooding about 800. In Jerome County, crop and hay cover in 2021 was within 500 acres of 2001. That does not mean nothing changed at the edge of Jerome, Twin Falls or Kimberly; it means the change through 2021 was small compared with the hundreds of thousands of irrigated acres around those towns. Most new building in those cities since 2021 is after the last legacy NLCD year, and the Annual NLCD years since 2021 have not yet been run for this lesson.
The denser classes grew fastest
In Ada County, medium- and high-intensity developed land (classes 23 and 24) grew from about 16,400 acres in 2001 to about 28,600 in 2021, up about 74 percent; in Canyon County from about 5,300 to about 11,500, more than doubling.8 New subdivisions in Meridian, Nampa and Caldwell are built at densities that show up as medium intensity, while older rural homes and farmsteads show up as open space or low intensity. Some open-space pixels in 2001 (a farmstead, a canal road) became medium intensity by 2021 without converting a new acre of field.
How we figured it: developed land from NLCD
- We requested the NLCD 2001, 2011 and 2021 Land Cover (CONUS) rasters for each county's bounding box from the MRLC web coverage service, in the native Albers equal-area projection (EPSG:5070) at 30-meter resolution.8
- We clipped each raster to the county boundary from the Census Bureau's 2024 cartographic boundary file (1:500,000 scale).20 That generalized boundary makes Ada County about 678,900 acres, close to the 673,338 acres of land area NASS uses; the small difference is water and boundary smoothing.5
- We counted pixels in each class and multiplied by 900 square meters (0.2224 acre).
- Developed = classes 21, 22, 23 and 24. Crop and hay = classes 81 (pasture/hay) and 82 (cultivated crops).
- We rounded results to the nearest 100 acres. NLCD is a classification with known errors at the pixel level; county totals are more reliable than any single parcel, and small changes (a few hundred acres in a county of several hundred thousand) are within the noise.
Developed land includes roads, highways, rural homes and industrial sites, not only subdivisions. A county's developed acres can grow from a new interstate interchange, a dairy, a food plant or a solar facility's roads. Treat the figures as land cover, not land use.
How much land each new resident used
Dividing new developed acres by new residents gives a rough measure of how compactly each county grew. It is our own ratio and uses two Census Bureau estimate series: July 1, 2001 from the 2000 to 2010 intercensal estimates, and July 1, 2021 from the Vintage 2025 estimates.2122
| County | Population 2001 (estimate) | Population 2021 (estimate) | Residents added | Developed acres added (NLCD, our analysis) | Acres per 1,000 added residents |
|---|---|---|---|---|---|
| Ada | 313,896 | 513,092 | 199,196 | 18,300 | 92 |
| Canyon | 139,179 | 243,711 | 104,532 | 10,900 | 104 |
| Twin Falls | 64,556 | 92,382 | 27,826 | 3,700 | 131 |
| Kootenai | 111,542 | 180,104 | 68,562 | 11,800 | 172 |
| Jerome | 18,579 | 24,741 | 6,162 | 1,200 | 203 |
| Minidoka | 19,603 | 21,951 | 2,348 | 800 | 337 |
| Cassia | 21,557 | 25,235 | 3,678 | 1,200 | 339 |
Ratios computed from unrounded acres. Gooding (1,585 added residents) and Lincoln (1,132) are left out because the denominators are too small for the ratio to mean much.
Ada and Canyon counties, despite their reputation for sprawl, used the least land per new resident: about 0.09 to 0.10 acre per person, or roughly one acre for every ten people. Kootenai and the Magic Valley counties used more per person, because a larger share of their new development was rural homes on big lots, highways and agricultural buildings. That is a useful counterweight to the common assumption that the fastest-growing places are always the most wasteful of land. The fastest-growing counties converted the most total farmland, but per person they grew more compactly.

The National Resources Inventory: developed land statewide since 1982
The National Resources Inventory (NRI) is a statistical survey of land use on non-federal land run by the USDA Natural Resources Conservation Service with Iowa State University. It revisits the same sample points over time and estimates, for each state, how many acres are cropland, pasture, rangeland, forest, other rural land and developed land. Its newest release, the 2022 NRI Summary Report, was published in February 2026 and covers 1982 to 2022. Every estimate comes with a margin of error. The NRI does not publish county figures.7
| Year | Idaho developed land (thousand acres) | Margin of error | U.S. developed land (thousand acres) | Idaho non-federal cropland (thousand acres) | Idaho prime farmland, all rural uses (thousand acres) |
|---|---|---|---|---|---|
| 1982 | 562.9 | plus or minus 50.8 | 72,600.6 | 6,410.8 | 3,114.6 |
| 1987 | 622.4 | plus or minus 53.3 | 78,704.5 | 6,066.9 | 3,106.9 |
| 1992 | 680.3 | plus or minus 57.5 | 86,001.9 | 5,629.0 | 3,086.0 |
| 1997 | 772.1 | plus or minus 64.2 | 96,672.0 | 5,512.0 | 3,032.8 |
| 2002 | 820.6 | plus or minus 66.1 | 105,396.3 | 5,396.7 | 2,945.1 |
| 2007 | 877.1 | plus or minus 73.0 | 111,118.1 | 5,201.6 | 2,872.0 |
| 2012 | 904.2 | plus or minus 74.3 | 114,235.5 | 5,233.3 | 2,846.5 |
| 2017 | 939.9 | plus or minus 78.3 | 117,051.7 | 5,281.5 | 2,828.1 |
| 2022 | 990.5 | plus or minus 80.6 | 120,159.8 | 5,360.3 | 2,813.6 |
USDA NRCS, 2022 NRI Summary Report: developed land from Table 1, cropland from Table 2, prime farmland from Table 14.72324 NRI "cropland" is a land use category and is not the same as the Census of Agriculture's total cropland; land enrolled in the Conservation Reserve Program is counted separately (214.9 thousand acres in Idaho in 2022).23
By the NRI's estimate, Idaho added 427.6 thousand acres of developed land from 1982 to 2022, an increase of 76.0 percent, while the U.S. increase was 65.5 percent. Idaho added 50.6 thousand acres between 2017 and 2022 alone. Developed land is still a small share of the state: 990.5 thousand acres is about 5.1 percent of Idaho's 19.4 million acres of non-federal land, and Idaho's 33.5 million acres of federal land are not in the inventory at all.7 The margins of error matter: the 1982 and 2022 Idaho estimates each carry margins of 50 to 80 thousand acres, so the 40-year change is clear, but a one-period change of a few tens of thousands of acres is not precise.
Idaho against its Mountain West neighbors
| State | Developed land 1982 (thousand acres) | Developed land 2022 (thousand acres) | Change |
|---|---|---|---|
| Nevada | 215.2 | 538.0 | +150.0% |
| Utah | 473.7 | 991.6 | +109.3% |
| Idaho | 562.9 | 990.5 | +76.0% |
| United States | 72,600.6 | 120,159.8 | +65.5% |
| Washington | 1,606.8 | 2,567.7 | +59.8% |
| Oregon | 1,007.0 | 1,489.1 | +47.9% |
| Montana | 853.2 | 1,168.6 | +37.0% |
| Wyoming | 534.4 | 707.8 | +32.4% |
USDA NRCS, 2022 NRI Summary Report, Table 1; percent change is our calculation.7 Idaho and Utah now have almost the same amount of developed non-federal land (990.5 and 991.6 thousand acres), though Utah started from less.
Prime farmland
Federal rules define prime farmland as "land that has the best combination of physical and chemical characteristics for producing food, feed, forage, fiber, and oilseed crops," and say that "in general, prime farmlands have an adequate and dependable water supply from precipitation or irrigation." Urban built-up land and water are excluded by definition.25 In arid southern Idaho, many soils qualify as prime only where they are irrigated, which is why NRCS soil surveys often label them "prime farmland if irrigated." Water and soil are one resource in this part of the country.
The NRI estimates Idaho had 3,114.6 thousand acres of prime farmland in rural uses in 1982 and 2,813.6 thousand in 2022, a decline of 301.0 thousand acres, or 9.7 percent. About 2,512.9 thousand acres of the 2022 total was in cropland.24 Each estimate has a margin of error of about plus or minus 220 to 240 thousand acres, so the exact size of the loss is uncertain even though the direction is consistent across all nine inventory years. Prime farmland drops out of the rural total mainly when it is developed, since developed land is excluded from the definition.
To see whether a specific field is prime, the free NRCS Web Soil Survey lets anyone draw an area of interest on a map and print a "Farmland Classification" report, which shows prime, prime if irrigated, statewide importance and not prime. Reporters and planning commissioners can attach that report to a rezone file.
Advocacy and university estimates of farmland loss
American Farmland Trust, Farms Under Threat (advocacy group)
American Farmland Trust (AFT) is a national nonprofit that advocates for farmland protection. Its Farms Under Threat series, built with Conservation Science Partners from satellite land cover and other national datasets, is the most widely quoted source on farmland conversion. Its state release for Idaho, dated May 20, 2020, said Idaho "lost nearly 70,000 acres of farmland" from 2001 to 2016, "an area larger than the city of Boise," and that 26 percent of what was lost was "Nationally Significant," AFT's term for the most productive, versatile and resilient land. It named hotspots near urban centers: "Rathdrum Prairie and the Treasure and Magic Valleys." It also reported that land in low-density residential areas was "122 times more likely to be converted to urban high-density land use than other agricultural land."9 Boise State University's farmland project page gives the precise AFT figure as 68,823 acres.10 Nationally, AFT estimated 11 million acres of farmland and ranchland converted from 2001 to 2016: 4.1 million to urban and highly developed use and nearly 7 million to low-density residential use.26
Two cautions. AFT counts land "converted" when it becomes low-density residential, meaning scattered homes on land that may still be grazed or hayed; the Census of Agriculture would still count much of that as land in farms. And AFT is an advocacy organization whose purpose is to win farmland protection policy. Its methods are published and its numbers are widely used by government agencies, but they are not official statistics, and this lesson labels them that way.
Boise State University research
Researchers in Boise State's Human-Environment Systems program, led by professor Jodi Brandt, have studied Treasure Valley farmland loss for more than a decade. A 2017 white paper from the university's MILES program, using the 2001 and 2011 NLCD, found that Treasure Valley urban land grew 10 percent and agricultural land fell 5 percent from 2001 to 2011. It projected that under high-growth, low-density scenarios "59-64% of current agricultural land will be lost by 2100" (about 190,000 to 220,000 acres), and about 31 percent (about 110,000 acres) under a high-density scenario. Its own Table 2 lists 240,000 acres for the high-growth scenario, which does not match the text's range; readers should cite the scenario, not a single number.27
A June 8, 2026 Boise State news story about the same research team says "the Treasure Valley has lost 100,000 acres" of agricultural land "over the past two decades."28 We could not find the underlying table, years or boundary for that figure, so it is listed as unverified. It is in the same range as our NLCD analysis, which finds Ada and Canyon counties together losing about 26,000 acres of crop and hay cover from 2001 to 2021; the difference likely depends on how "agricultural land" and "Treasure Valley" are defined (for example, whether Gem, Payette and Elmore counties and pasture are included).

Water rights that move with development
In most of southern Idaho, farmland exists because water was delivered to it. The Twin Falls and North Side tracts, the Boise Project and the canal systems of the Treasure Valley turned sagebrush into cropland a century ago (the town histories are in lesson 4, and Idaho water law basics in Water, Land and Agriculture). When a field becomes a subdivision, the water does not simply disappear. What happens to it is governed by a handful of Idaho statutes, and the records they create are public.
Surface water must be used where it is available
Idaho Code 67-6537, part of the Local Land Use Planning Act, requires that "All applicants proposing to make land use changes shall be required to use surface water, where reasonably available, as the primary water source for irrigation." Surface water counts as reasonably available if a surface water right is or can be made appurtenant to the land, if the land is entitled to water from an irrigation district or canal company that can deliver it, or if such an entity has enough water and a system able to deliver it. The same section says the law does not override water rights under Titles 42 and 43, and it requires a city or county amending its land use plan to "consider the effect" on groundwater. The section was added in 1989 and amended in 2005 and 2025.29
Idaho Code 31-3805, enacted in its current form in 2025 and amended in 2026, applies the same idea at the plat stage. If surface water for irrigation is reasonably available, no plat dividing the land can be accepted, approved or recorded unless the owner provides for irrigating the lots with that water. Plats served by an irrigation entity must describe the delivery system and carry notes telling buyers they remain responsible for the entity's assessments, which are a lien on the land. Inside a city's water service area or area of impact, a shared well or public water system in a new subdivision must be designed to connect to the city's system, and if it connects, the water rights go to the city.30
The practical result: in many new Treasure Valley subdivisions built on irrigated farmland, the canal water that once ran down furrows now runs through a pressurized irrigation system to lawns and common areas, and the homeowners or their association pay the irrigation district or canal company assessment. The farm is gone, but the water right and the delivery obligation often remain attached to the same ground.
Changing a water right from farm to city
When a water right itself moves, Idaho Code 42-222 governs. Anyone holding a licensed or decreed right may apply to the Idaho Department of Water Resources (IDWR) to change the point of diversion, place of use, period of use or nature of use. IDWR may approve only if no other water right is injured, the change is not an enlargement of the original right, and it is consistent with conservation and the local public interest. One sentence speaks directly to farmland: "The director shall not approve a change in the nature of use from agricultural use where such change would significantly affect the agricultural base of the local area."31
Cities and other municipal providers may hold water rights for "reasonably anticipated future needs," a term Idaho Code 42-202B defines by population and planning data, and which must not conflict with the land use plans each municipality has approved. Water held for future needs cannot be moved outside the provider's service area.32
Two things follow for anyone tracking farmland loss. First, IDWR's water right transfer files show, application by application, when irrigation rights are converted to municipal use, which is a direct, dated record of agricultural water leaving farming. Second, the "agricultural base" clause gives protestants a legal argument in a transfer case, though the statute does not define "significantly." Groundwater rights on the Eastern Snake Plain Aquifer add another layer, since curtailment orders and mitigation plans affect which rights can be used at all; that is covered in lesson 10 and, for residents with wells and irrigation shares, in Water Rights and Ag Land for Residents.
The rules that decide where farmland goes
Farmland is converted one rezone, annexation and plat at a time. The statewide framework for those decisions is explained in Idaho Planning and Zoning; Part B of this series, coming later, covers the 2026 zoning, building and property tax laws. Three pieces bear directly on farmland.
Areas of city impact
Idaho Code 67-6526, substantially rewritten in 2024, puts areas of city impact under county jurisdiction: "county commissioners make the final determination regarding area of impact boundaries." An impact area may not extend beyond areas "very likely to be annexed to the city within the next five (5) years," generally may not reach more than two miles from city limits, must be set by ordinance after notice and hearing, and must be reviewed at least every five years. Counties and cities were required to reestablish impact areas to conform with the new rules by Dec. 31, 2025.33 Impact area maps are therefore the best single document for where a city expects to grow onto farm ground in the next five years, and each county's 2025 ordinance is a public record worth requesting.
Agricultural protection areas (2024)
In 2024 the Legislature passed the Agricultural Protection Area Act, Idaho Code Title 67, Chapter 97 (2024 Session Laws, chapter 215). Its stated intent is that working farms, ranches and forests are being lost to population growth and development, and that the state will protect them through "voluntary planning tools" that do not affect owners who choose not to participate.34 An Idaho State Bar article by Dustin W. Manwaring summarizes how it works: owners apply to have land included; the county commission decides after notice and a hearing; land stays in an agricultural protection area for at least 20 years under the county ordinance; local governments generally cannot condemn production agriculture land inside one; counties were to adopt ordinances by Jan. 1, 2025; and the act "does not yet provide any financial incentives."35 How many acres Idaho counties have enrolled is not reported statewide; that is a good records request.
Conservation easements and purchase programs
In some other states, a public agency buys the development rights to a farm from a willing owner, through a recorded conservation easement, so the land stays in agriculture permanently. The 2024 Idaho act does not pay landowners. We did not find a state-funded purchase program of that kind in Idaho, and that point is listed at the end of this lesson as not fully confirmed. A county or city could fund its own purchases. Whether that is a good use of public money is one of the hard questions below.

The 2027 Census of Agriculture and the gap since 2022
The biggest hole in this lesson is time. The newest Census of Agriculture is for 2022, released on Feb. 13, 2024.36 Everything that happened on Idaho farmland in 2023, 2024, 2025 and 2026, including the subdivisions now going in around Jerome, Kimberly, Middleton, Star and Kuna, will first appear in the 2027 census. NASS published notices in the Federal Register on Jan. 14, 2026 and May 29, 2026 seeking approval to reinstate the information collection for the 2027 Census of Agriculture, with an estimated 3,889,950 respondents.1137 Neither notice gives a release date. If NASS follows the 2022 schedule, when results for census year 2022 came out about 14 months after the year ended, results for 2027 would arrive around early 2029; that is our expectation, not an announced date.
Until then, the best tools for the 2022 to 2026 period are the Annual NLCD years after 2021 as they are released, high-resolution aerial imagery from the USDA National Agriculture Imagery Program (NAIP), city annexation ordinances and plats, county assessor records of parcels moving out of agricultural use, IDWR transfer files, and building permit counts (see lesson 3 for permits by city since 2020).
Pictures, Numbers and Infographics
The key numbers from this lesson in one table. "Place" is the county or region named in each row. Every figure is from the table named in its note; percentages and real dollars are our calculations.
| Measure | U.S. | Idaho | Place | Year | Source |
|---|---|---|---|---|---|
| Land in farms, acres | 880,100,848 | 11,547,963 | Ada County 112,556; Jerome County 180,152 | 2022 | NASS Census of Agriculture135 |
| Change in land in farms | -13.3% (1978 to 2022) | -21.4% (1978 to 2022) | Ada -54.5%; Jerome -23.1% (1982 to 2022) | 1978/1982 to 2022 | NASS246 |
| Irrigated land, acres | 54,930,363 | 3,167,499 | Ada 35,479; Canyon 207,577; Jerome 139,509; Twin Falls 236,196 | 2022 | NASS1314 |
| Change in irrigated land | +9.1% (1978 to 2022) | -8.9% (1978 to 2022) | Ada -51.9%; Jerome -7.3% (1992 to 2022) | to 2022 | NASS216 |
| Farm real estate value per acre, 2025 dollars | $4,231 | $4,630 | Canyon $14,948; Ada $14,393; Jerome $9,914 | 2022 | NASS, CPI-U, our calculation515 |
| Developed non-federal land, thousand acres | 120,159.8 | 990.5 | No county estimates in the NRI | 2022 | NRCS NRI Table 17 |
| Growth in developed land | +65.5% | +76.0% | Utah +109.3%; Montana +37.0% | 1982 to 2022 | NRCS NRI Table 17 |
| Developed acres added (NLCD, our analysis) | Not computed | Not computed | Ada +18,300; Canyon +10,900; Twin Falls +3,700; Jerome +1,200 | 2001 to 2021 | USGS/MRLC NLCD8 |
| Prime farmland in rural uses, thousand acres | See NRI Table 14 | 2,813.6 (down from 3,114.6 in 1982) | No county estimates in the NRI | 2022 | NRCS NRI Table 1424 |
| Farmland converted, advocacy estimate | 11 million acres | 68,823 acres | Hotspots: Rathdrum Prairie, Treasure and Magic Valleys | 2001 to 2016 | American Farmland Trust (advocacy)91026 |
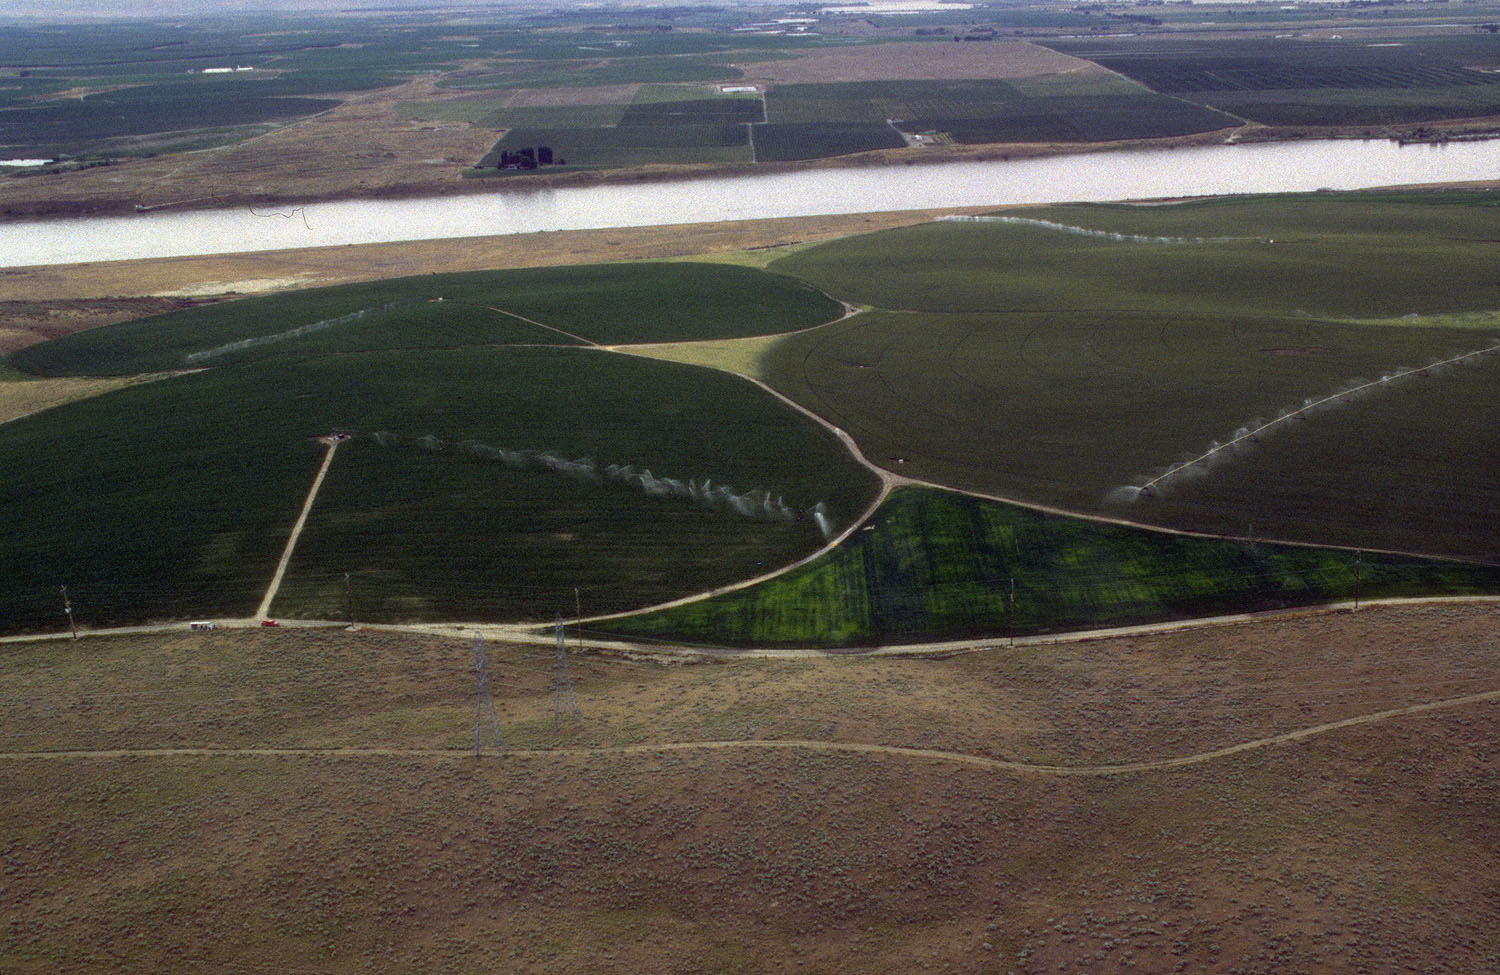
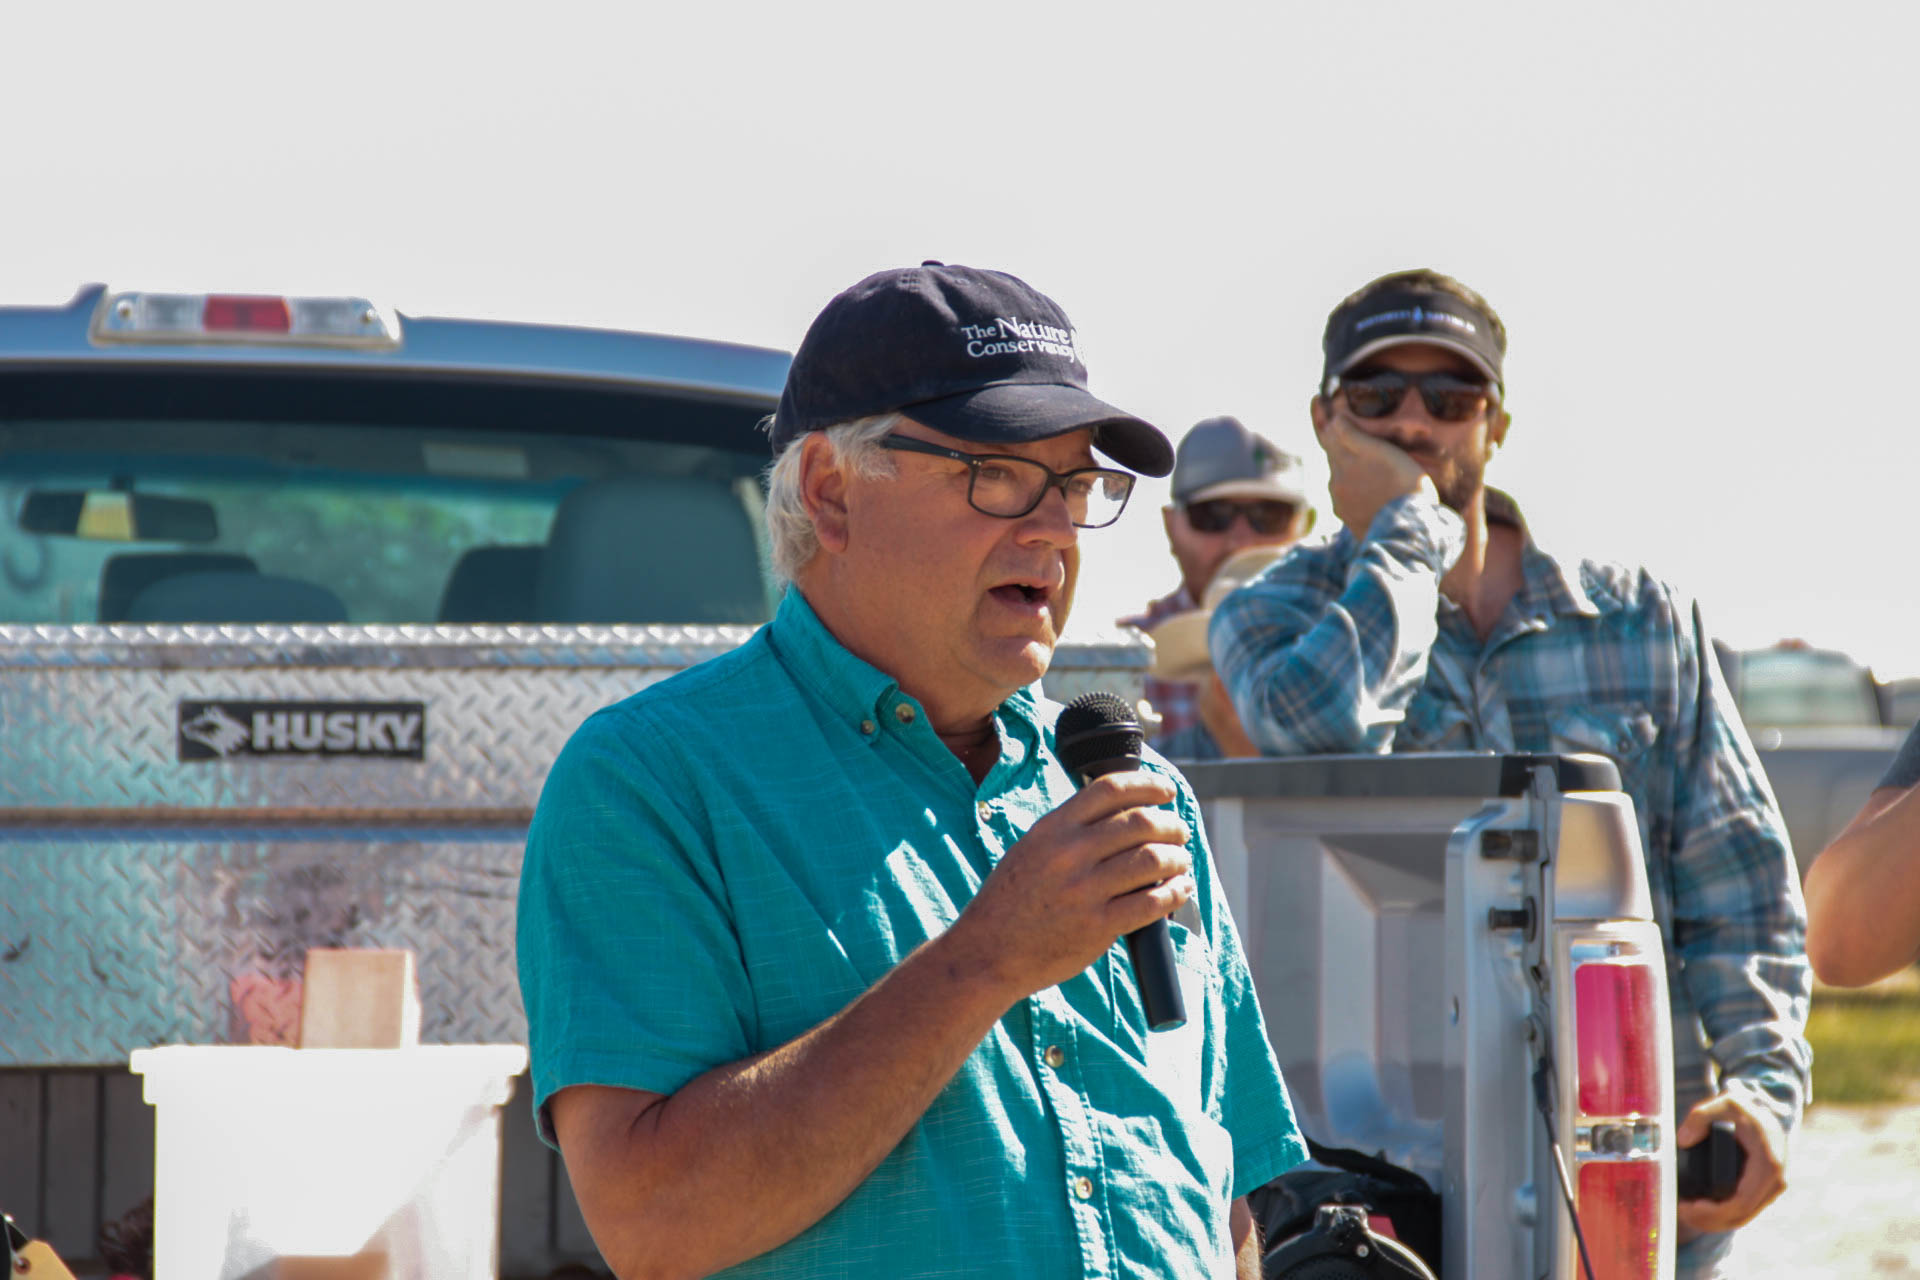
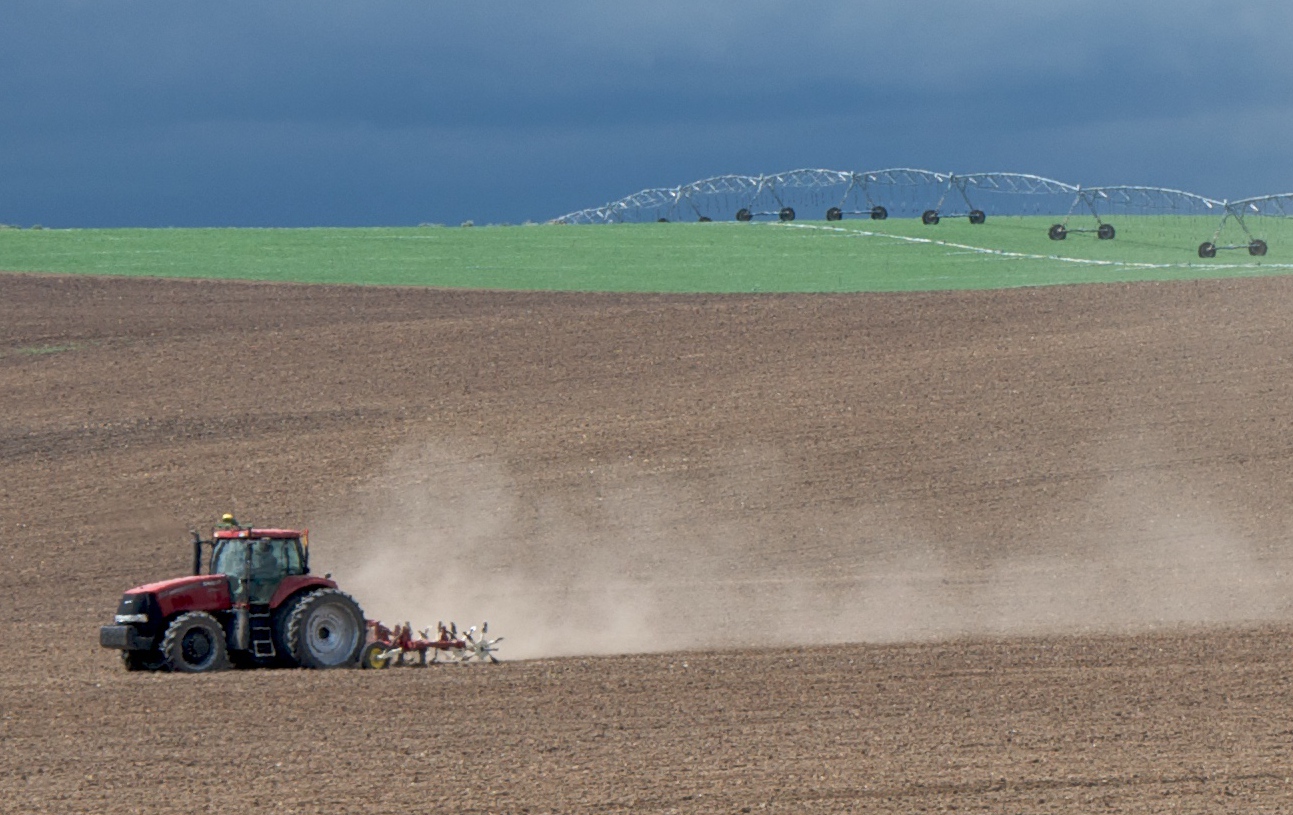
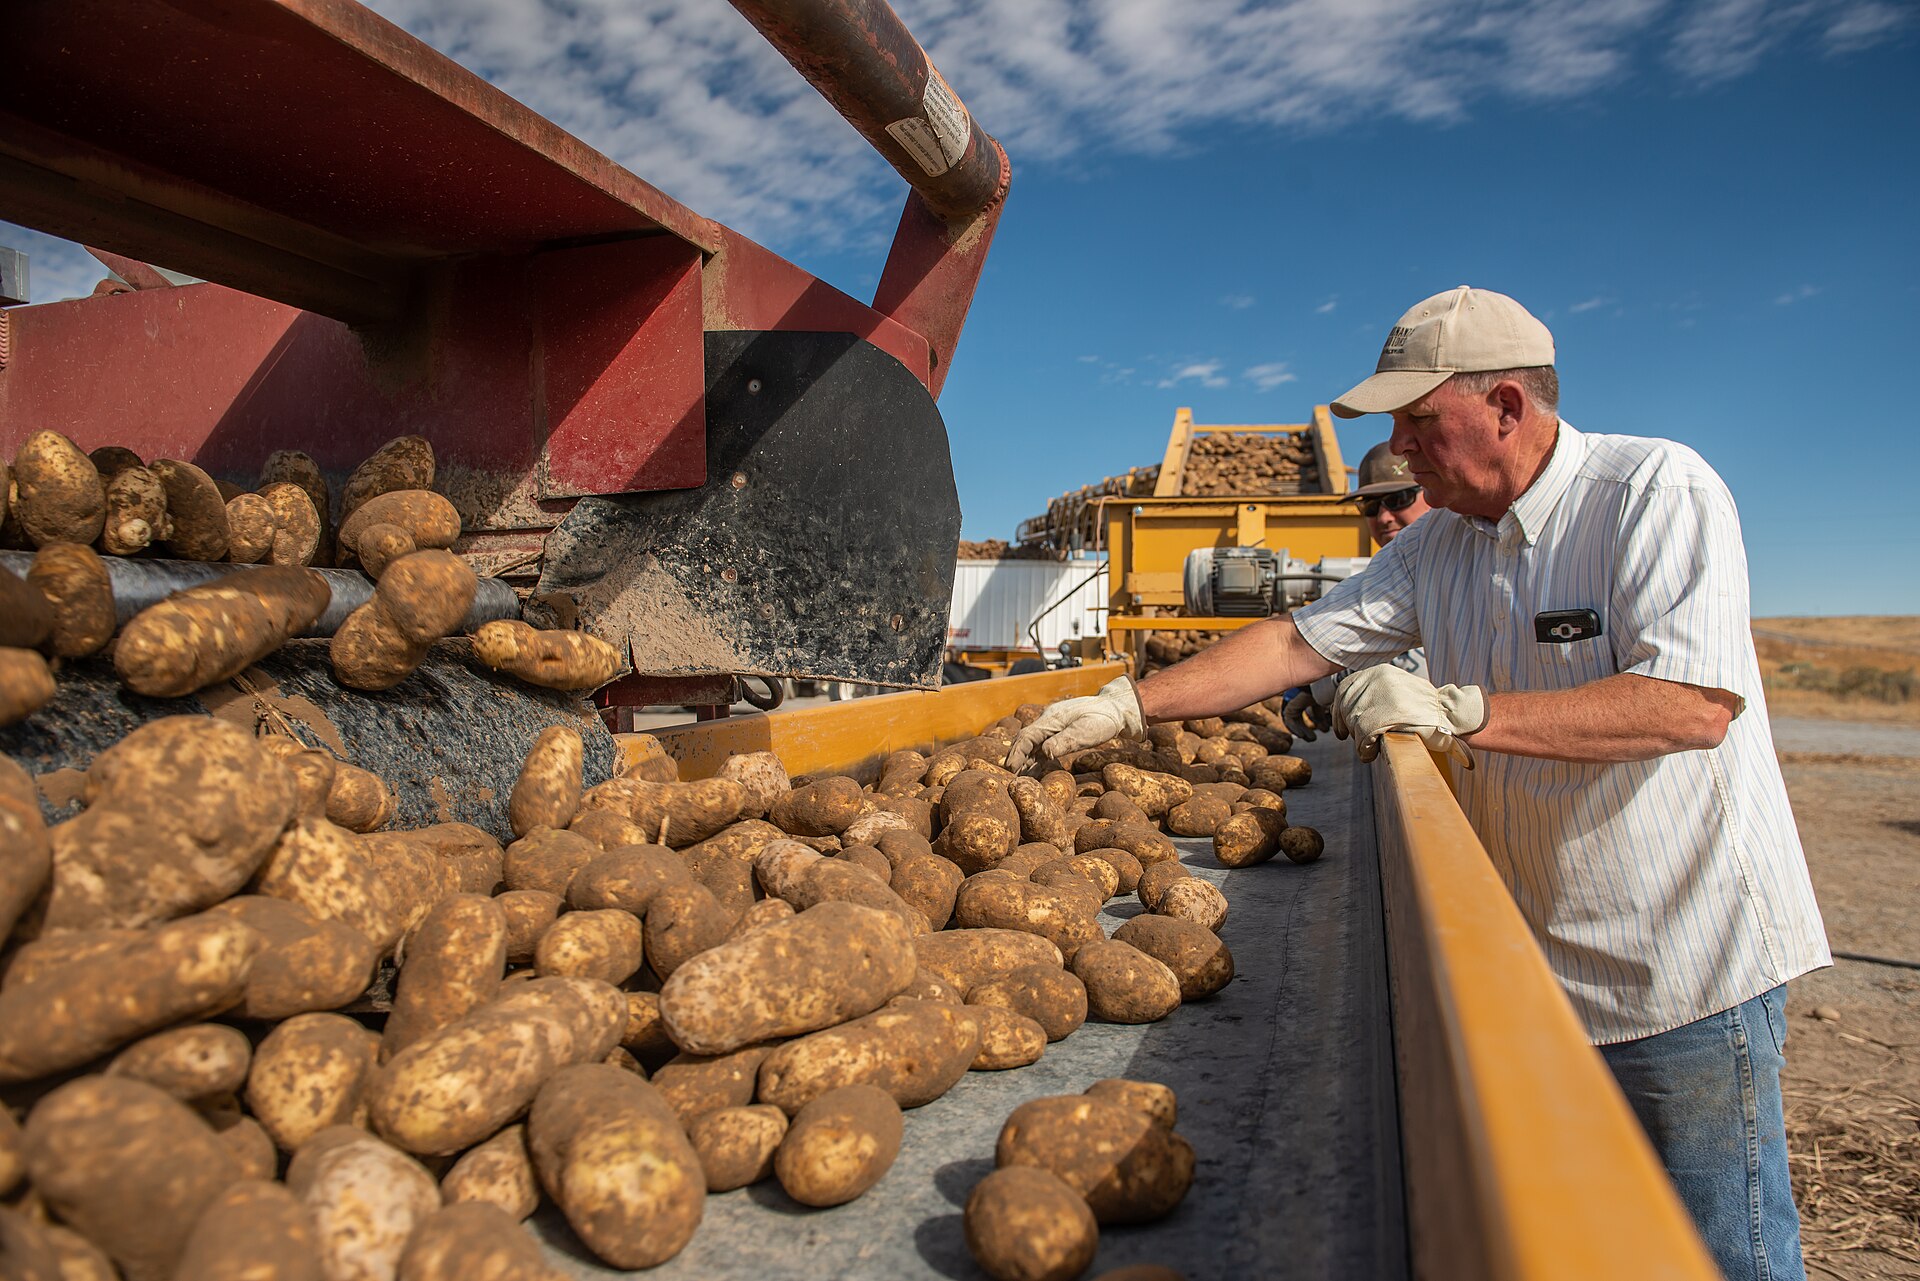
The photographs in this lesson show the ground the numbers describe: center-pivot potato fields, a Kimberly farm field day, a tractor and irrigation line near Silver Creek, and a potato harvest in Declo. The charts are original drawings from the cited tables; each chart's text description is available to screen readers.
Common mistakes
These are the errors that show up most often when farmland numbers reach hearings, op-eds and news stories. We describe them as general pitfalls rather than name a culprit, except where a source's own documents show the problem.
- Treating "land in farms" as farmland lost to houses. A drop in land in farms can be a ranch giving up a private range lease or a large operation reporting from another county. Minidoka County gained 98,995 acres in farms from 1982 to 2022 while losing half its farms; Lincoln County lost 30,064 acres between 2017 and 2022. Neither is mostly about houses.56 Use irrigated land, cropland or satellite land cover for conversion.
- Comparing 1992 and earlier censuses with 1997 and later without saying so. The coverage adjustment began with 1997. The 2022 Idaho report shows 1997 both ways, 12,057,001 acres adjusted and 11,830,167 unadjusted, a difference of 226,834 acres from method alone.1
- Reading nominal land values as real gains. Idaho's average went from $574 an acre in 1978 to $4,209 in 2022, more than seven times higher in nominal dollars; in 2025 dollars it went from about $2,834 to $4,630, up 63 percent.15
- Counting farms to measure agriculture. The $1,000 farm definition has not changed since 1974. Rural home lots can raise the farm count (Canyon County's rose from 1982 to 2022) while cropland falls.12
- Mixing a study's projection with its measurement. The 2017 Boise State white paper measured 2001 to 2011 change and projected 2100 losses under several scenarios; its text range (190,000 to 220,000 acres) and its own Table 2 (240,000 acres for high growth) differ.27 Quote the scenario and the year, not a bare number.
- Quoting an advocacy figure as an official statistic. AFT's "nearly 70,000 acres" counts low-density residential land as converted, a definition the Census of Agriculture does not use.9 Name the source and its definition.
- Treating a satellite pixel count as a parcel fact. NLCD classifies 30-meter squares and has pixel-level error. County totals are useful; a claim about one farm needs aerial photos, the plat or the assessor record.
- Ignoring margins of error. The NRI's Idaho prime farmland estimates carry margins of plus or minus 220 to 240 thousand acres, about the size of the 1982 to 2022 decline itself.24
- Assuming the newest number is recent. The newest farm census is for 2022. A story in 2026 that says "Idaho has 11.5 million acres in farms" should say "as of 2022."
What we know, what we don't, and what the data can show
What we know
- Idaho's land in farms, cropland and irrigated land are all lower than in 1978, and since 1997 the decline has been sharper for cropland (down 12.6 percent) and irrigated land (down 10.6 percent) than for land in farms (down 4.2 percent).1
- Ada County has lost more than half of its land in farms, cropland and irrigated land since the 1980s and early 1990s, the largest percentage loss of land in farms among the counties examined here (Kootenai County lost a larger share of its much smaller irrigated acreage, 66.3 percent from 1992 to 2022).5616
- Idaho's developed non-federal land grew about 76 percent from 1982 to 2022, faster than the nation but slower than Utah and Nevada.7
- Through 2021, satellite land cover shows the Magic Valley counties changed little compared with Ada, Canyon and Kootenai counties.8
- Farm real estate in Ada, Canyon and Kootenai counties was worth about 2.6 to 3.2 times the state average per acre in 2022, a sign of development pressure on prices.5
What we don't know
- How many acres of farmland each city has converted since 2020. No agency publishes it; annexation ordinances, plats and assessor files would have to be compiled city by city.
- How much farmland was converted from 2022 to 2026. The next farm census is for 2027, and the Annual NLCD years after 2021 have not been analyzed for these counties.
- Why Idaho's land in farms dropped by 1.4 to 1.6 million acres between the 1992 and 1997 censuses.
- How much of the 2017 to 2022 drop in Idaho's irrigated land was water not applied in that year rather than land permanently taken out of irrigation.
- How much irrigation water from converted farms is now used on lawns and common areas, and how much has moved to municipal rights.
- How many acres Idaho counties have placed in agricultural protection areas under the 2024 act.
What the data can show
- Where farm cover became developed, year by year since 1985: USGS Annual NLCD land cover, clipped to city limits or impact areas, can show acres converted by city through 2024.
- Whether conversion lands on the best soils: overlaying NLCD change on NRCS soil survey (SSURGO) farmland classification shows how much converted land was prime or prime if irrigated.
- When irrigation water leaves farming: IDWR water right transfer files record each change in nature of use from irrigation to municipal, with dates and acres.38
- Whether the Magic Valley is following the Treasure Valley: the 2027 Census of Agriculture county tables (Tables 8 and 10) compared with 2017 and 2022 will show whether Jerome and Twin Falls counties begin losing irrigated land the way Ada did after 2002.
- How compact new growth is: NLCD developed acres compared with Census population estimates and building permits give acres per new resident and per new home.
Questions people ask
Is Idaho running out of farmland?
No, but it is losing its most valuable kind in its fastest-growing places. Idaho still had 11,547,963 acres in farms and 3,167,499 irrigated acres in 2022.1 Developed land is about 5 percent of the state's non-federal land.7 The concern is concentrated: Ada County's irrigated land fell by more than half from 1992 to 2022, and prime farmland statewide fell by an estimated 301 thousand acres since 1982.1624 Irrigated cropland near cities cannot easily be replaced, because new irrigation from the Snake River and the aquifer is limited (see lesson 10).
How many acres of farmland have been built on since 2020?
No public agency has published that number for Idaho, any county or any city. The 2022 census captures only 2020 to 2022 in part, and NLCD's legacy series stops at 2021. The figure can be built from Annual NLCD, aerial imagery and city annexation records, but any such figure is an analysis, not an official count, and should be labeled that way.
Why do county farm numbers jump around between censuses?
Because each farm is counted in its principal county, leases of rangeland come and go, and large operations consolidate. Gooding County's land in farms went from 239,640 acres in 2012 to 188,353 in 2017 and back to 212,600 in 2022.185 Swings like that are bookkeeping, not bulldozers. Look at several censuses and at irrigated land before drawing conclusions.
Do subdivisions use more or less water than the farms they replace?
It depends on the crop, the lot size, the irrigation system and whether the subdivision uses canal water for lawns. The data in this lesson cannot answer it. IDWR's consumptive-use determinations in transfer cases, and irrigation district delivery records, are where the evidence is. The statutes do require that surface water be used where reasonably available, so many subdivisions keep using the canal water the farm used.2930
Can a county stop farmland from being converted?
Counties and cities decide rezones, plats and, for counties, the boundaries of city impact areas, so they control where conversion is allowed.33 The 2024 Agricultural Protection Area Act adds a voluntary tool for owners who want to stay in farming.34 Idaho law also protects property rights and limits what local governments may require; the planning and zoning details are in Idaho Planning and Zoning.
How can I check what kind of farmland a specific parcel is?
Use the free NRCS Web Soil Survey to see the soil map units and their farmland classification for the area you draw.39 The county assessor's parcel record shows whether the land is taxed as agricultural. The irrigation district or canal company can tell you whether the land carries water shares or assessments, and IDWR's water right search shows any rights tied to the place of use.38
Is the Magic Valley next?
The data through 2021 and 2022 do not show Treasure Valley-style conversion in Jerome, Twin Falls or Gooding counties: their irrigated land was roughly stable and their developed land grew by a few thousand acres or less.148 But land values are rising quickly (Jerome County up 25.0 percent in real terms from 2017 to 2022), new subdivisions are being permitted at the edges of the core towns (permit counts are in lesson 4 and lesson 3), and the post-2022 period is not yet in any farmland dataset.5
Hard questions
Should cities slow annexation to save farmland?
The case for: irrigated cropland near cities is limited and is the most productive ground in the state; once paved it does not come back. Ada County's experience (more than half its irrigated land gone in thirty years) shows how quickly it can happen. Slower annexation and higher density inside city limits would stretch the remaining land further, and our NLCD ratios show that compact growth uses far less land per person.
The case against: land owners have a right to sell, and many farm families depend on the value of their land for retirement; a farmer near Meridian whose land is worth more than $13,000 an acre has a strong interest in that option.5 Limiting annexation pushes growth into rural county subdivisions on wells and septic systems, which can use more land per home, or raises housing prices inside the city. Idaho's population grew from 1,839,123 (April 2020 base) to an estimated 2,029,733 in 2025; those people live somewhere.22
What the evidence shows: the counties that grew fastest used the least land per new resident, which supports building inside or next to cities rather than scattered rural lots. The data cannot say whether slowing annexation would reduce total conversion or move it elsewhere.
Should taxpayers pay farmers not to develop?
The case for: buying development rights is voluntary, pays the owner fair value, and keeps land in farming permanently; it is how other states have protected farmland without forcing anyone. The 2024 Idaho act creates a protection-area tool but no money.35
The case against: at the 2022 census average of more than $13,000 an acre for land and buildings in Ada and Canyon counties, the full value of even 2,000 acres would exceed $26 million; development rights alone cost less than full value but would still compete with schools and roads for local money. Easements also bind future owners and future councils.
What the evidence shows: the price of protection is set by development pressure: land is cheapest to protect where it is least threatened, and most expensive where it matters most. The census value-per-acre figures show that gap clearly.
Is the real limit land or water?
One view: farmland loss is about acres, and the solution is land use planning. Another view: in southern Idaho the binding limit is water, and curtailment orders on the Eastern Snake Plain Aquifer may take more acres out of irrigation than subdivisions ever will. What the evidence shows: both are visible in the census. Ada County's irrigated land fell with its land in farms, a land story; Idaho's 2017 to 2022 irrigated decline of 230,767 acres happened while land in farms fell less, which fits a water story as well. The 2027 census and IDWR records will help separate them.1
Does growth pay for itself, or does it cost farmers?
Builders and new residents: growth brings jobs, customers and a tax base, and farm families who sell share in it; Idaho farm real estate gained value faster than the national average in real terms. Longtime residents and farmers who stay: scattered development raises land rents, brings traffic onto farm roads, complaints about dust and odor, and pressure on canal systems that were built for fields. What the evidence shows: the gains are visible in land values; the costs to remaining farms are real but poorly measured by any public dataset.
For reporters and advocates
Public records that show farmland conversion. All of these can be requested under the Idaho Public Records Act (Idaho Code Title 74, Chapter 1); see Idaho Public Records Requests.
- City annexation ordinances with legal descriptions and acreage; ask the city clerk for every annexation ordinance since Jan. 1, 2020, with acres.
- County area of city impact ordinances and maps adopted to meet the Dec. 31, 2025 deadline in Idaho Code 67-6526.33
- Preliminary and final plats, with the irrigation notes Idaho Code 31-3805 requires.30
- County assessor records of parcels removed from agricultural property tax treatment, by year (the property tax side is in Idaho Property Taxes).
- IDWR water right transfer applications changing irrigation rights to municipal use; IDWR has an online search for newly submitted transfers.3840
- Irrigation district and canal company records of land taken out of delivery or converted to pressurized urban systems (irrigation districts are public bodies under Idaho law; canal companies are private and may decline).
- Agricultural protection area applications and approvals under Idaho Code Title 67, Chapter 97.34
Questions to ask officials. How many acres has the city annexed since 2020, and how many of those were irrigated farmland? What share of the impact area is prime or prime-if-irrigated soil? What happened to the water rights on the last five large annexations? Has the county adopted an agricultural protection area ordinance, and how many acres are enrolled? Does the city's land use plan set any target for farmland retention, and how is it measured?
The Idaho and Magic Valley angle. The Treasure Valley shows what conversion looks like at full speed; the Magic Valley is at the point where Ada County was in the late 1990s, with land values rising and subdivisions appearing at the edges of Jerome, Twin Falls and Kimberly. The 2027 census results, expected around 2029, will be the first official test. Reporters can get ahead of it by compiling annexation and plat acreage now, and by asking farmers who lease ground near town how much of their rented land has been sold.
Data to download. NASS Quick Stats (county Census of Agriculture series), the 2022 NRI Summary Report, MRLC's NLCD and Annual NLCD downloads, and the Census Bureau's county population estimates are all free. The steps for building a county or town profile are in lesson 13; how this compares with the rest of the country is in lesson 11.
Where to go next
- NASS Quick Stats: Free USDA database of every Census of Agriculture county and state series; pick Census, then Economics or Crops, then the county, and download a CSV. For reporters, planners and students.
- NASS Census of Agriculture historical archive: Free scans of every census report back to 1840; choose a year and state to get the county tables used in this lesson.
- MRLC NLCD Viewer and downloads: Free land cover maps and rasters from USGS, including Annual NLCD; use the viewer to compare two years for any area without GIS software.
- NRCS Web Soil Survey: Free soil maps; draw an area of interest and check its farmland classification (prime, prime if irrigated, statewide importance). Useful for rezone files.
- IDWR water right and transfer searches: Free Idaho Department of Water Resources tools to look up water rights and pending transfer applications by number, owner or location.
- USDA NRCS National Resources Inventory: Free state-level land use estimates since 1982 with margins of error; start with the 2022 Summary Report tables.
- American Farmland Trust, Farms Under Threat data: Free maps and state reports from an advocacy organization; read the methods and note that low-density residential land is counted as converted.
Still being checked (7 items)
These points could not be fully confirmed against a primary source when this lesson was written and fact checked in November 2026. The text above states each one as uncertain.
- The cause of the 1.4 to 1.6 million acre drop in Idaho's land in farms between the 1992 and 1997 censuses; the published tables do not explain it.
- How much of Idaho's 230,767-acre drop in irrigated land from 2017 to 2022 reflects water not applied in 2022 rather than land permanently out of irrigation.
- Boise State's June 2026 news statement that the Treasure Valley lost 100,000 acres of agricultural land over two decades; we did not find the underlying table, years or boundary.
- Whether Idaho has any state-funded program that buys agricultural conservation easements; we did not find one.
- Acres enrolled in agricultural protection areas under the 2024 act, statewide or by county; not reported.
- Developed land and farmland conversion after 2021 by county or city (Annual NLCD 2022 to 2024 not analyzed for this lesson), and any conversion after 2022 in the Census of Agriculture.
- The release date of 2027 Census of Agriculture results; 'about 2029' is our expectation from the 2022 cycle, not an announced date.
Last verified November 17, 2026. General education, not legal, financial or real estate advice; every figure names its source and year in the Notes and Sources below. Data is revised: check the newest release before relying on any number.
Notes
- USDA NASS, 2022 Census of Agriculture, Idaho State and County Data (Volume 1, Part 12), Table 1, Historical Highlights: 2022 and Earlier Census Years (1997 shown adjusted and not adjusted for coverage), Idaho. Released February 2024 (read Nov. 17, 2026). Read it online. ↩
- USDA NASS, 1992 Census of Agriculture, Idaho State Data, Table 1, Historical Highlights: 1992 and Earlier Census Years (1978, 1982, 1987, 1992; not adjusted for coverage), via the NASS Census of Agriculture historical archive (read Nov. 17, 2026). Read it online. ↩
- USDA NASS, 2022 Census of Agriculture, United States Summary and State Data, Table 1, Historical Highlights: 2022 and Earlier Census Years, United States (read Nov. 17, 2026). Read it online. ↩
- USDA NASS, 1992 Census of Agriculture, United States Data, Table 1, Historical Highlights: 1992 and Earlier Census Years (1978 to 1992), via the NASS historical archive (read Nov. 17, 2026). Read it online. ↩
- USDA NASS, 2022 Census of Agriculture, Idaho county data, Table 8, Farms, Land in Farms, Value of Land and Buildings, and Land Use: 2022 and 2017 (farms, land in farms, approximate land area, proportion in farms, total cropland, value per acre), Idaho counties (read Nov. 17, 2026). Read it online. ↩
- USDA NASS, 1982 Census of Agriculture, Idaho County Data, Table 1, Farms, Land in Farms, and Land Use: 1982 and 1978 (farms, land in farms, total cropland), Ada, Canyon, Cassia, Gooding, Jerome, Kootenai, Lincoln, Minidoka and Twin Falls counties, via the NASS historical archive (read Nov. 17, 2026). Read it online. ↩
- USDA NRCS, 2022 National Resources Inventory Summary Report (February 2026), Table 1, Surface area of non-Federal and Federal land and water areas, by State and year, developed land in thousands of acres with margins of error: Idaho, Utah, Montana, Washington, Oregon, Nevada, Wyoming and U.S. total, 1982 to 2022 (read Nov. 17, 2026). Read it online. ↩
- USGS and Multi-Resolution Land Characteristics Consortium (MRLC), National Land Cover Database (NLCD) 2001, 2011 and 2021 Land Cover (CONUS), 30-meter, requested from the MRLC web coverage service (coverages NLCD_2001_Land_Cover_L48, NLCD_2011_Land_Cover_L48, NLCD_2021_Land_Cover_L48). County acreages by class are our own analysis (method in the lesson); class definitions from the NLCD legend (read Nov. 17, 2026). Read it online. ↩
- American Farmland Trust (advocacy organization), "Farms Under Threat: The State of the States" Idaho news release, Lori Sallet, May 20, 2020: Idaho lost nearly 70,000 acres 2001 to 2016; 26 percent Nationally Significant; low-density residential areas 122 times more likely to convert; hotspots Rathdrum Prairie and the Treasure and Magic Valleys (read Nov. 17, 2026). Read it online. ↩
- Boise State University, Human-Environment Systems, "Farmland Loss" project page: Idaho lost 68,823 acres of agricultural land to development between 2001 and 2016 (citing American Farmland Trust); researchers Sarah Halperin, Jodi Brandt, Jen Pierce, Jen Schneider, Matt Williamson and Rebecca Som Castellano (read Nov. 17, 2026). Read it online. ↩
- USDA NASS, "Notice of Intent To Seek Approval To Reinstate an Information Collection" for the 2027 Census of Agriculture, Federal Register Vol. 91, No. 9, Jan. 14, 2026 (FR Doc. 2026-00542); no release date stated (read Nov. 17, 2026). Read it online. ↩
- USDA NASS, 2022 Census of Agriculture, Idaho, Introduction: Farm Definition ("any place from which $1,000 or more of agricultural products were produced and sold"; used since 1974) and Data Comparability (dollar figures not adjusted for inflation) (read Nov. 17, 2026). Read it online. ↩
- USDA NASS, 2022 Census of Agriculture, Idaho, Appendix A (Census of Agriculture Methodology: principal county assignment; accounting for undercoverage, nonresponse and misclassification) and Appendix B (General Explanation: definitions of land in farms, total cropland and irrigated land) (read Nov. 17, 2026). Read it online. ↩
- USDA NASS, 2022 Census of Agriculture, Idaho county data, Table 10, Irrigation: 2022 and 2017 (irrigated land, land in irrigated farms), Idaho counties (read Nov. 17, 2026). Read it online. ↩
- U.S. Bureau of Labor Statistics, Consumer Price Index for All Urban Consumers (CPI-U), U.S. city average, all items, not seasonally adjusted, series CUUR0000SA0, annual averages: 1978 65.2, 1982 96.5, 1987 113.6, 1992 140.3, 1997 160.5, 2002 179.9, 2007 207.342, 2012 229.594, 2017 245.120, 2022 292.655, 2025 321.943; read from the BLS Public Data API and checked against FRED series CPIAUCNS (read Nov. 17, 2026). Read it online. ↩
- USDA NASS, 1992 Census of Agriculture, Idaho County Data, Table 1, County Summary Highlights: 1992 (farms, land in farms, total cropland, irrigated land), via the NASS historical archive (read Nov. 17, 2026). Read it online. ↩
- USDA NASS, 2002 Census of Agriculture, Idaho County Data, Table 8, Farms, Land in Farms, Value of Land and Buildings, and Land Use: 2002 and 1997, via the NASS historical archive (read Nov. 17, 2026). Read it online. ↩
- USDA NASS, 2012 Census of Agriculture, Idaho State and County Data, county Table 8 (Farms, Land in Farms, Value of Land and Buildings, and Land Use: 2012 and 2007) and Table 10 (Irrigation: 2012 and 2007), via the NASS historical archive (read Nov. 17, 2026). Read it online. ↩
- MRLC web coverage service capabilities listing, which includes Annual NLCD land cover for 2024 (layer Annual_NLCD_LndCov_2024_CU_C1V1) and Annual NLCD change summaries for 1985 to 2023 (read Nov. 17, 2026). Read it online. ↩
- U.S. Census Bureau, 2024 Cartographic Boundary File, counties, 1:500,000 (cb_2024_us_county_500k), used to clip NLCD rasters (read Nov. 17, 2026). Read it online. ↩
- U.S. Census Bureau, Intercensal Estimates of the Resident Population for Counties, 2000 to 2010 (co-est00int-tot), July 1, 2001 estimates for Idaho counties (read Nov. 17, 2026). Read it online. ↩
- U.S. Census Bureau, Vintage 2025 county population estimates (co-est2025-alldata): April 1, 2020 estimates base and July 1, 2021 and 2025 estimates, Idaho and Idaho counties (read Nov. 17, 2026). Read it online. ↩
- USDA NRCS, 2022 National Resources Inventory Summary Report (February 2026), Table 2, Land cover/use of non-Federal rural land, by State and year (cropland, CRP land), Idaho (read Nov. 17, 2026). Read it online. ↩
- USDA NRCS, 2022 National Resources Inventory Summary Report (February 2026), Table 14, Prime farmland, by land cover/use, by State and year, Idaho, 1982 to 2022, with margins of error (read Nov. 17, 2026). Read it online. ↩
- 7 CFR 657.5(a), definition of prime farmland, Electronic Code of Federal Regulations, current as of Nov. 2026 (read Nov. 17, 2026). Read it online. ↩
- American Farmland Trust with Conservation Science Partners (advocacy organization), Farms Under Threat: The State of the States, executive summary (2020): 11 million acres converted nationally 2001 to 2016, 4.1 million to urban and highly developed use and nearly 7 million to low-density residential use (read Nov. 17, 2026). Read it online. ↩
- Jenna Narducci, Christian Sprague, Jodi Brandt, Jen Schneider, Jillian Moroney, Michail Fragkias and Shawn Benner, "Projecting Urban Expansion in the Treasure Valley to 2100," white paper, MILES program, Boise State University, October 2017 (uses NLCD 2001 and 2011) (read Nov. 17, 2026). Read it online. ↩
- Boise State University News, "Fighting for Idaho's fields: how research and community voices are protecting farmland," June 8, 2026 (FARMPrES project; Treasure Valley "has lost 100,000 acres" over two decades; underlying table not cited) (read Nov. 17, 2026). Read it online. ↩
- Idaho Code 67-6537, Use of surface and ground water (Local Land Use Planning Act); added 1989, amended 2005 and 2025 (read Nov. 17, 2026). Read it online. ↩
- Idaho Code 31-3805, Delivery of water within subdivisions; added 2025, ch. 129, and amended 2026, ch. 2 (read Nov. 17, 2026). Read it online. ↩
- Idaho Code 42-222, Change in point of diversion, place of use, period of use or nature of use; most recently amended 2026, ch. 65 (read Nov. 17, 2026). Read it online. ↩
- Idaho Code 42-202B, Definitions (municipal provider, municipal purposes, planning horizon, reasonably anticipated future needs); most recently amended 2026, ch. 65 (read Nov. 17, 2026). Read it online. ↩
- Idaho Code 67-6526, Areas of city impact, as amended 2024, ch. 227 (read Nov. 17, 2026). Read it online. ↩
- Idaho Code 67-9702, Legislative intent, Agricultural Protection Area Act (Title 67, Chapter 97), added 2024, ch. 215 (read Nov. 17, 2026). Read it online. ↩
- Dustin W. Manwaring, "Pioneering Preservation: Idaho's New Agricultural Protection Act," Idaho State Bar blog, Aug. 30, 2024 (read Nov. 17, 2026). Read it online. ↩
- Cindy Zimmerman, "USDA releases 2022 Census of Agriculture data," AgWired, Feb. 13, 2024 (news report of the NASS release that day) (read Nov. 17, 2026). Read it online. ↩
- USDA NASS, "Submission for OMB Reinstatement; Comment Request," 2027 Census of Agriculture, Federal Register, May 29, 2026 (FR Doc. 2026-10761), estimated 3,889,950 respondents (read Nov. 17, 2026). Read it online. ↩
- Idaho Department of Water Resources, "Water Right Transfers Overview" (a transfer is a permanent or long-term change to point of diversion, place of use, period of use or nature of use; links to transfer application searches) (read Nov. 17, 2026). Read it online. ↩
- USDA NRCS, Web Soil Survey (free online soil maps and data for most U.S. counties, including farmland classification ratings) (read Nov. 17, 2026). Read it online. ↩
- Idaho Department of Water Resources, Newly Submitted Transfer Applications search (read Nov. 17, 2026). Read it online. ↩
Check yourself
1. How many acres of land in farms did the Census of Agriculture count in Idaho in 2022?
NASS 2022 Census of Agriculture, Idaho Table 1: 11,547,963 acres in farms in 2022. 14,699,100 was 1978; 5,623,516 is total cropland; 3,167,499 is irrigated land.
2. By how much did Idaho's land in farms change from 1978 to 2022?
From 14,699,100 acres (1992 report, Table 1) to 11,547,963 (2022 report, Table 1), a 21.4 percent decline. Down 13.3 percent is the U.S. figure.
3. Which Census of Agriculture rule explains why Minidoka County's land in farms rose 47 percent from 1982 to 2022 while its farm count fell by half?
NASS 2022 Appendix A: each report is assigned to a single principal county where most of its products are produced, so consolidation and leases move acres between counties.
4. What happened to Ada County's irrigated land between 1992 and 2022?
NASS 1992 county Table 1 (73,794 acres) and 2022 county Table 10 (35,479 acres): down 51.9 percent. 215,279 to 207,577 is Canyon County.
5. According to the 2022 National Resources Inventory, how much did Idaho's developed non-federal land grow from 1982 to 2022?
NRI 2022 Summary Report, Table 1: 562.9 to 990.5 thousand acres, up 76.0 percent. 65.5 percent is the U.S.; 150.0 percent is Nevada; 32.4 percent is Wyoming.
6. In our NLCD analysis, which county added the most developed land from 2001 to 2021?
Our analysis of USGS/MRLC NLCD 2001 and 2021: Ada about +18,300 acres, Kootenai +11,800, Canyon +10,900, Twin Falls +3,700, Jerome +1,200.
7. American Farmland Trust's Idaho figure for farmland lost to development from 2001 to 2016 is best described as:
AFT's May 20, 2020 Idaho release and its national executive summary count conversion to urban and to low-density residential use; AFT is an advocacy organization, and the figure (68,823 acres) is not an official statistic.
8. Which Idaho statute says IDWR shall not approve a change from agricultural use that would significantly affect the local agricultural base?
Idaho Code 42-222 governs water right transfers and contains that sentence. 67-6526 is areas of city impact, 31-3805 is water in subdivisions, 67-9702 is the Agricultural Protection Area Act's intent section.
9. Converted to 2025 dollars with CPI-U, what was Idaho's average farm land and building value per acre in 2022?
NASS 2022 Table 1 nominal $4,209 x (321.943 / 292.655) = $4,630 (our calculation with BLS CPI-U CUUR0000SA0). $4,209 is nominal; $3,846 is the U.S. nominal figure; $2,834 is 1978 in 2025 dollars.
10. When is the next Census of Agriculture, and when are its results likely?
NASS Federal Register notices of Jan. 14 and May 29, 2026 seek approval for the 2027 Census of Agriculture; based on the 2022 cycle (released Feb. 13, 2024), results are expected about early 2029. No release date has been announced.
Terms in this lesson
- Census of Agriculture
- USDA NASS count of every U.S. farm, taken for years ending in 2 and 7; the 2022 results were released in February 2024 and the next census covers 2027.
- Farm (census definition)
- Any place from which $1,000 or more of agricultural products were produced and sold, or normally would have been, during the census year; used since 1974 and never adjusted for inflation.
- Land in farms
- All land an operation owns or rents and uses, including cropland, pasture, private rangeland, woodland and farmsteads; excludes grazing on government permits paid per head.
- Total cropland
- Cropland harvested, cropland used only for pasture, failed or abandoned cropland, summer fallow, and idle cropland, as defined by NASS.
- Irrigated land
- All land watered by artificial or controlled means in the census year, each acre counted once.
- Principal county
- The county where most of an operation's products are produced; NASS tabulates a farm's whole report there unless a large operation is split.
- Coverage adjustment
- NASS's adjustment, begun with the 1997 census, for farms missed by the mail list and for nonresponse and misclassification; earlier censuses were published unadjusted.
- National Resources Inventory (NRI)
- USDA NRCS statistical survey of land use on non-federal land, by state, every five years from 1982 to 2022, with margins of error; no county figures.
- Developed land (NRI)
- Non-federal land in urban and built-up uses and rural transportation such as roads, as estimated by the NRI.
- National Land Cover Database (NLCD)
- USGS and MRLC classification of satellite imagery into land cover classes for each 30-meter square; developed classes are 21 to 24, pasture/hay 81, cultivated crops 82.
- Prime farmland
- Land with the best combination of physical and chemical characteristics for producing crops, available for those uses, generally with an adequate and dependable water supply (7 CFR 657.5); excludes urban built-up land and water.
- Area of city impact
- Land outside a city likely to be annexed within five years, set by county ordinance under Idaho Code 67-6526.
- Agricultural protection area
- Land an owner voluntarily enrolls, with county approval, under Idaho's 2024 Agricultural Protection Area Act (Idaho Code Title 67, Chapter 97).
- Water right transfer
- An IDWR-approved permanent or long-term change to a water right's point of diversion, place of use, period of use or nature of use (Idaho Code 42-222).
Sources
- USDA NASS, 2022 Census of Agriculture, Idaho State and County Data (2024-02-13) checked 2026-11
- USDA NASS, 2022 Census of Agriculture, United States Summary and State Data (2024-02-13) checked 2026-11
- USDA NASS, Census of Agriculture historical archive (1982, 1992, 2002 and 2012 Idaho and U.S. reports) (2026-11-17) checked 2026-11
- USDA NRCS, 2022 National Resources Inventory Summary Report (2026-02) checked 2026-11
- USGS and MRLC, National Land Cover Database (2026-11-17) checked 2026-11
- U.S. Census Bureau, county population estimates, Vintage 2025 and 2000 to 2010 intercensal (2026) checked 2026-11
- U.S. Bureau of Labor Statistics, CPI-U, series CUUR0000SA0 (2026-11-17) checked 2026-11
- Idaho Code 67-6537, 31-3805, 42-222, 42-202B, 67-6526 and Title 67, Chapter 97 (2026-11-17) checked 2026-11
- Idaho Department of Water Resources, Water Right Transfers (2026-11-17) checked 2026-11
- 7 CFR 657.5, prime and unique farmlands (2026-11-17) checked 2026-11
- American Farmland Trust, Farms Under Threat: The State of the States, Idaho release (advocacy) (2020-05-20) checked 2026-11
- Boise State University, Projecting Urban Expansion in the Treasure Valley to 2100 (white paper) (2017-10) checked 2026-11