Lesson 4 of 13 · about 55 minutes · Updated November 17, 2026
The Magic Valley Case Study: Jerome, Twin Falls, Kimberly, Gooding, Buhl and Hagerman
You'll be able to
- Describe how the Carey Act and the Twin Falls and North Side irrigation tracts shaped the six core Magic Valley towns.
- Compare population, housing units and building permits for Jerome, Twin Falls, Kimberly, Gooding, Buhl and Hagerman from 1980 to 2025 using census counts, Vintage 2025 estimates and the Census Building Permits Survey.
- Use LODES commuting data to tell a job center from a bedroom town with jobs per resident worker.
- Read ACS 5-year home values, rents and incomes for small towns with their margins of error, and avoid ranking towns whose ranges overlap.
- Convert house price and income changes to 2025 dollars with CPI-U and explain why prices outran incomes in Jerome and Twin Falls counties.
- Identify the public records (permit logs, annexation ordinances, area of impact maps, plats) that fill the gaps no agency table covers.
Start here: the short version
- Kimberly is the fast grower. Its population went from 4,625 (April 2020 estimates base) to an estimated 5,798 on July 1, 2025, up 25.4 percent, and its builders pulled permits for 502 new housing units from 2020 to 2025, equal to one third of the 1,502 homes the town had in the 2020 census.123
- Jerome added people faster than homes. Jerome County grew from 24,241 to an estimated 26,362 residents (2020 base to 2025), up 8.7 percent, while its housing stock grew 6.3 percent, from 8,569 to an estimated 9,107 units.45
- Jerome County permits: 94 units in 2020, 169 in 2021, 87 in 2022, 75 in 2023, 99 in 2024 and 143 in 2025, a total of 667. The peak year was still 2006, with 217.6
- The commute runs both ways. In 2024, 4,324 people lived and worked in Jerome County, 7,116 came in from other counties to work there, and 7,067 residents left the county to work, about 3,300 each way across the Snake River to and from Twin Falls County.7
- Prices outran inflation and income. From 2020 to 2025 the FHFA house price index rose 82.8 percent in Jerome County and 58.8 percent in Twin Falls County, against 24.4 percent for consumer prices. Jerome County's real per capita income in 2024 was 2.7 percent below 2020 after adjusting for inflation.8910
- Gooding, Buhl and Hagerman grew slowly. From 2020 to 2025 Gooding grew 4.1 percent, Buhl 5.2 percent and Hagerman 3.1 percent (estimates); Gooding permitted 54 new units in six years and Hagerman 8.12
- Jerome County is 42.3 percent Hispanic in the Vintage 2025 estimate, up from 38.0 percent in the 2020 base; the often-quoted 39.2 percent is the ACS 2020 to 2024 average, a different measure.1112
Data: Census Vintage 2025 population and county housing unit estimates (released 2026); 1980, 1990 and 2000 census counts from Census 2000 report PHC-3-14; 2010 and 2020 census redistricting files; ACS 2020 to 2024 5-year estimates; Census Building Permits Survey annual files through 2025; LEHD LODES version 8, 2023 and 2024; BEA CAINC1 per capita income through 2024; FHFA annual house price indexes through 2025 (updated March 31, 2026); 2022 Census of Agriculture; BLS CPI-U 2025 annual average (321.943); Idaho Department of Labor county profiles, October 2026. Checked Nov. 17, 2026. Agencies revise data; newer releases may differ.
Ask ten people in the Magic Valley how fast their town is growing and you will hear ten answers, most of them about traffic on Blue Lakes Boulevard, a new subdivision on the edge of town, or what a house down the street just sold for. Those are real experiences. This lesson puts numbers under them. It follows six towns that sit within about 50 miles of each other along the Snake River in south central Idaho: Jerome, Twin Falls, Kimberly, Gooding, Buhl and Hagerman. Together they show almost every kind of growth Idaho has seen since 1979: a regional city that keeps adding jobs and homes, a county seat that is filling in with dairy and food processing workers, a bedroom suburb growing faster than any town in the Treasure Valley, and three farm towns where the population has barely moved.
For each town you get a short history, population at every census since 1980 and the newest estimate, housing units, building permits since 2020, what can and cannot be said about annexation and subdivisions, where residents work, home values and rents with their margins of error, the farmland around the town, and the main employers. Then the six are compared side by side, the secondary towns (Wendell, Eden, Hazelton, Shoshone, Filer, Hansen, Rupert and Burley) get a data table, and the six counties of the region (Jerome, Twin Falls, Gooding, Lincoln, Minidoka and Cassia) are compared with Idaho and the nation. Along the way, the lesson rechecks the Jerome County figures that were used to plan this module, and shows where two of them were right for a different reason than people assume.
The lesson leans on other parts of this module. How to read a census count against an estimate, and why a building permit is not a finished house, is in How to Measure Growth Without Fooling Yourself. Farmland conversion across the Magic Valley and the Treasure Valley is in Farmland to Rooftops. The commuting data are explained in depth in Where People Work. Water, schools and roads as limits on growth are in Water, Schools and Roads, and the incentive deals behind the big Twin Falls food plants are in Economic Development and Housing Pressure. The big cities, including Twin Falls in a statewide ranking, are in The Big Cities Since 2020.
How the Magic Valley was built
None of these six towns would exist in its present form without irrigation. The Snake River Plain receives little rain, and before 1900 the land south and north of the river canyon was sagebrush. Three pieces of law and money changed that.
The Carey Act and Milner Dam
On Aug. 18, 1894, Congress passed the reclamation statute sponsored by Senator Joseph M. Carey, now called the Carey Act. It let states supervise irrigation projects that private companies would build and pay for, with settlers buying land and water rights from the company.1314 On June 25, 1900, I.B. Perrine posted a claim for 3,000 cubic feet per second of Snake River water at a site later named Milner, and on Oct. 12, 1900 the Idaho State Land Board approved an initial project of 248,667 acres. One of Perrine's partners, Filer, brought in two investors from Sharon, Pennsylvania, Frank H. Buhl and Peter L. Kimberly, who committed more than a million dollars. Milner Dam was completed on Nov. 15, 1904, raising the river 38 feet into new canals, and the diversion tunnels were closed on March 2, 1905.13 The towns of Buhl and Kimberly carry the names of those two investors.
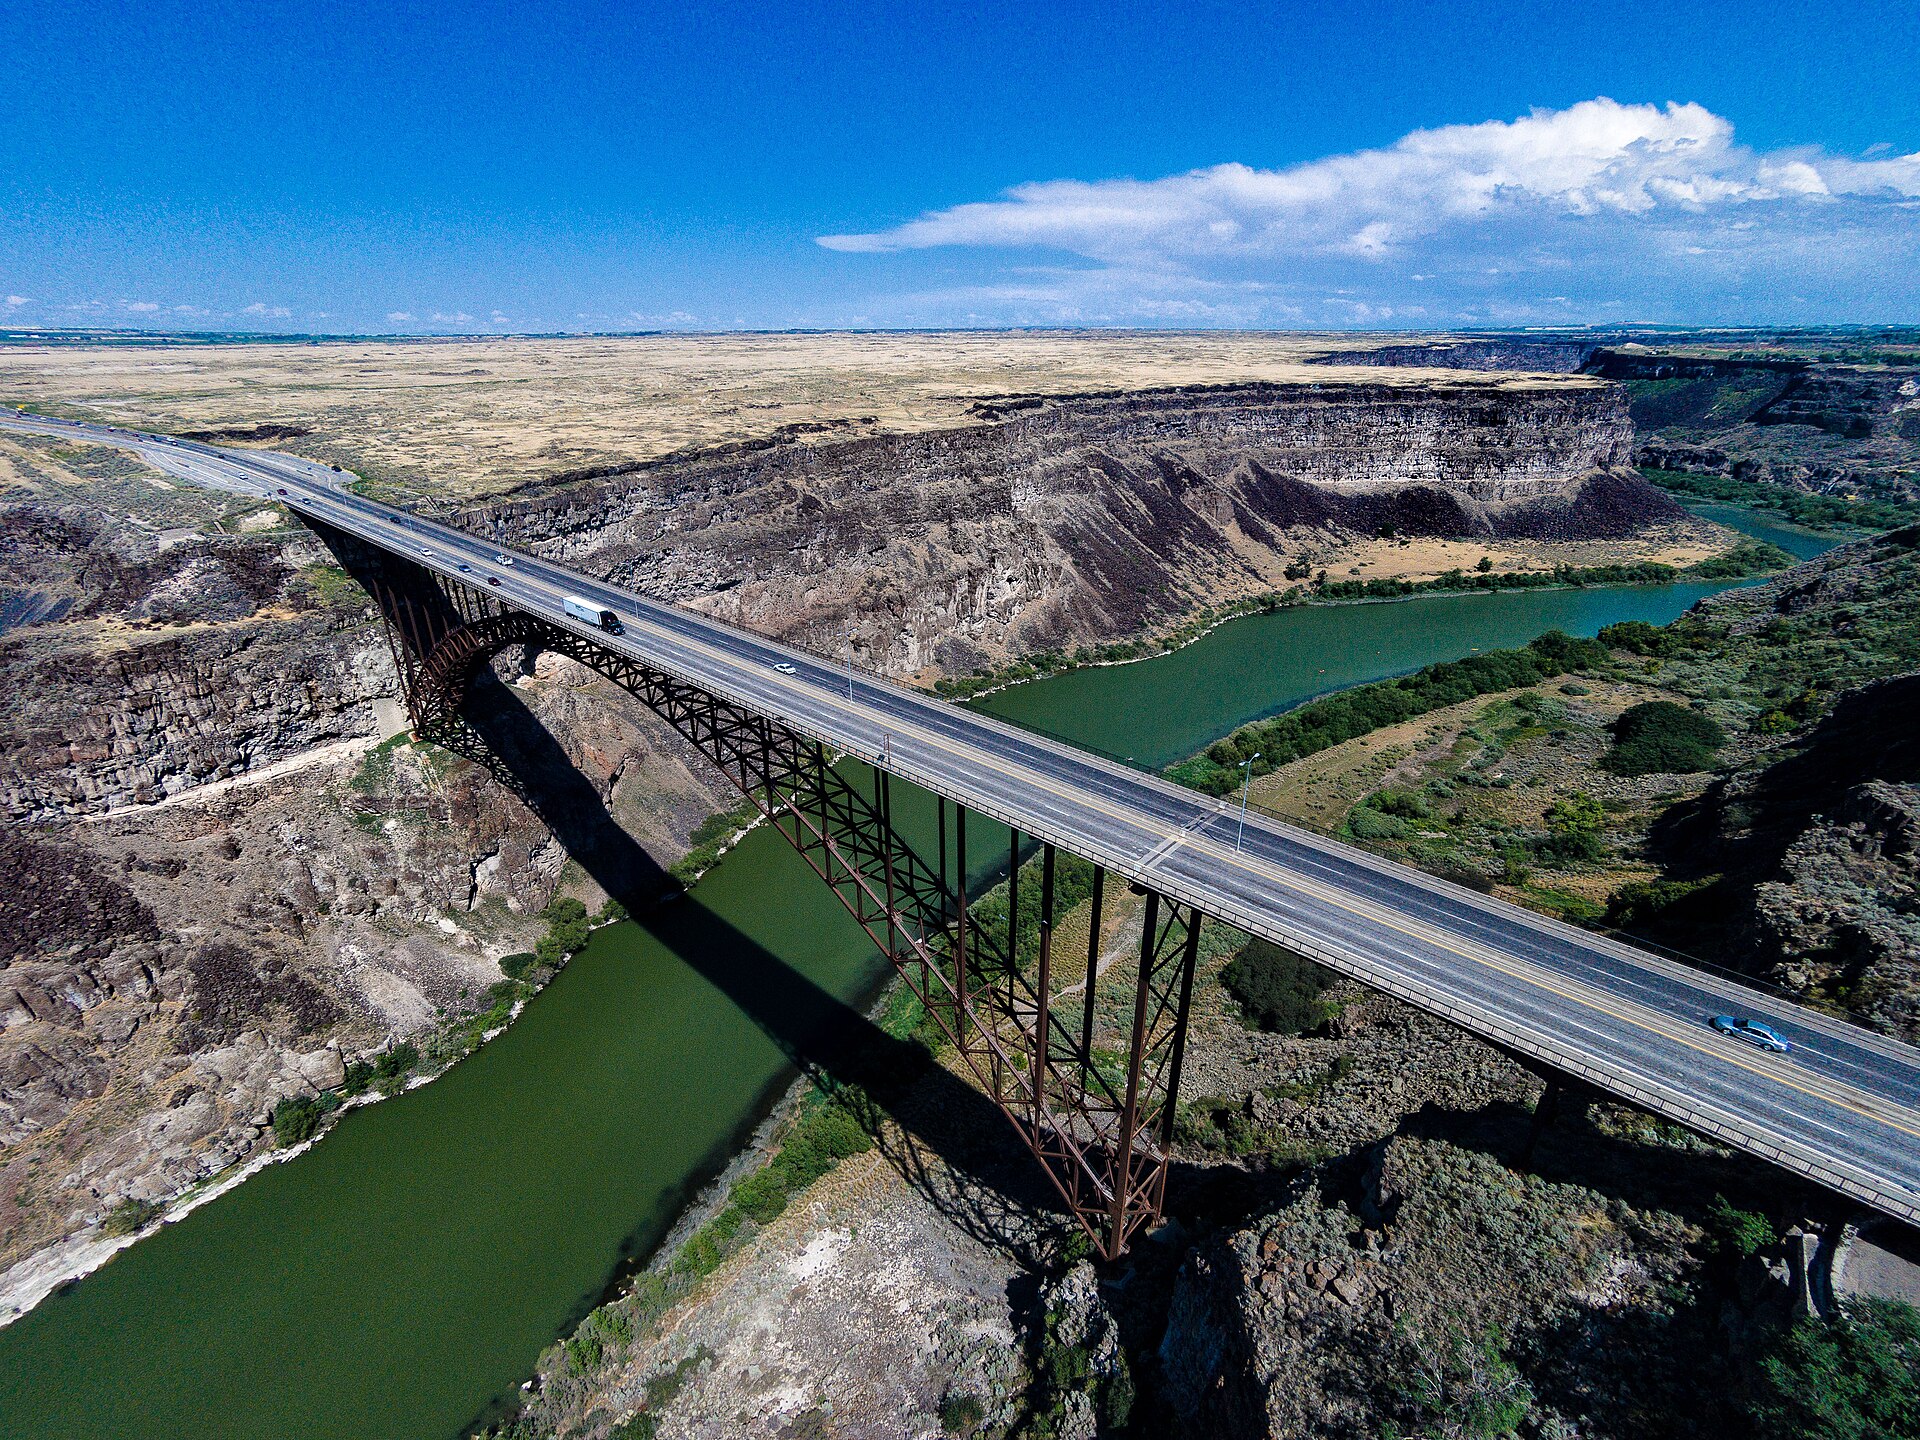
The project south of the river became the Twin Falls tract, served by the Twin Falls Canal Company. A second tract north of the river, served by the North Side Canal Company, opened a few years later, and its land drawing at Jerome was photographed on Sept. 30, 1907.15 Gooding sits on a third irrigated area to the northwest, and Hagerman lies in the Snake River canyon country west of the tracts, where springs from the Eastern Snake Plain Aquifer pour out of the canyon walls.
Why the history matters for the data
The irrigation history explains three things you will see in the numbers. First, the towns were laid out in a few years (1904 to 1908), so most of their original housing is a century old, and the median year a home was built is in the 1960s in Gooding and Buhl.16 Second, the land around each town is irrigated cropland and dairies with water rights attached, so growth at the edge of town converts farmland that cost a lot to create. Third, water is the limit. The canals and the aquifer were built for farms, and the same water now has to serve cities, dairies, food plants and fish farms. That subject has its own lesson, Water, Schools and Roads, and the water rights side is covered in Water Rights and Ag Land for Residents and Water, Land and Agriculture.
How to read the numbers in this lesson
Small towns are hard to measure. Every number in this lesson comes with its year, its geography and the table it came from, and five rules apply throughout.
- Counts and estimates are different things. The 1980, 1990, 2000, 2010 and 2020 figures are census counts. Everything after April 2020 is an estimate the Census Bureau builds from births, deaths, migration records and housing data. The Vintage 2025 series, released in 2026, gives July 1 estimates for 2020 through 2025 and an "estimates base" for April 1, 2020 that can differ by a few people from the census count because of boundary updates. Jerome, for example, has a 2020 census count of 12,349 and an estimates base of 12,348.31
- A building permit is not a house. The Census Bureau's Building Permits Survey counts housing units authorized by permits. Some are never built, and those that are may be finished a year or two later. The survey covers only places that issue permits, and when a city fails to report for some months, the Bureau fills the gap with an imputed number.17 That matters here: Jerome reported for 11 of 12 months in 2020 and 2024, and Hagerman did not report at all in 2024 or 2025.2
- ACS small-town figures are fuzzy. The American Community Survey (ACS) is a sample survey. For places under 65,000 people, which includes all six towns, the Census Bureau publishes only 5-year estimates, here pooled from 2020 to 2024. Every estimate comes with a margin of error (MOE) at a 90 percent confidence level, meaning the true value is likely, though not certain, to fall within plus or minus that amount.18 When an MOE is a large share of the estimate, treat rankings between towns as uncertain.
- One deflator. Dollar amounts from different years are converted to 2025 dollars with one index, the Bureau of Labor Statistics consumer price index for all urban consumers (CPI-U), U.S. city average, annual average. The 2025 annual average is 321.943. BLS computed it from 11 months because October 2025 was not collected during the federal shutdown.919
- Three levels. Each comparison shows the United States, Idaho and the town or county where the data exist, and says so when they do not.
How we figured it: inflation, growth rates and permits per 1,000
Real dollars: real value in 2025 dollars = nominal value x (CPI 2025 / CPI of the year). With CPI 2025 = 321.943, CPI 2024 = 313.689, CPI 2020 = 258.811 and CPI 2000 = 172.2, a 2000 dollar is worth 1.870 dollars in 2025 terms and a 2020 dollar is worth 1.244.9
Growth since 2020: (July 1, 2025 estimate / April 1, 2020 estimates base) minus 1. We use the estimates base, not the census count, so both ends come from the same Census series.
Permits per 1,000 residents per year: total units authorized 2020 to 2025 (six years), divided by 6, divided by the April 2020 estimates base, times 1,000. Kimberly: 502 / 6 / 4,625 x 1,000 = 18.1. These ratios are our own calculations.
Jobs per resident worker: jobs located in the town divided by employed people who live in the town, both from the same LODES year. Above 1.0 means a job center; below 1.0 means more residents leave to work than the town has jobs.
Jerome
History in brief
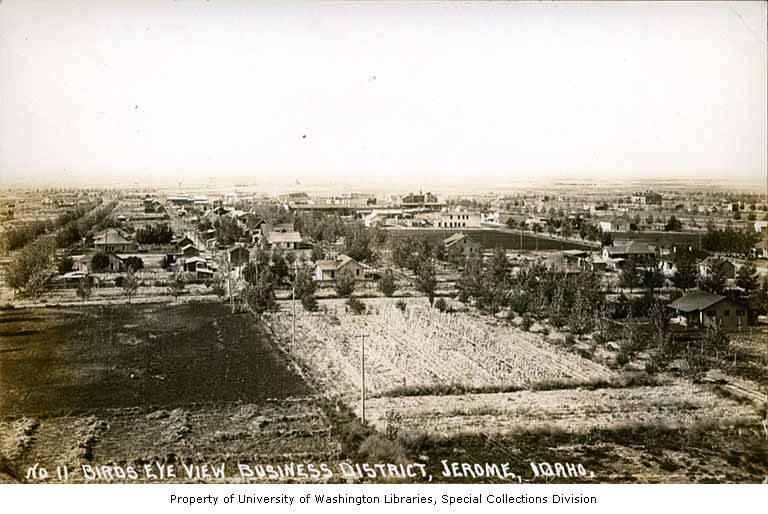
Jerome is the creation of the North Side tract. The irrigation company held a land drawing at the new townsite on Sept. 30, 1907, and the Idaho State Archives keeps a photograph of the crowd and the speakers' stand that day.15 The town grew as a farm service center for the land north of the Snake River canyon, and it became the seat of Jerome County. The county courthouse that stands today was built with a Works Progress Administration grant of $39,150 awarded in 1938 and was finished in the fall of 1939.20
For most of the 20th century Jerome was a small farm town that grew slowly. It lost people in the 1980s, as many Idaho farm towns did: the 1980 census counted 6,891 residents and the 1990 census 6,529.21 The turn came after 1990, when the dairy industry moved into south central Idaho in force, and cheese and milk processing plants followed the cows. Jerome's population has more than doubled since 1990 (6,529 counted in 1990, an estimated 13,731 in July 2025), and the share of residents who are Hispanic rose from 34.3 percent in the 2010 census to 45.0 percent in 2020.223

Population and housing, 1980 to 2025
| Year | Population | Housing units | People per housing unit | Source |
|---|---|---|---|---|
| 1980 (census) | 6,891 | 2,688 | 2.56 | PHC-3-14, Table 521 |
| 1990 (census) | 6,529 | 2,706 | 2.41 | PHC-3-14, Table 5 |
| 2000 (census) | 7,780 | 2,966 | 2.62 | PHC-3-14, Table 5 |
| 2010 (census) | 10,890 | 3,985 | 2.73 | 2010 PL 94-171, P1 and H122 |
| 2020 (census) | 12,349 | 4,275 | 2.89 | 2020 PL 94-171, P1 and H13 |
| 2025 (estimate, July 1) | 13,731 | not published for cities | n/a | Vintage 2025, SUB-EST20251 |
People per housing unit is our own division of population by all housing units, occupied or vacant. It rose in Jerome from 2.41 in 1990 to 2.89 in 2020, which means the town added people faster than it added homes. That pattern fits a young town (the ACS median age is 30.9, plus or minus 1.0 year, against 37.3 for Idaho) with many families with children.16 The Census Bureau does not publish housing unit estimates for cities after 2020, only for counties, so the 2025 housing count for the city has to be built from permits.
Building permits since 2020
Census Building Permits Survey data for the City of Jerome show 56 units authorized in 2020, 123 in 2021, 49 in 2022, 58 in 2023, 85 in 2024 and 116 in 2025, a six-year total of 487.2 Most were single-family homes. The exceptions were 2021 and 2023, when the city authorized seven buildings of three or four units each year, 28 units in each of those years. Before 2020 the city's best year in the survey's place files was 2007, with 138 units; the lowest was 2017, with 27.
Mayor Dave Davis told a State of Jerome event in February 2022 that the city issued a record 77 building permits in 2021.23 The Census figure for the same year is 123 units in 102 buildings. The two are not in conflict. A city counts permits, which can be one permit for a whole fourplex; the Census survey counts housing units and buildings, and the city's own count may cover a fiscal year or only certain permit types. When a news story and a federal table disagree, check what each one counts before deciding one is wrong.
The county as a whole authorized 667 units from 2020 to 2025 (94, 169, 87, 75, 99 and 143), so the City of Jerome accounted for about 73 percent of the county's new units.6 Jerome County's housing stock, by the Census Bureau's estimates, grew from 8,569 units in April 2020 to 9,107 in July 2025, a gain of 538.5 The gap between 667 units permitted and 538 units added is normal: estimates allow for homes not yet finished and for demolitions and mobile homes removed.
Annexation, city limits and subdivisions
No agency publishes "acres annexed" for Idaho cities. The best public yardstick is the land area the Census Bureau records for each city, which it updates each year through the Boundary and Annexation Survey that local governments answer.24 Jerome's land area was 3.20 square miles in 2000, 5.52 square miles in 2010, 5.66 square miles in 2020 and still 5.66 square miles in the 2025 Gazetteer file.212225 In other words, Jerome's big jump in city limits came in the 2000s; by the Census record its land area grew by only about 4 acres between the 2020 and 2025 files (our conversion of the square-meter figures). That does not prove no land was annexed. An annexation that the city did not report to the Census Bureau, or one too small to change the rounded area, would not show. The legal record is the annexation ordinance itself, which Idaho Code section 50-222 requires the city council to adopt after notice, hearings and a written annexation plan.26
Subdivision plats are recorded with the Jerome County recorder and approved by the city or county. Neither the city nor the county publishes a running total of lots platted since 2020 that we could find. Anyone who wants that number can request the plat list, or check the county recorder's index (see For reporters and advocates).
Jobs and commuting
By our tabulation of the Census Bureau's LODES files, 5,676 jobs were located in the City of Jerome in 2024 and 5,797 employed people lived there, almost exactly one job per resident worker (0.98).7 Only 1,326 people both lived and worked in the city; 4,350 came in from elsewhere and 4,471 residents left to work. More Jerome residents (1,695, or 29.2 percent) worked in unincorporated areas, where dairies, feedlots and several plants are located, than in any single city. Jerome itself came next (1,326, 22.9 percent), with the City of Twin Falls close behind (1,301, 22.4 percent).
At the county level, the Idaho Department of Labor's October 2026 profile reports the 2023 figures that were used to plan this module, and they check out exactly: 4,253 people lived and worked in Jerome County, 6,541 commuted in and 6,919 commuted out.27 Our recomputation from the same LODES files gives identical totals for 2023, and for 2024 gives 4,324, 7,116 and 7,067. The department lists the City of Twin Falls as the top city where Jerome County residents worked in 2023, with 2,593 workers or 23.2 percent; our count of Jerome County residents working in the City of Twin Falls from the LODES version 8 files gives 2,609 (23.4 percent), a small difference we could not explain (file version or boundary matching are likely causes). These are county-to-city figures. Measured county to county, 3,266 Jerome County residents, or 28.7 percent of the county's 11,391 resident workers, worked anywhere in Twin Falls County in 2024 (our LODES tabulation); measured city to city, the 2024 share is the 22.4 percent above.7 More on commuting is in Where People Work.
Home values and rents
The ACS 2020 to 2024 estimate of the median value of owner-occupied homes in Jerome is $225,400, plus or minus $11,126. The median gross rent (rent plus utilities) is $947, plus or minus $93, and the median household income is $66,894, plus or minus $7,280.282930 These are five-year averages of survey answers, so they lag the market: a home that sold in 2025 is not in this number, and a value reported in 2020 is. About 73 percent of occupied homes are owner-occupied (3,035 of 4,148, both estimates).16 For county price trends, which are more current, see the house price index section below.
Farmland around the town
Jerome County had 180,152 acres in farms in the 2022 Census of Agriculture, up from 171,643 in 2017; 139,509 acres were irrigated, up from 134,860; and the number of farms fell from 486 to 448.3132 The county's land area is 599.84 square miles, about 383,900 acres, so roughly 47 percent of it is in farms by this measure.21 Land in farms can rise even as towns grow, because the Ag Census counts whatever land farm operators report, including rented ground and rangeland, and one large operation reporting differently can move the total. For conversion of farmland to houses, irrigated cropland and satellite land cover are better measures; both are covered in Farmland to Rooftops.
Main employers
The Idaho Department of Labor lists Jerome County's largest employers in 2025 (only those that agreed to release employment ranges) as Millenkamp Cattle, Agropur, the Jerome Joint School District, Spears Manufacturing and Walmart (each 250 to 499 workers), followed by Idaho Milk Products, Double A Dairy, St. Luke's Jerome, Rite Stuff Foods and Hilex Poly.27 The list confirms the plan's lead: Jerome's economy is dairy, milk processing and food. Covered employment in the county (jobs under unemployment insurance) rose from 9,962 in 2015 to 12,305 in 2025, and manufacturing jobs from 1,569 to 2,651. The average annual wage in 2025 was $54,335.27 The plan also named Commercial Creamery as a Jerome employer; it does not appear in the department's 2025 top ten, so we could not confirm its size.
Twin Falls
History in brief
Twin Falls was laid out in 1904 as the main town of the Twin Falls tract, with a townsite plan that the Society of Architectural Historians credits to Emmanuel L. Masqueray and John Hayes.3314 Perrine promoted the tract at the 1904 Louisiana Purchase Exposition in St. Louis. The city became the seat of Twin Falls County and grew into the commercial center of south central Idaho, with the region's hospital, its community college, its regional retail and, after 2010, a cluster of large food plants.
Unlike Jerome, Twin Falls kept growing through the 1980s, though slowly: 26,209 people in 1980 and 27,634 in 1990 (the 1990 figure as revised by the Census Bureau after that census, marked "r" in its tables). It then added about 7,000 people in the 1990s, almost 10,000 in the 2000s and about 7,700 in the 2010s.21223 Two food plants mark the latest wave. Chobani opened its yogurt plant in 2012, expanded it in 2016 and announced in March 2025 a $500 million expansion expected to add at least 160 jobs.34 Clif Bar opened a $90 million, 300,000-square-foot bakery in 2016 with 214 employees, according to trade press accounts.35 The public incentives behind these projects are in Economic Development and Housing Pressure.

Population and housing, 1980 to 2025
| Year | Population | Housing units | People per housing unit | Land area (sq. mi.) |
|---|---|---|---|---|
| 1980 (census) | 26,209 | 10,573 | 2.48 | n/a |
| 1990 (census, revised) | 27,634 | 11,034 | 2.50 | n/a |
| 2000 (census) | 34,469 | 14,162 | 2.43 | 12.01 |
| 2010 (census) | 44,125 | 18,033 | 2.45 | 18.10 |
| 2020 (census) | 51,807 | 20,439 | 2.53 | 19.36 |
| 2025 (estimate) | 56,216 | n/a | n/a | 19.87 |
Sources: 1980 to 2000 from PHC-3-14, Table 5; 2010 and 2020 from the redistricting files; 2025 from Vintage 2025; land area from the 2010 redistricting file and the 2020 and 2025 Gazetteer files.21223125 Twin Falls grew 8.4 percent from the April 2020 base (51,846) to July 2025, adding an estimated 4,370 people.
Building permits since 2020
The City of Twin Falls authorized 681 housing units in 2020, 558 in 2021, 241 in 2022, 169 in 2023, 401 in 2024 and 267 in 2025, a total of 2,317, all with 12 months reported.2 The 2020 total was the city's highest in the place files since at least 2007; 2019 had 585. The mix was mostly single-family: 1,794 of the 2,317 units (77 percent) were in one-unit buildings, 172 in duplexes, 84 in three- and four-unit buildings and 267 in buildings of five or more units. The single biggest apartment year was 2022, with 100 units in seven buildings. The sharp drop in 2022 and 2023 matches what happened to mortgage rates and construction costs across Idaho; lesson 09, Prices and Rents vs. Inflation, covers that period.
The city's own building department counts differently. A Times-News report in 2018 described a record 3,544 permits of all kinds in the fiscal year ended Sept. 30, 2018, including 243 for new single-family homes and 27 new fourplexes.36 "Permits of all kinds" includes roofs, remodels and commercial work, which is why it is far larger than the Census count of new housing units.
Annexation and the area of city impact
Twin Falls' land area grew from 12.01 square miles in 2000 to 18.10 in 2010 and 19.36 in 2020, and to 19.87 in the 2025 Gazetteer, a gain of about 330 acres since 2020 by our conversion of the Gazetteer square-meter figures.2522 Annexed land is not the same as developed land: a city often annexes a farm field years before anyone builds on it, so this figure measures the legal city, not rooftops.
Every Idaho city also has an "area of city impact," a zone outside city limits where the city expects to grow and where the county agrees which plan and rules apply. Idaho Code section 67-6526 says the boundaries should consider expected growth and areas expected to get city sewer and water within five years, generally reach no more than two miles beyond city limits, and be reviewed at least every five years.37 A 2024 amendment required every city and county to re-establish these areas by Dec. 31, 2025, or lose them; Senate Bill 1403 carried that language as introduced.3738 Whether Twin Falls County and its cities met that deadline, and where the new lines fall, is a public record worth checking; we did not find a published map. The general rules of annexation and impact areas are covered in Idaho Planning and Zoning.
Jobs and commuting
Twin Falls is the region's job center. In 2024, 32,238 jobs were located in the city and 24,675 employed people lived there, 1.31 jobs per resident worker.7 More than half of working residents (13,732, or 55.7 percent) worked in the city. Another 18,506 people commuted in. The biggest identifiable sources were unincorporated areas (8,294), Jerome (1,301), Kimberly (1,042), Boise (633; LODES places each worker at the work site the employer reports, so some of these may be remote or traveling workers rather than daily commuters) and Buhl (589). Those flows explain why growth in Kimberly and Jerome is, in practical terms, growth of the Twin Falls job market.
Home values and rents
The ACS 2020 to 2024 median home value in Twin Falls is $321,300, plus or minus $11,241; median gross rent is $1,082, plus or minus $42; median household income is $61,205, plus or minus $2,722.282930 Twin Falls has the lowest homeownership rate of the six towns, 64.1 percent (13,353 owner-occupied of 20,828 occupied units, estimates), close to the national 65.2 percent.16 That reflects its role as the region's rental market: most of the area's apartment buildings are here.
Farmland around the city
Twin Falls County had 459,167 acres in farms in 2022, down from 468,809 in 2017, and 236,196 irrigated acres, down from 241,479. The number of farms fell from 1,211 to 1,169.3132 The 5,283-acre drop in irrigated land over five years is the clearer signal, since irrigated ground is what gets subdivided near the city. The Ag Census does not say which acres were lost or why; some went to houses and roads, some were dried up for water reasons, some changed how an operator reported them. Lesson 05 explains how to separate those causes with satellite data.
Main employers
The Idaho Department of Labor's 2025 list of Twin Falls County's largest employers starts with the St. Luke's hospital system (listed under the payroll name "Saint Luke's Jerome Ltd," 2,500 to 4,999 workers), followed by Chobani, the Twin Falls School District and the College of Southern Idaho (each 1,000 to 2,499), Lamb Weston (500 to 999), and Walmart, Amalgamated Sugar, the City of Twin Falls, Twin Falls County and Jayco (each 250 to 499).39 The plan for this module also named Clif Bar and Glanbia; neither appears in the department's 2025 top ten, which lists only employers that consent to release, so their current size is unconfirmed here. Covered employment in Twin Falls County rose from 36,415 in 2015 to 42,529 in 2025, education and health services from 8,466 to 10,846, and manufacturing from 4,077 to 5,135. The average annual wage was $50,099 in 2025.39
Kimberly
History in brief
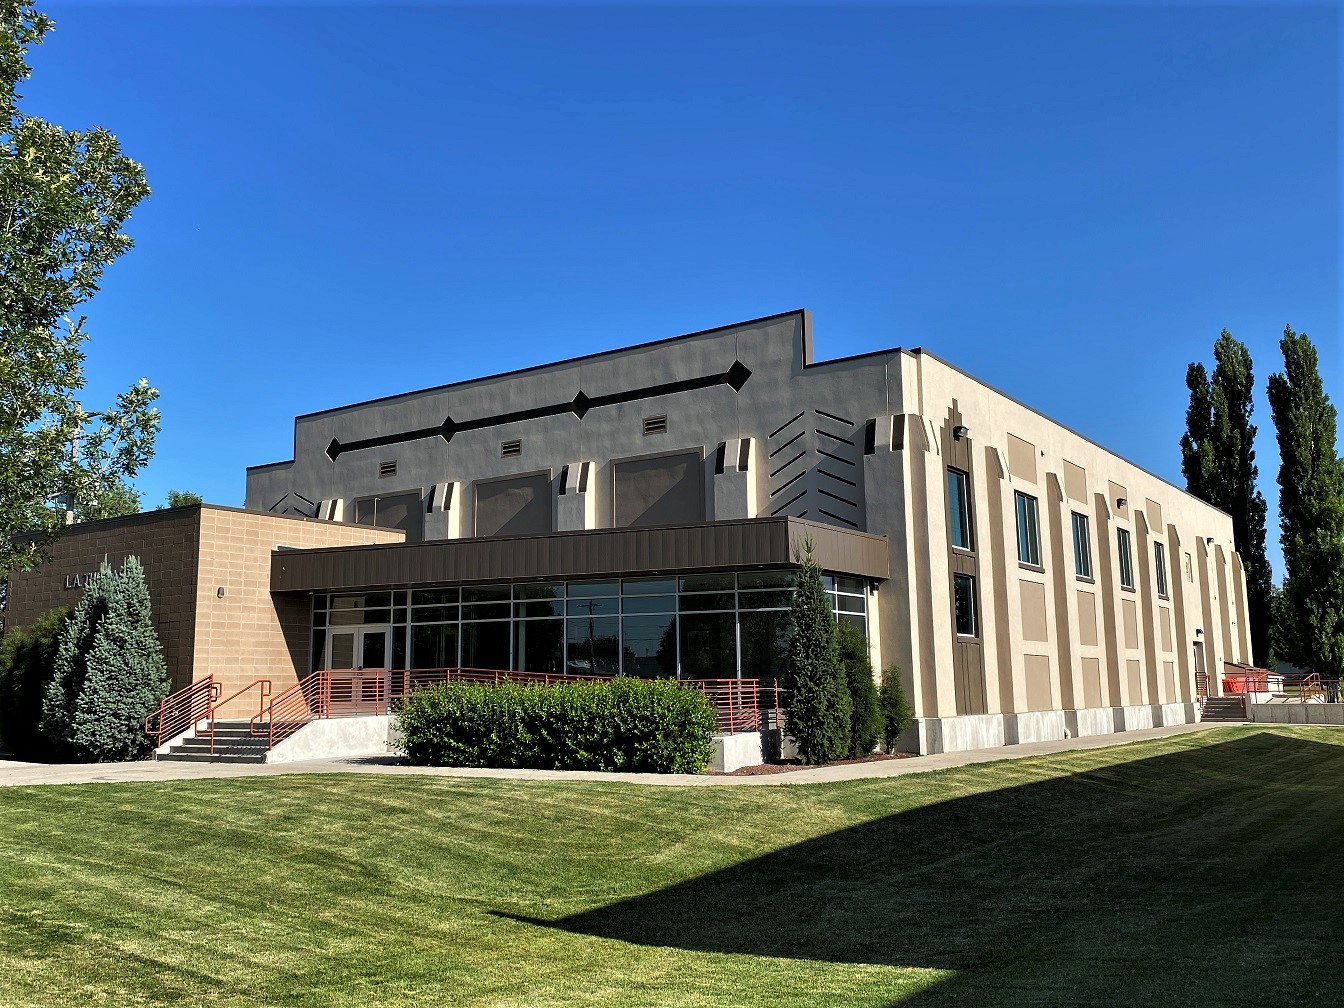
Kimberly sits just east of Twin Falls on the same irrigation tract. Its National Register nomination for the old high school says plainly: "The establishment and settlement of Kimberly occurred in 1905," as part of the Twin Falls project, and the town shares its name with Peter L. Kimberly, one of the Pennsylvania investors who financed Milner Dam.4013 Voters passed a $40,000 bond in March 1916 for a new high school, which opened around the start of 1917 and served as the high school until 1967.40
For 75 years Kimberly was a farm town of two to three thousand people. The 1980 census counted 2,307 and the 2000 census 2,614.21 Then it became the Twin Falls area's main bedroom suburb. It added 650 people in the 2000s and 1,362 in the 2010s, and the Census Bureau estimates it added another 1,173 between April 2020 and July 2025.2231 The Times-News reported in July 2025 that Kimberly was among Idaho's fastest growing cities, up 20 percent from 2020 to 2024.41

Population and housing
| Year | Population | Housing units | People per housing unit | Land area (sq. mi.) |
|---|---|---|---|---|
| 1980 (census) | 2,307 | 860 | 2.68 | n/a |
| 1990 (census) | 2,367 | 897 | 2.64 | n/a |
| 2000 (census) | 2,614 | 965 | 2.71 | 0.82 |
| 2010 (census) | 3,264 | 1,190 | 2.74 | 1.61 |
| 2020 (census) | 4,626 | 1,502 | 3.08 | 1.89 |
| 2025 (estimate) | 5,798 | n/a | n/a | 2.04 |
Sources as for the tables above.21223125 Kimberly's 3.08 people per housing unit in 2020 is the highest of the six towns, and only 51 of its 1,502 homes were vacant on census day.3 A town with almost no vacant homes and many large families is a town where new arrivals have to wait for new construction.
Permits, annexation and subdivisions
Kimberly authorized 72 units in 2020, 96 in 2021, 94 in 2022, 69 in 2023, 83 in 2024 and 88 in 2025, 502 in all, with 12 months reported every year.2 Of those, 458 were single-family homes, 32 were in duplexes and 12 were in two buildings of five or more units permitted in 2024. Before 2020 the place file shows Kimberly with 35 to 42 units a year from 2016 to 2019, but in 2017, 2018 and 2019 the city did not report and the Census Bureau imputed those figures, so the jump after 2020 may be partly a jump in reporting.
The town's land area grew from 0.82 square miles in 2000 to 1.61 in 2010, 1.89 in 2020 and 2.04 in the 2025 Gazetteer, about 93 acres added since 2020 by our conversion of the square-meter figures.2522 Kimberly has more than doubled its area since 2000, which tells you the new subdivisions are being built on annexed farmland at the edge of town. The plats themselves are recorded with Twin Falls County.
Jobs and commuting
Kimberly is the clearest bedroom town of the six. In 2024 it had 1,277 jobs and 2,279 employed residents, 0.56 jobs per resident worker. Only 197 residents (8.6 percent) worked in Kimberly; 1,042 (45.7 percent) worked in Twin Falls.7 The town's growth depends on the Twin Falls job market and on the short drive between them.
Home values and rents
The ACS 2020 to 2024 median home value in Kimberly is $339,400, plus or minus $41,828, and the median household income is $97,799, plus or minus $34,495.2830 Both are the highest point estimates among the six towns, and both are the least certain. The 90 percent range for income runs from about $63,300 to $132,300, which overlaps every other town except Gooding. Median gross rent is $1,127, plus or minus $46.29 About 83 percent of occupied homes are owner-occupied, and the median home was built in 1988, plus or minus 19 years, a margin so wide it shows how few sample households answer the question.16
The ACS also puts Kimberly's Hispanic share at 33.2 percent, plus or minus about 11 points.12 The 2020 census counted 843 Hispanic residents of 4,626, or 18.2 percent.3 When a sample estimate and a full count disagree this much, use the count for that year and treat the survey figure as noise.
Gooding
History in brief
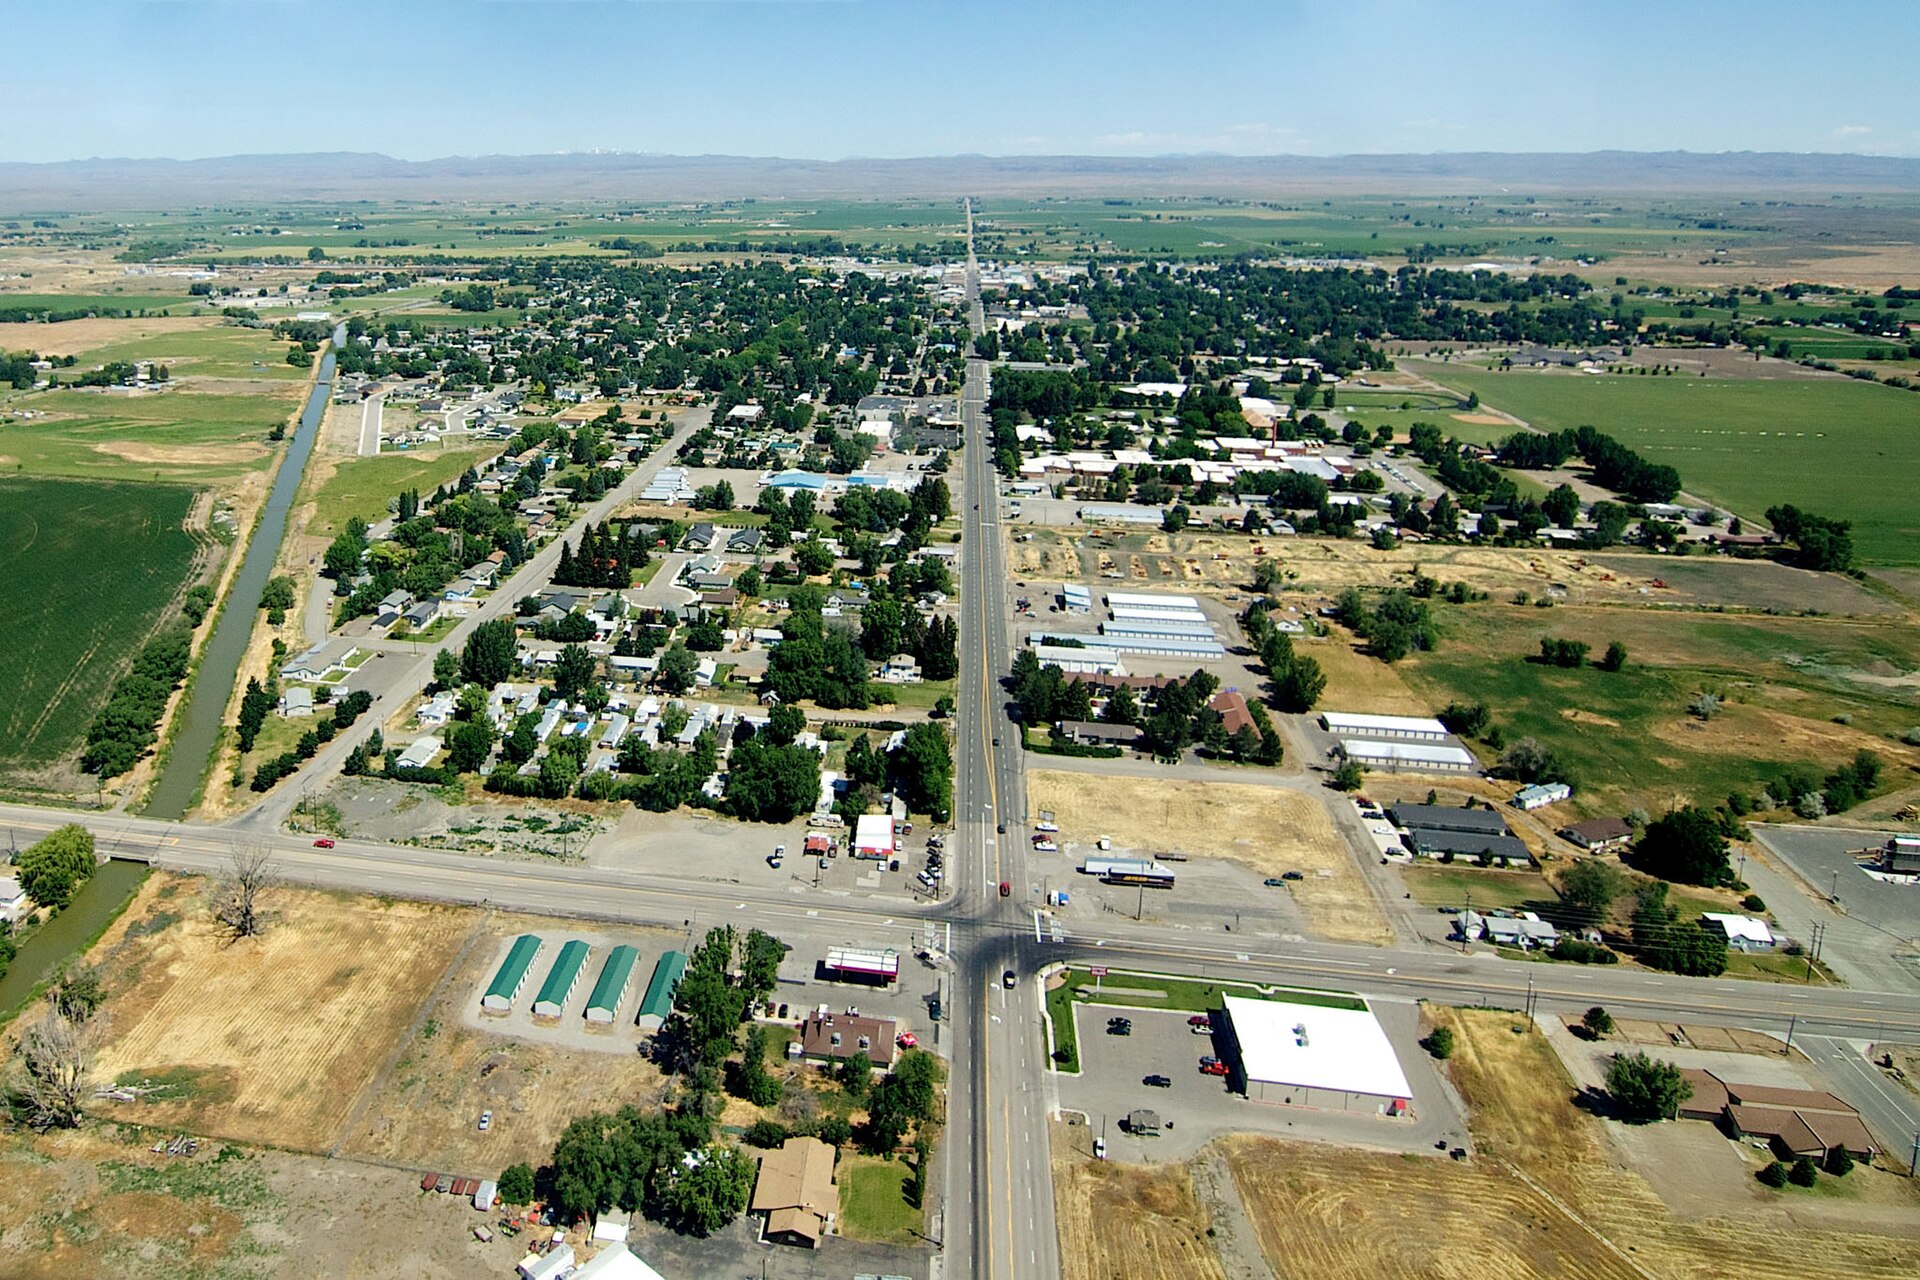
Gooding, the seat of Gooding County, "was platted in 1907 as a supply and shipping center for agricultural establishments," according to the National Register nomination for Kelly's Hotel, which was built in about 1907 or 1908 on Main Street.42 The town sits north of the Snake River canyon and serves farms and dairies across the county. Its population has moved little for half a century: 2,949 in 1980, 2,820 in 1990, 3,384 in 2000, 3,567 in 2010 and 3,707 in 2020.21223

Population, housing and permits
The Census Bureau estimates Gooding at 3,855 on July 1, 2025, up 4.1 percent from the April 2020 base of 3,703.1 Its housing count actually fell between censuses, from 1,537 units in 2010 to 1,488 in 2020, while occupied homes rose slightly (1,395 to 1,400) and vacant homes fell from 142 to 88.223 Demolition of old homes, conversion of buildings to other uses, or differences in how census takers counted mobile homes can all produce a drop like this; the tables do not say which.
Gooding authorized 7 units in 2020, 12 in 2021, 12 in 2022, 11 in 2023, 7 in 2024 and 5 in 2025, 54 in all, including two duplexes in 2021, one four-unit building in 2022 and two duplexes in 2024.2 That is 2.4 units per 1,000 residents per year, about half the national rate. The town's land area was 1.38 square miles in 2000, 1.48 in 2010 and 1.52 in both 2020 and 2025.212225
Jobs and commuting
Gooding has slightly more jobs than employed residents: 1,913 jobs and 1,743 resident workers in 2024, a ratio of 1.10.7 About a quarter of working residents (458, or 26.3 percent) worked in town. As a county seat with a hospital, schools and the county government, Gooding draws workers from the farms and smaller towns around it.
Home values, rents and income
Gooding has the lowest median home value of the six towns, $186,100, plus or minus $21,489, and the lowest median household income, $41,899, plus or minus $14,165. Median gross rent is $861, plus or minus $45.283029 About 61 percent of occupied homes are owner-occupied, and the median year built is 1961.16 By contrast, Gooding County's per capita personal income, as measured by the Bureau of Economic Analysis, was $70,962 in 2024, higher than Idaho's $62,323.10 BEA's measure counts all income received by county residents, including farm proprietors' income, divided by every resident; a few very large dairy operations can lift it while the typical household in town earns much less. The two measures answer different questions, and this module explains the difference in How to Measure Growth.
Farmland and employers
Gooding County had 212,600 acres in farms in 2022, up from 188,353 in 2017, and 132,731 irrigated acres, up from 121,765; the number of farms fell from 538 to 499.3132 The farms are getting bigger and fewer, the same pattern as Jerome County. The Idaho Department of Labor lists the county's largest 2025 employers as Nelson Ricks Creamery, North Canyon Medical Center, Magic Valley Growers and Bettencourt Dairies (250 to 499 workers each), then the Gooding and Wendell school districts, Riverence Provisions, Jesus Hurtado Dairy, Mustang Forestry and Gooding County (100 to 249 each).43 Covered employment in the county rose from 5,913 in 2015 to 6,647 in 2025.43
Buhl
History in brief
Buhl is the western town of the Twin Falls tract. The city dates itself to 1906, and it is named for Frank H. Buhl, the Pennsylvania investor who helped finance Milner Dam.4413 Its downtown keeps buildings from its first decades, including the Ramona Theater on Broadway Avenue South, designed by architect Burton Morse and opened on June 29, 1928.45 Buhl lost a little population in the 1980s (3,629 in 1980 to 3,516 in 1990) and has grown modestly since: 3,985 in 2000, 4,122 in 2010 and 4,558 in 2020.21223
Population, housing and permits
The July 2025 estimate is 4,801, up 5.2 percent from the April 2020 base of 4,564.1 Housing units numbered 1,576 in 1980, 1,549 in 1990, 1,689 in 2000, 1,766 in 2010 and 1,862 in 2020.21223 Buhl authorized 46 units in 2020, 25 in 2021, 18 in 2022, 13 in 2023, 30 in 2024 and 27 in 2025, 159 in all, almost all single-family; the exceptions were three duplexes and, in 2024, two buildings of three or four units.2 Its land area was 1.68 square miles in 2000, 1.82 in 2010 and 1.88 in 2020 and 2025.212225
Jobs, commuting, values and rents
Buhl had 1,175 jobs and 2,131 employed residents in 2024, a ratio of 0.55, about the same as Kimberly. Only 260 residents (12.2 percent) worked in Buhl; 589 (27.6 percent) worked in Twin Falls and 577 (27.1 percent) in unincorporated areas, which around Buhl is mostly farm country.7 The ACS 2020 to 2024 median home value is $247,500, plus or minus $31,082; median household income is $55,568, plus or minus $14,375; and the median gross rent is $1,148, plus or minus $393.283029 That rent margin is so wide that the true median could be anywhere from about $755 to $1,541. It is a reminder that town-level rent estimates from the ACS can only be used with great care.
Hagerman
History in brief
Hagerman lies in the Snake River canyon country of western Gooding County, near the springs that pour out of the canyon walls. A 2013 Times-News history says the town plat was not officially registered with the county until 1908, and that the name comes from a misspelling of Stanley Hageman, who died in 1898.46 That account is a newspaper summary rather than an official record. The town has always been small: 602 people in 1980, 600 in 1990, 656 in 2000, 872 in 2010 and 968 in 2020.21223
Population, housing and permits
The July 2025 estimate is 994, up 3.1 percent from the April 2020 base of 964.1 Hagerman had 492 housing units in 2020, 46 of them vacant, and only 1.97 people per housing unit, the lowest of the six towns.3 The ACS median age is 51.7, plus or minus 3.1 years, against 37.3 for Idaho, and 85 percent of occupied homes are owner-occupied.16 Those three facts together describe a retirement and second-home town more than a commuter town.
Building permit data for Hagerman are thin. The survey shows 3 units in 2020, 5 in 2021 and none in 2022 or 2023. In 2024 and 2025 the city did not report at all, and the Census file shows zero, which is an imputed value, not a report of no construction.217 Anyone who needs the real number should ask the city for its permit log. The land area was 0.33 square miles in 2000, 0.58 in 2010 and 0.59 in 2020 and 2025.212225
Jobs, values and a lesson in margins of error
In 2024 Hagerman had 340 jobs and 506 employed residents (ratio 0.67); just 26 residents worked in town, and the most common city destinations were Twin Falls (81), Wendell (44) and Jerome (44); more (158) worked in unincorporated areas.7 The ACS 2020 to 2024 median home value is $194,700, plus or minus $34,404, and the median household income $59,808, plus or minus $22,330.2830
Hagerman also shows why small-town survey numbers need care. The ACS estimate of Hagerman's total population over 2020 to 2024 is 1,276, plus or minus 265.12 The Census Bureau's own population estimates put the town at 964 to 1,000 in those years.1 The survey's population total for a small place is a weighted sample result, while the population estimates are built from administrative records and are the official figure. Use the population estimates for "how many people," and use the ACS for rates and medians, with their margins.
The six towns side by side
Put the six towns in one table and three groups appear. Twin Falls is the job center. Kimberly and Jerome are growing fast, Kimberly as a commuter suburb and Jerome as a working town with its own plants and dairies. Gooding, Buhl and Hagerman are growing slowly, each at about the national rate since 2020 and well below Idaho's.
| Measure | Jerome | Twin Falls | Kimberly | Gooding | Buhl | Hagerman |
|---|---|---|---|---|---|---|
| Population, 1980 census | 6,891 | 26,209 | 2,307 | 2,949 | 3,629 | 602 |
| Population, 1990 census | 6,529 | 27,634 | 2,367 | 2,820 | 3,516 | 600 |
| Population, 2000 census | 7,780 | 34,469 | 2,614 | 3,384 | 3,985 | 656 |
| Population, 2010 census | 10,890 | 44,125 | 3,264 | 3,567 | 4,122 | 872 |
| Population, 2020 census | 12,349 | 51,807 | 4,626 | 3,707 | 4,558 | 968 |
| Population, July 2025 estimate | 13,731 | 56,216 | 5,798 | 3,855 | 4,801 | 994 |
| Change, April 2020 base to 2025 | +11.2% | +8.4% | +25.4% | +4.1% | +5.2% | +3.1% |
| Housing units, 2020 census | 4,275 | 20,439 | 1,502 | 1,488 | 1,862 | 492 |
| Units permitted, 2020 to 2025 | 487 | 2,317 | 502 | 54 | 159 | 8 (2024 and 2025 not reported) |
| Units permitted as share of 2020 housing | 11.4% | 11.3% | 33.4% | 3.6% | 8.5% | 1.6% |
| Land area, 2000 / 2025 (sq. mi.) | 3.20 / 5.66 | 12.01 / 19.87 | 0.82 / 2.04 | 1.38 / 1.52 | 1.68 / 1.88 | 0.33 / 0.59 |
| Hispanic share, 2010 / 2020 census | 34.3% / 45.0% | 13.1% / 17.3% | 12.5% / 18.2% | 22.9% / 29.1% | 24.9% / 28.0% | 13.8% / 7.6% |
| Jobs per employed resident, 2024 | 0.98 | 1.31 | 0.56 | 1.10 | 0.55 | 0.67 |
| Residents working in own town, 2024 | 22.9% | 55.7% | 8.6% | 26.3% | 12.2% | 5.1% |
| Median home value, ACS 2020 to 2024 | $225,400 ±11,126 | $321,300 ±11,241 | $339,400 ±41,828 | $186,100 ±21,489 | $247,500 ±31,082 | $194,700 ±34,404 |
| Median gross rent, ACS 2020 to 2024 | $947 ±93 | $1,082 ±42 | $1,127 ±46 | $861 ±45 | $1,148 ±393 | $991 ±137 |
| Median household income, ACS 2020 to 2024 | $66,894 ±7,280 | $61,205 ±2,722 | $97,799 ±34,495 | $41,899 ±14,165 | $55,568 ±14,375 | $59,808 ±22,330 |
| Owner-occupied share, ACS 2020 to 2024 | 73.2% | 64.1% | 82.7% | 60.7% | 76.3% | 85.4% |
| Median age, ACS 2020 to 2024 | 30.9 | 35.1 | 32.2 | 32.6 | 34.2 | 51.7 |
Sources: census counts from PHC-3-14 Table 5 and the 2010 and 2020 redistricting files; estimates from Vintage 2025; permits from the Census Building Permits Survey place files; land area from PHC-3-14 and the 2025 Gazetteer; commuting from our tabulation of LODES 8, 2024; ACS 2020 to 2024 5-year tables B25077, B25064, B19013, B25003 and B01002. Shares, ratios and percent changes are our own calculations.212231225728293016
Measured from 1980, Twin Falls (up 114.5 percent to 2025) and Kimberly (up 151.3 percent) grew as fast as Idaho as a whole (115.0 percent) or faster, and Jerome (99.3 percent) came close. All three grew about twice as fast as the United States (50.9 percent). Gooding (30.7 percent) and Buhl (32.3 percent) trailed the nation.214714 Remember that the 1980 figures are census counts and the 2025 figures are estimates; a few hundred people either way would not change the picture, but do not quote these percentages to a decimal point as if they were exact.
The permit rate chart compares new housing authorizations with each place's size. Idaho as a whole authorized 113,061 units from 2020 to 2025, 10.2 per 1,000 residents per year, more than twice the national rate of 4.7.64 Most of that was in the Treasure Valley: Canyon County ran at 16.1 and Ada County at 12.3. Twin Falls County, at 7.2, built faster than the nation but well below the state; Jerome County, at 4.6, ran at about the national rate. Kimberly, at 18.1 units per 1,000 residents per year, was faster than Canyon County. These are our own calculations, and they measure authorizations, not finished homes.
Secondary towns of the region
Eight more towns round out the Magic Valley picture. They appear here as data only; several are small enough that their ACS estimates carry margins of error larger than a quarter of the estimate.
| Town (county) | 2000 census | 2010 census | 2020 census | July 2025 estimate | Change from 2020 base | Housing units, 2020 | Units permitted 2020 to 2025 | Median value, ACS 2020 to 2024 |
|---|---|---|---|---|---|---|---|---|
| Wendell (Gooding) | 2,338 | 2,782 | 2,917 | 3,090 | +6.1% | 1,052 | 53 | $242,100 ±30,822 |
| Eden (Jerome) | 411 | 405 | 393 | 406 | +3.0% | 160 | 1 | $175,900 ±29,825 |
| Hazelton (Jerome) | 687 | 753 | 803 | 827 | +2.4% | 307 | 1 | $221,300 ±26,840 |
| Shoshone (Lincoln) | 1,398 | 1,461 | 1,653 | 1,767 | +6.6% | 645 | 14 | $229,800 ±29,135 |
| Filer (Twin Falls) | 1,620 | 2,508 | 2,738 | 3,026 | +8.7% | 1,067 | 126 | $247,500 ±37,739 |
| Hansen (Twin Falls) | 970 | 1,144 | 1,086 | 1,109 | +1.6% | 437 | 12 | $220,200 ±17,757 |
| Rupert (Minidoka) | 5,645 | 5,554 | 6,082 | 6,460 | +7.0% | 2,352 | 371 | $205,200 ±27,624 |
| Burley (Cassia and Minidoka) | 9,316 | 10,345 | 11,704 | 12,409 | +5.9% | 4,293 | 312 | $231,300 ±15,926 |
Sources: PHC-3-14 Table 5; 2010 and 2020 redistricting files; Vintage 2025 estimates; Census BPS place files; ACS table B25077.212231228 Census imputed some years for towns that did not report: Burley in 2020 and 2021, Rupert and Eden in 2020, Hansen in 2021 and 2022. Filer stands out: it grew 55 percent in the 2000s and its land area went from 0.80 square miles in 2000 to 1.47 square miles in the 2025 Gazetteer, with most of that (from 1.02 square miles in 2020) added since the last census.2125 Rupert's 371 units since 2020 make it the busiest builder among these eight.
The six counties compared with Idaho and the nation
Counties are the level where the most data exist: housing unit estimates, income, house price indexes, farm data and the components of population change. Three of the six (Jerome, Twin Falls and Gooding) contain the core towns; Lincoln, Minidoka and Cassia complete the region.
| Measure | United States | Idaho | Jerome | Twin Falls | Gooding | Lincoln | Minidoka | Cassia |
|---|---|---|---|---|---|---|---|---|
| Population, April 2020 base | 331,516,113 | 1,839,123 | 24,241 | 90,050 | 15,600 | 5,129 | 21,584 | 24,688 |
| Population, July 2025 estimate | 341,784,857 | 2,029,733 | 26,362 | 97,539 | 16,446 | 5,603 | 22,911 | 26,397 |
| Change | +3.1% | +10.4% | +8.7% | +8.3% | +5.4% | +9.2% | +6.1% | +6.9% |
| Housing units, April 2020 base | 140,498,736 | 751,859 | 8,569 | 34,693 | 6,030 | 1,948 | 8,206 | 8,850 |
| Housing units, July 2025 estimate | 148,260,882 | 849,155 | 9,107 | 38,164 | 6,288 | 2,024 | 9,138 | 9,469 |
| Change | +5.5% | +12.9% | +6.3% | +10.0% | +4.3% | +3.9% | +11.4% | +7.0% |
| Units permitted, 2020 to 2025 | 9,309,209 | 113,061 | 667 | 3,917 | 274 | 86 | 1,083 | 741 |
| Per 1,000 residents per year | 4.7 | 10.2 | 4.6 | 7.2 | 2.9 | 2.8 | 8.4 | 5.0 |
| Per capita personal income, 2024 (BEA) | $73,204 | $62,323 | $49,185 | $53,767 | $70,962 | $50,400 | $52,408 | $59,434 |
| Hispanic share, July 2025 estimate | n/a here | 14.8% | 42.3% | 19.6% | 34.3% | 33.5% | 38.3% | 32.3% |
| Median home value, ACS 2020 to 2024 | $332,700 ±236 | $418,600 ±2,550 | $271,800 ±16,969 | $337,900 ±8,873 | $250,900 ±25,286 | $255,600 ±15,905 | $262,600 ±17,480 | $284,600 ±17,279 |
| Live and work in county, 2024 | n/a | n/a | 4,324 | 26,967 | 3,175 | 885 | 4,352 | 5,986 |
| Commute in, 2024 | n/a | n/a | 7,116 | 14,671 | 3,595 | 1,081 | 5,257 | 6,414 |
| Commute out, 2024 | n/a | n/a | 7,067 | 15,308 | 3,961 | 1,816 | 5,960 | 5,754 |
Sources: Vintage 2025 county population and housing unit estimates; national and state housing unit estimates; Census BPS county files (U.S. and Idaho are sums of counties); BEA CAINC1; Vintage 2025 county characteristics (Idaho's share is our sum of its counties); ACS table B25077; our tabulation of LODES 8. Percent changes and rates are our calculations.454861011287
Checking the Jerome County figures in the plan
The October 2026 plan for this module listed five Jerome County figures to re-verify. Here is what the agency tables show.
- Permits 2020 to 2025 (94, 169, 87, 75, 99, 143; 2006 peak of 217): confirmed exactly in the Census BPS annual county files.6
- 2023 commuting (4,253 live and work, 6,541 in, 6,919 out): confirmed exactly, both in the Idaho Department of Labor profile and in our own LODES tabulation.277 The newer 2024 figures are 4,324, 7,116 and 7,067.
- Top work destination Twin Falls, 23.2 percent: matches the department's profile (2,593 Jerome County residents working in the City of Twin Falls, 2023); our LODES 8 count of the same county-to-city flow is 2,609, or 23.4 percent. County to county in 2024 the share is 28.7 percent, and city to city 22.4 percent; say which one you mean.277
- 2024 per capita income of $49,185, against $62,323 for Idaho: confirmed in BEA table CAINC1.10
- 2025 population of 26,362, 39.2 percent Hispanic, median age 34.0: the population is the Vintage 2025 estimate for July 1, 2025. The 39.2 percent and the median age of 34.0 come from the ACS 2020 to 2024 5-year estimates (9,873 Hispanic of 25,173), as the Idaho Department of Labor profile reports.41227 They describe the 2020 to 2024 average, not 2025. The Census Bureau's Vintage 2025 county characteristics put Jerome County's Hispanic share at 42.3 percent on July 1, 2025 (11,148 of 26,362).11 Use 42.3 percent with "July 2025 estimate"; use 39.2 percent only with "ACS 2020 to 2024."
Where the growth comes from
The Census Bureau splits each county's population change into natural increase (births minus deaths), net international migration and net domestic migration (moves from other U.S. counties). Summed over the five estimate years from July 2020 to July 2025, the six-county picture is lopsided.4
| July 2020 to July 2025 | Natural increase | Net international migration | Net domestic migration |
|---|---|---|---|
| Idaho | 26,681 | 24,088 | 130,972 |
| Twin Falls County | 826 | 1,264 | 5,118 |
| Jerome County | 698 | 930 | 459 |
| Gooding County | 179 | 506 | 118 |
Our sums of the annual components for 2021 through 2025 in file CO-EST2025-ALLDATA; the components do not add exactly to the population change because the Bureau also carries a small residual. Idaho's growth since 2020 came mostly from people moving in from other states. Twin Falls County followed that pattern. Jerome and Gooding counties did not: in the Bureau's estimates, more of their growth came from births and from immigration than from Americans moving in from elsewhere, and Jerome County's net domestic migration was negative in 2023 and 2025. Domestic migration estimates for small counties are uncertain, but the pattern fits what the employer lists show: dairies and processing plants that hire many immigrant workers. Who moves into Idaho and from where is the subject of Who Is Moving In and From Where.
Prices and incomes against inflation
The ACS medians in the town sections are five-year averages that lag the market. For year-by-year price change, the best public series for small counties is the Federal Housing Finance Agency (FHFA) all-transactions house price index. It tracks repeat sales and refinance appraisals of the same homes with mortgages bought or guaranteed by Fannie Mae and Freddie Mac, so it measures price change for a constant set of houses rather than the price of whatever happened to sell. FHFA publishes annual indexes for counties and calls them "developmental," meaning small samples can make a single year jump. Here they are rebased so 2000 equals 100.849
| FHFA index (2000 = 100) | 2006 | 2012 | 2020 | 2022 | 2025 | Change 2020 to 2025 (nominal) | Change 2020 to 2025 (real, 2025 dollars) | Change 2000 to 2025 (real) |
|---|---|---|---|---|---|---|---|---|
| United States | 153.71 | 121.75 | 175.75 | 226.53 | 258.34 | +47.0% | +18.2% | +38.2% |
| Idaho | 158.45 | 123.62 | 233.95 | 345.15 | 366.34 | +56.6% | +25.9% | +95.9% |
| Twin Falls County | 142.92 | 123.35 | 208.75 | 317.55 | 331.44 | +58.8% | +27.6% | +77.3% |
| Jerome County | 139.89 | 119.76 | 201.79 | 315.13 | 368.80 | +82.8% | +46.9% | +97.3% |
| Gooding County | 136.13 | 115.00 | 194.78 | 292.93 | 325.10 | +66.9% | +34.2% | +73.9% |
| CPI-U (2000 = 100) | 117.1 | 133.3 | 150.3 | 170.0 | 187.0 | +24.4% | n/a | n/a |
Sources: FHFA annual all-transactions indexes, "HPI with 2000 base," last updated March 31, 2026; BLS CPI-U annual averages rebased by us to 2000. Real changes are our calculation.8499
How we figured it: real house price change
Real change = (index in the later year / CPI in the later year) divided by (index in the earlier year / CPI in the earlier year), minus 1. For Jerome County from 2020 to 2025: (368.80 / 321.943) / (201.79 / 258.811) = 1.1455 / 0.7797 = 1.469, a real gain of 46.9 percent. From 2000 to 2025: 368.80 / (321.943 / 172.2) = 368.80 / 1.870 = 197.3, a real gain of 97.3 percent. Because FHFA indexes have a base of 100, the CPI step is the only conversion needed. This is our calculation; FHFA publishes only nominal indexes.
Three things stand out. First, the Magic Valley counties had a smaller bubble before 2008 than Idaho as a whole, and a smaller fall. Idaho's index fell 22.0 percent from 2006 to 2012 and the nation's 20.8 percent; Twin Falls County's fell 13.7 percent and Jerome County's 14.4 percent.849 Second, almost all of the gap between house prices and inflation opened in two years. Jerome County's index rose 25.2 percent in 2021 and 24.7 percent in 2022; Twin Falls County's rose 22.8 and 23.8 percent. Third, the counties then split. Twin Falls County's index moved only 0.8 percent in 2025, while Jerome County's jumped 15.5 percent. A one-year jump of that size in a developmental county index can reflect a small or unusual set of sales, so wait for another year before reading it as a trend. The statewide picture, with more series, is in Prices and Rents vs. Inflation.
Income against inflation
Prices only matter against what people earn. The Bureau of Economic Analysis publishes per capita personal income for every county every year. In 2025 dollars, Jerome County's per capita income was $43,092 in 2000, $51,876 in 2020 and $50,479 in 2024, a real gain of 17.1 percent over 24 years and a real loss of 2.7 percent since 2020.109 Idaho's rose 36.1 percent in real terms from 2000 to 2024 and the nation's 31.5 percent. Twin Falls County's rose 30.2 percent. All figures here, including Idaho's $62,323 for 2024, come from BEA's county file released before BEA's Sept. 30, 2026 revision of state income; the revised state series puts Idaho's 2024 per capita income at $61,345 (and 2025 at $64,200), and BEA has scheduled revised county figures, with 2025, for Dec. 2, 2026. We keep the county-file vintage so counties, Idaho and the nation compare on the same basis.
| Per capita personal income | 2000 (nominal) | 2020 (nominal) | 2024 (nominal) | 2024 in 2025 dollars | Real change 2000 to 2024 | Real change 2020 to 2024 |
|---|---|---|---|---|---|---|
| United States | $30,551 | $59,151 | $73,204 | $75,130 | +31.5% | +2.1% |
| Idaho | $25,139 | $49,724 | $62,323 | $63,963 | +36.1% | +3.4% |
| Twin Falls County | $22,668 | $43,724 | $53,767 | $55,182 | +30.2% | +1.5% |
| Jerome County | $23,049 | $41,703 | $49,185 | $50,479 | +17.1% | -2.7% |
| Gooding County | $23,729 | $63,425 | $70,962 | $72,829 | +64.2% | -7.7% |
Source: BEA CAINC1, line 3; real values and changes are our calculation with CPI-U.109 Put the two tables together and the squeeze is plain. From 2020 to 2025, Jerome County home prices rose about 47 percent faster than inflation, while per capita income through 2024 fell slightly behind it. In Twin Falls County, prices rose about 28 percent in real terms and income about 1.5 percent. A rough affordability gauge from the ACS gives the same message: the ratio of median home value to median household income is 3.4 in Jerome and 5.2 in Twin Falls, compared with 4.1 for the United States and 5.4 for Idaho, all from 2020 to 2024 estimates (our calculation; small-town margins of error make the town ratios approximate).2830
Acres, rooftops and farmland: what can be measured
Residents often ask how many acres each town has covered since 2020. No agency publishes that number for any Idaho city. Four public sources come close, and each measures something different.
- City land area (Census Gazetteer and Boundary and Annexation Survey). This measures the legal city, including farm fields that have been annexed but not built on. By our conversion of Gazetteer land area, Twin Falls added about 330 acres between the 2020 and 2025 files, Kimberly about 93, Filer about 286 and Jerome about 4; Gooding, Buhl and Hagerman added essentially none.2524
- Annexation ordinances. Each annexation requires a city ordinance, published and recorded, with a legal description of the land.26 Adding up the acreage in the ordinances gives the most exact figure, but it has to be done by hand from city records.
- Satellite land cover (USGS Annual NLCD). The U.S. Geological Survey's Annual National Land Cover Database classifies every 30-meter square of the country each year, including four "developed" classes, with Collection 1.0 covering 1985 through 2023.50 Counting the squares that changed from cultivated crops or pasture to developed inside and around each town gives a measure of rooftops and pavement. We did not run that analysis for this lesson; Farmland to Rooftops explains the method.
- Census of Agriculture. County land in farms and irrigated land every five years, most recently 2022. The 2022 census shows irrigated land down 5,283 acres in Twin Falls County since 2017, and up 4,649 in Jerome County and 10,966 in Gooding County.32 County totals cannot show what happened at the edge of a particular town.
Lacking a published figure, a rough sense of scale helps. Kimberly's 502 units since 2020, mostly single-family homes, at typical small-town lot sizes of four to five homes per acre plus streets, would cover something on the order of 100 to 150 acres. That is an illustration of scale, not a measurement, and the lot size is an assumption, not data. The Gazetteer shows Kimberly's legal area grew about 93 acres in the same period, which is in the same range.
Pictures, Numbers and Infographics
The table below gathers the lesson's key numbers at three levels: the United States, Idaho and the Magic Valley place in question. Where no matching figure exists for a level, the cell says so.
| Measure | United States | Idaho | Magic Valley place | Year or period | Source |
|---|---|---|---|---|---|
| Population change, April 2020 base to July 2025 | +3.1% | +10.4% | Kimberly +25.4%; Jerome +11.2%; Twin Falls +8.4%; Gooding +4.1% | 2020 to 2025 (estimates) | Vintage 202541 |
| Population change, 1980 census to July 2025 | +50.9% | +115.0% | Kimberly +151.3%; Twin Falls +114.5%; Jerome +99.3% | 1980 to 2025 | PHC-3-14; apportionment table; Vintage 20252147 |
| Housing unit change | +5.5% | +12.9% | Jerome County +6.3%; Twin Falls County +10.0% | April 2020 to July 2025 (estimates) | CO-EST2025-HU, NST-EST2025-HU548 |
| Units permitted per 1,000 residents per year | 4.7 | 10.2 | Kimberly 18.1; Twin Falls 7.4; Jerome 6.6; Jerome County 4.6 | 2020 to 2025 | Census BPS; our calculation26 |
| Jerome County units permitted | n/a | n/a | 667 (peak year 2006: 217) | 2020 to 2025 | Census BPS county files6 |
| Jerome County commuting | n/a | n/a | 4,324 live and work; 7,116 in; 7,067 out | 2024 | LODES 8, our tabulation7 |
| House price index change, nominal | +47.0% | +56.6% | Jerome County +82.8%; Twin Falls County +58.8% | 2020 to 2025 | FHFA annual indexes849 |
| Consumer prices (CPI-U) | +24.4% | no state index | no local index | 2020 to 2025 | BLS CPI-U9 |
| Per capita personal income | $73,204 | $62,323 | Jerome County $49,185; Twin Falls County $53,767 | 2024 | BEA CAINC110 |
| Median home value | $332,700 ±236 | $418,600 ±2,550 | Twin Falls $321,300 ±11,241; Jerome $225,400 ±11,126 | ACS 2020 to 2024 | B2507728 |
| Median gross rent | $1,413 ±2 | $1,238 ±16 | Twin Falls $1,082 ±42; Jerome $947 ±93 | ACS 2020 to 2024 | B2506429 |
| Median household income | $80,734 ±166 | $77,800 ±743 | Twin Falls $61,205 ±2,722; Jerome $66,894 ±7,280 | ACS 2020 to 2024 | B1901330 |
| Hispanic share | not computed here | 14.8% | Jerome County 42.3% | July 2025 (estimate) | CC-EST2025-ALLDATA-1611 |
| Irrigated land | see Ag Census U.S. tables | 3,167,499 acres | Twin Falls County 236,196; Jerome County 139,509; Gooding County 132,731 | 2022 | Census of Agriculture, Table 1032 |
For the Mountain West neighbors, the same ACS 2020 to 2024 table puts the median home value at $489,400 in Utah, $564,600 in Washington, $477,600 in Oregon, $435,400 in Nevada, $375,800 in Montana and $309,700 in Wyoming.28 Every Magic Valley town and county in this lesson is below Utah, Washington, Oregon, Nevada and Montana; only Twin Falls, Kimberly and Twin Falls County are above Wyoming.
Common mistakes
These are the errors that most often turn a true local fact into a false growth story. None is invented for this lesson; each appears in the data above.
- Quoting an ACS average as a current-year figure. The 39.2 percent Hispanic share and median age of 34.0 for Jerome County are ACS 2020 to 2024 averages that the Idaho Department of Labor profile labels as "2024 5-Year ACS." Placed next to a 2025 population figure without the label, they read as 2025 facts. The Vintage 2025 estimate for July 2025 is 42.3 percent.2711
- Treating a city's permit count and the Census unit count as the same thing. Jerome's "record 77 building permits" in 2021 and the Census figure of 123 units in 102 buildings describe the same boom in different units.232 Twin Falls' record 3,544 permits in fiscal 2018 included every kind of permit, of which 243 were new single-family homes.36
- Reading an imputed zero as "no building." Hagerman shows zero units in 2024 and 2025 because it did not report; the zero is the Census Bureau's fill-in, not a count.217 The same caution applies to Kimberly's 2017 to 2019 figures.
- Using the ACS total population for a small town. The ACS 2020 to 2024 total for Hagerman, 1,276, is about 280 people above the official estimates. For "how many people," use the population estimates.121
- Ranking towns on estimates whose margins overlap. Saying Kimberly has "the highest home values in the Magic Valley" ignores a margin of error of $41,828 that overlaps Twin Falls.28 Saying Buhl's rents are higher than Twin Falls' ignores a $393 margin.29
- Comparing nominal prices with real incomes, or the other way around. Jerome County home prices rose 82.8 percent from 2020 to 2025 in nominal terms; in 2025 dollars the gain was 46.9 percent. Either is honest if labeled; mixing a nominal price change with a real income change is not.89
- Confusing land annexed with land developed. Gazetteer land area measures the legal city. A 300-acre annexation can sit as a farm field for a decade.
- Using county data for a town. Gooding County's per capita income ($70,962 in 2024) is above Idaho's, while the City of Gooding's median household income ($41,899, ACS 2020 to 2024) is the lowest of the six towns. Both are correct and they measure different things for different places.1030
What we know, what we don't, and what the data can show
What we know
- Kimberly grew an estimated 25.4 percent from 2020 to 2025 and permitted new housing equal to a third of its 2020 stock, faster than the rate in Ada or Canyon County.
- Jerome County's permits were 94, 169, 87, 75, 99 and 143 from 2020 to 2025; the 2006 peak of 217 has not been matched.
- About 3,300 workers in each direction live in one of Jerome and Twin Falls counties and hold a job in the other (2024 LODES, all jobs; a job count, not a daily traffic count).
- House prices in Jerome and Twin Falls counties rose much faster than consumer prices and per capita income from 2020 to 2025.
- Gooding, Buhl and Hagerman grew more slowly than Idaho and, since 2020, about as fast as or slightly faster than the nation.
- Jerome and Gooding counties grew mainly through births and international migration since 2020; Twin Falls County through domestic moves.
What we don't know
- How many acres each town has covered with homes and pavement since 2020; no agency publishes it.
- How many lots have been platted and how many permitted homes are finished and occupied.
- Hagerman's actual permits in 2024 and 2025.
- Whether Twin Falls, Jerome and Gooding counties re-established their cities' areas of impact by the Dec. 31, 2025 deadline, and where the lines now fall.
- Town-level price and rent trends for Kimberly, Gooding, Buhl and Hagerman; the samples are too small for a reliable annual series.
- How much farmland around each town was converted after the 2022 Census of Agriculture; the 2027 census will be the next county count.
What the data can show
- Whether permits keep pace with population: compare Census BPS place files with Vintage population estimates each spring.
- Which towns are becoming bedroom communities: track jobs per resident worker in LODES (OnTheMap) each year a new file is released.51
- Where farmland is turning into subdivisions: Annual NLCD developed classes around each town, checked against annexation ordinances.
- Whether prices outrun incomes: FHFA county indexes against BEA CAINC1 per capita income, both in 2025 dollars.
- Whether big plant expansions are followed by price and rent jumps: compare the Chobani 2025 expansion timeline with the FHFA Twin Falls and Jerome county indexes and the next ACS releases.
Questions people ask
Which Magic Valley town is growing fastest?
Among the six core towns, Kimberly, by both measures: population (an estimated 25.4 percent from April 2020 to July 2025) and new housing (502 units permitted, 18.1 per 1,000 residents per year).12 Among the secondary towns, Filer grew 8.7 percent and Rupert 7.0 percent. In raw numbers, Twin Falls added the most people, an estimated 4,370.
Is Jerome a bedroom community for Twin Falls?
Not by the numbers. A bedroom town has many fewer jobs than working residents. The City of Jerome had 0.98 jobs per employed resident in 2024, and Jerome County draws slightly more workers in from Twin Falls County (3,288) than it sends there (3,266).7 Kimberly (0.56) and Buhl (0.55) fit the bedroom description far better.
Why does my city's permit report give a different number from this lesson?
Cities count permits of every kind, often by fiscal year, and one permit can cover several units. The Census Building Permits Survey counts new housing units by calendar year and imputes months a city does not report.17 Both are correct for what they measure. When you quote one, say which.
How much farmland is being lost around these towns?
The county numbers are known through 2022: Twin Falls County lost 5,283 irrigated acres from 2017 to 2022, while Jerome and Gooding counties gained irrigated acres.32 Town-edge losses are not published. Annexation ordinances and satellite land cover can measure them, as explained in Farmland to Rooftops.
Are home prices in the Magic Valley still rising?
In 2025 the FHFA annual index rose 0.8 percent in Twin Falls County, 15.5 percent in Jerome County and 4.0 percent in Gooding County, against 2.3 percent for Idaho and 2.9 percent for the nation.849 One year of a developmental county index is not a trend. This lesson does not forecast prices or advise anyone on when to buy, sell or rent.
Where can I get these numbers for my own town?
All of them are free. Population estimates and the decennial counts are on census.gov and data.census.gov; permit files are on the Census construction site; commuting is in OnTheMap; ACS tables are on data.census.gov; house price indexes are on fhfa.gov; county income is on bea.gov; farm data are in the Census of Agriculture. Lesson 13, Build Your Own Growth Profile, walks through each download step by step, and Data Journalism and Basic Statistics covers the statistics.
Will the 2030 census change these numbers?
Yes. Every estimate since 2020 will be replaced by a new count in 2030, and the Census Bureau will then revise the 2020s series to fit. Each new vintage of estimates also revises earlier years, which is why this lesson names Vintage 2025 with every estimate.1
Hard questions
Should Magic Valley towns slow annexation to protect farmland?
The case for slowing: irrigated farmland around these towns was created at great cost a century ago, it carries water rights the region depends on, and once covered it does not come back. Farm families and dairy operators say scattered subdivisions raise land prices, bring complaints about smells and traffic, and make farming harder. The case against: people are arriving and being born here; if towns do not annex and extend sewer and water, growth moves into the county on septic systems and private wells, using more land per home, or prices rise further for the families already here. Builders and new residents point out that more than a thousand people who work in Twin Falls now live in Kimberly, close to their jobs. What the evidence shows: the county Ag Census numbers do not show a collapse of irrigated land in Jerome or Gooding counties through 2022, and Twin Falls County's loss of 5,283 irrigated acres in five years is about 2 percent.32 The town-edge losses are real but unmeasured. Idaho law already ties areas of city impact to where sewer and water are expected within five years, which gives counties and cities a planning tool if they choose to use it.37
Do new food plants cause the housing squeeze, or follow it?
One view: each large plant expansion (Chobani's 2012 opening and 2025 expansion, the 2016 Clif Bar bakery, the cheese and milk plants near Jerome) brings hundreds of jobs without bringing housing, so workers bid up rents and commute from farther away.3435 The other view: the jobs pay above many local wages (manufacturing averaged $66,259 in Twin Falls County in 2025), and the price surge of 2020 to 2022 hit every Idaho county, including places with no new plants.3949 What the evidence shows: house prices in Twin Falls and Jerome counties rose about as fast as Idaho's, or a little faster, from 2020 to 2022 (52 and 56 percent against 48 percent, nominal), which points mostly to statewide forces. Jerome County's 2025 jump and its falling real per capita income are worth watching. Lesson 12 sets out the incentive records needed to test this town by town.
Should Jerome build more apartments or more single-family homes?
For more multifamily: Jerome's household size is rising (2.89 people per housing unit in 2020), its median age is under 31, and its median household income ($66,894, ACS 2020 to 2024) is well below Idaho's ($77,800); apartments and townhomes use less land and water per household. For single-family: most families in a farm town want yards and ownership, Jerome's ownership rate (73 percent) is above the national rate, and single-family homes build long-term wealth. What the evidence shows: from 2020 to 2025 the city permitted 487 units, of which 56 were in three- and four-unit buildings and none in larger buildings.2 The choice of what gets built is set largely by zoning and by what builders can finance; see Idaho Planning and Zoning. Part B of this series, coming later, covers zoning, building and property tax.
Are Gooding, Buhl and Hagerman falling behind, or holding steady?
One reading: towns that add a handful of homes a year lose young families to Twin Falls and Kimberly, their schools shrink and their main streets struggle. Another reading: they are growing at about the national rate, their homes remain the most affordable in the region, and many residents prefer that pace. What the evidence shows: all three grew from 2020 to 2025 (estimates), Gooding has more jobs than working residents, and Hagerman's older population and low household size suggest it is drawing retirees. Whether that is decline or stability depends on what residents want, which data cannot answer.
For reporters and advocates
Records that exist and how to get them. Idaho's public records law, Idaho Code Title 74, Chapter 1, covers city and county records; module 47, Idaho Public Records Requests, explains how to ask. Records worth requesting in the Magic Valley:
- Building permit logs from the cities of Jerome, Twin Falls, Kimberly, Gooding, Buhl and Hagerman, by type and month, for 2020 to date. Compare them with the Census place files.2
- Annexation ordinances adopted since 2020, with their legal descriptions and acreage, and the annexation plans Idaho Code 50-222 requires.26
- Area of city impact ordinances and maps adopted or re-established by Jerome, Twin Falls and Gooding counties under the Dec. 31, 2025 deadline in Idaho Code 67-6526.37
- Subdivision plats and preliminary plat approvals from the city and county planning offices, and recorded plats from the county recorders.
- Long-range land use plans and future land use maps for each city and county (see Local Government for who adopts them).
- Water and sewer capacity studies and connection counts; growth is often limited by treatment plant capacity before it is limited by land. Water rights and well permits are with the Idaho Department of Water Resources (lesson 10).
- School district enrollment reports for the Jerome, Twin Falls, Kimberly, Gooding, Buhl and Hagerman districts, and any bond or levy plans (see School Boards, Budgets, Bonds and Levies).
- Economic development agreements and job reports for large employers, including state Tax Reimbursement Incentive agreements and any urban renewal plans (see Urban Renewal and Economic Development and lesson 12).
Questions to ask officials. How many lots are platted but unbuilt? How many years of sewer and water capacity remain at the current permit pace? What did the city report to the Census Boundary and Annexation Survey last year? Has the area of impact been re-established, and what changed? How many of the jobs announced by new or expanding plants were filled by people who moved to the area? What share of new homes is priced within reach of the median household income?
The Magic Valley angle. The region's story is two-sided. Twin Falls and Kimberly look like a small version of the Treasure Valley, with commuter growth, annexation and rising prices. Jerome and Gooding counties look like something else: growth driven by dairies, processing plants, births and immigration, with prices rising faster than local incomes. Reporting that treats the whole valley as one story will miss half of it. Check every figure against the agency table named in the notes, and say whether it is a count or an estimate.
Where to go next
- OnTheMap (U.S. Census Bureau): Free web map of where people live and work, built from LODES. Pick a city or county, then run an Inflow/Outflow or Destination analysis; useful for anyone asking whether a town is a job center or a bedroom town.
- data.census.gov: Free. Search for a town and a table number (B25077 home value, B25064 rent, B19013 income, DP05 demographics) and choose the 5-year ACS; margins of error appear beside every estimate.
- Census Building Permits Survey data: Free monthly and annual permit files for every permit-issuing city and county; check the months-reported column before quoting a small town.
- FHFA House Price Index datasets: Free quarterly and annual price indexes for the nation, states, metro areas and (developmental) counties; deflate with CPI-U to see real change.
- Idaho Department of Labor county profiles: Free monthly county profiles with labor force, wages by industry, top employers and commuting; written for residents, reporters and local officials.
- USDA Census of Agriculture: Free county tables every five years (latest 2022; next 2027) on farms, land in farms and irrigated land; use Tables 8 and 10 for Idaho counties.
- MRLC Annual NLCD viewer and data: Free USGS land cover maps from 1985 on; compare developed classes around a town over time. Takes some GIS skill; lesson 05 explains the method.
Still being checked (9 items)
These points could not be fully confirmed against a primary source when this lesson was written and fact checked in November 2026. The text above states each one as uncertain.
- The Idaho Department of Labor's figure of 2,593 Jerome County residents working in Twin Falls in 2023 (23.2 percent) differs slightly from our LODES 8 count of 2,609 (23.4 percent); the reason (file version or boundary matching) was not confirmed.
- Commercial Creamery (named in the module plan as a Jerome employer), Clif Bar and Glanbia do not appear in the Idaho Department of Labor's 2025 top-ten employer lists for Jerome or Twin Falls counties; their current employment was not confirmed.
- Hagerman's founding details (plat registered 1908; name from a misspelling of Stanley Hageman) come from a 2013 Times-News history, not an official record.
- Buhl's founding year (1906) is from the City of Buhl's website; we did not find an incorporation record.
- Whether Jerome, Twin Falls and Gooding counties re-established their cities' areas of impact by the Dec. 31, 2025 deadline in Idaho Code 67-6526 was not confirmed. (The deadline itself is confirmed in the current text of Idaho Code 67-6526(6).)
- Our LODES tabulation lacks Alaska and Michigan auxiliary files, so a handful of residents who work in those states may be missing from out-commuter totals.
- Acres developed per town since 2020 are not published by any agency; the lesson reports only legal land area changes from the Census Gazetteer and an illustrative range for Kimberly based on an assumed lot size.
- Jerome County's 15.5 percent FHFA index jump in 2025 comes from a developmental county index and may be revised.
- Idaho's 2024 per capita personal income in BEA's revised state series ($61,345, with 2025 at $64,200) was read from FRED series IDPCPI, not from a BEA table; the lesson's county comparisons use BEA's pre-revision county file ($62,323 for Idaho).
Last verified November 17, 2026. General education, not legal, financial or real estate advice; every figure names its source and year in the Notes and Sources below. Data is revised: check the newest release before relying on any number.
Notes
- U.S. Census Bureau, Population Division, Annual Estimates of the Resident Population for Incorporated Places in Idaho: April 1, 2020 to July 1, 2025, Vintage 2025, file SUB-EST2025_16 (columns ESTIMATESBASE2020 and POPESTIMATE2020 to POPESTIMATE2025) (read Nov. 17, 2026). Estimates, not counts. Read it online. ↩
- U.S. Census Bureau, Building Permits Survey, annual place files for the West Region, 2007 to 2025 (we2007a.txt to we2025a.txt): new privately owned housing units authorized, by 1-unit, 2-unit, 3 to 4 unit and 5-plus unit buildings, with the number of months each place reported. Totals include Census imputation for months not reported (read Nov. 17, 2026). Read it online. ↩
- U.S. Census Bureau, 2020 Census Redistricting Data (Public Law 94-171) Summary File, Idaho: table P1 (total population), P2 (Hispanic or Latino) and H1 (housing units, occupied, vacant), place and county summary levels; our extraction from the state file (read Nov. 17, 2026). Read it online. ↩
- U.S. Census Bureau, Vintage 2025 county population estimates and components of change, file CO-EST2025-ALLDATA (POPESTIMATE, NATURALCHG, DOMESTICMIG and INTERNATIONALMIG columns for 2021 to 2025; U.S. total is the sum of the 50 states and D.C.) (read Nov. 17, 2026). Read it online. ↩
- U.S. Census Bureau, Annual Estimates of Housing Units for Counties in Idaho: April 1, 2020 to July 1, 2025 (CO-EST2025-HU-16), Vintage 2025 (read Nov. 17, 2026). Read it online. ↩
- U.S. Census Bureau, Building Permits Survey, annual county files, 2000 to 2025 (co2000a.txt to co2025a.txt), units by structure size, Idaho counties; national and state totals are our sums of the county rows. FRED mirrors county series, for example BPPRIV016053 for Jerome County (read Nov. 17, 2026). Read it online. ↩
- U.S. Census Bureau, Longitudinal Employer-Household Dynamics, LEHD Origin-Destination Employment Statistics (LODES) version 8: Idaho origin-destination files id_od_main_JT00_2023 and 2024 and id_od_aux_JT00_2023 and 2024, the auxiliary files of the other states (Idaho residents working out of state; Alaska and Michigan files were not available), and the Idaho geographic crosswalk id_xwalk. All jobs (JT00). Our tabulation by county and by place; OnTheMap uses the same files (read Nov. 17, 2026). Read it online. ↩
- Federal Housing Finance Agency, House Price Index, annual all-transactions indexes for counties (developmental), "HPI with 2000 base" column, last updated March 31, 2026; Twin Falls County (16083), Jerome County (16053), Gooding County (16047) and other Idaho counties (read Nov. 17, 2026). Read it online. ↩
- U.S. Bureau of Labor Statistics, Consumer Price Index for All Urban Consumers (CPI-U), U.S. city average, all items, not seasonally adjusted (series CUUR0000SA0; 1982-84=100), annual averages: 2000 172.2, 2006 201.6, 2020 258.811, 2024 313.689, 2025 321.943; 2012 229.594 (BLS; the Idaho Department of Labor table's 2012 row shows 229.881, which does not match BLS); as tabulated in the Idaho Department of Labor 2026 CPI table (August 2026), checked against monthly values on FRED, series CPIAUCNS (read Nov. 17, 2026). Read it online. ↩
- U.S. Bureau of Economic Analysis, Regional Economic Accounts, table CAINC1, "Personal Income Summary," line 3, per capita personal income (dollars), 1969 to 2024, all counties file CAINC1__ALL_AREAS_1969_2024 (read Nov. 17, 2026). This county file predates BEA's Sept. 30, 2026 revision of state personal income; revised county estimates are scheduled for Dec. 2, 2026. Read it online. ↩
- U.S. Census Bureau, Vintage 2025 county characteristics, file CC-EST2025-ALLDATA-16 (Idaho), YEAR 1 (April 1, 2020 base) and YEAR 7 (July 1, 2025), AGEGRP 0, Hispanic (H_MALE plus H_FEMALE) divided by TOT_POP; our calculation of the shares (read Nov. 17, 2026). Read it online. ↩
- U.S. Census Bureau, ACS 2020 to 2024 5-year estimates, table B03003, "Hispanic or Latino Origin," total and Hispanic or Latino, with margins of error; our calculation of shares (read Nov. 17, 2026). Read it online. ↩
- Idaho State Historical Society, Reference Series No. 497, "Milner Dam": the Aug. 18, 1894 federal act (Senator Joseph M. Carey's reclamation statute), I.B. Perrine's water claim of June 25, 1900, investors Frank H. Buhl and Peter L. Kimberly, completion of the dam on Nov. 15, 1904 and closing of the diversion tunnels on March 2, 1905 (read Nov. 17, 2026). Read it online. ↩
- National Park Service, National Register of Historic Places Multiple Property Documentation Form, Historic U.S. Post Offices in Idaho, 1900-1941 (received 1989): Twin Falls "had been founded in 1904"; "In 1894, the Carey Act made possible the reclamation projects" (read Nov. 17, 2026). Read it online. ↩
- Idaho State Archives, North Side Canal Company photographs (P1984-101), "Land drawing at Jerome, Idaho, 1907-09-30" (read Nov. 17, 2026). Read it online. ↩
- U.S. Census Bureau, ACS 2020 to 2024 5-year estimates: table B25003 (tenure: owner-occupied and total occupied units), B25035 (median year structure built), B25001 (housing units) and B01002 (median age); table-based summary files (read Nov. 17, 2026). Read it online. ↩
- U.S. Census Bureau, Building Permits Survey, "Methodology." BPS counts units authorized, not starts or completions; covers permit-issuing places only (more than 99 percent of privately owned residential buildings are in permit-issuing places); non-reporting places are imputed from prior-year data scaled by a factor (read Nov. 17, 2026). Read it online. ↩
- U.S. Census Bureau, Understanding and Using American Community Survey Data: What All Data Users Need to Know (2020), Chapter 12, Glossary: "All published margins of error for the ACS are based on a 90 percent confidence level"; the lower the coefficient of variation, "the higher the relative reliability of the estimate" (read Nov. 17, 2026). Read it online. ↩
- U.S. Bureau of Labor Statistics, "2025 Federal Government Shutdown Impact on the CPI: Frequently Asked Questions." For most series, including all items, the 2025 annual average is "the average of the 11 index values published" because October 2025 was not collected (read Nov. 17, 2026). Read it online. ↩
- National Register of Historic Places nomination, Jerome County Courthouse (NRIS 87001600), prepared June 23, 1987: Works Progress Administration grant of $39,150 in 1938; "The courthouse was completed in the fall of 1939" (read Nov. 17, 2026). Read it online. ↩
- U.S. Census Bureau, 2000 Census of Population and Housing, Population and Housing Unit Counts, Idaho (PHC-3-14, 2003), Table 5, "Population and Housing Units: 1980 to 2000; and Area Measurements and Density: 2000." Counts as published for each census; "r" marks a revised 1990 count (Twin Falls) (read Nov. 17, 2026). Read it online. ↩
- U.S. Census Bureau, 2010 Census Redistricting Data (Public Law 94-171) Summary File, Idaho: tables P1, P2 and H1, place and county summary levels; land area (AREALAND) from the same file's geographic header (read Nov. 17, 2026). Read it online. ↩
- Evelyn Avitia, "Jerome city officials address the county's growth at State of Jerome," Idaho News 6 (KIVI), Feb. 10, 2022: Mayor Dave Davis said the city issued a record 77 building permits in 2021 (read Nov. 17, 2026). Read it online. ↩
- U.S. Census Bureau, Boundary and Annexation Survey (BAS) program page. The Census Bureau "conducts the Boundary and Annexation Survey (BAS) annually" to update legal boundaries and names of governments (read Nov. 17, 2026). Read it online. ↩
- U.S. Census Bureau, Gazetteer Files, places in Idaho, 2020 and 2025 editions (ALAND, land area in square meters, converted by us to square miles). Each edition reflects legal boundaries reported to the Census Bureau for January 1 of that year (read Nov. 17, 2026). Read it online. ↩
- Idaho Code section 50-222, "Annexation by Cities": written and recorded consent, notice to landowners and the county, public hearings, a written annexation plan, an annexation ordinance, and appeal within 28 days of publication for city-initiated annexations (read Nov. 17, 2026). Read it online. ↩
- Idaho Department of Labor, Communications and Research, Jerome County Labor Force and Economic Profile, October 2026: commuting 2023 (4,253 lived and worked in the county, 6,541 commuted in, 6,919 commuted out); top cities where residents work, 2023 (Twin Falls 2,593, 23.2 percent); top employers 2025 (QCEW, employment ranges); industry employment and wages 2015 and 2025 (read Nov. 17, 2026). Read it online. ↩
- U.S. Census Bureau, American Community Survey (ACS) 2020 to 2024 5-year estimates, table B25077, "Median Value (Dollars)" of owner-occupied housing units, with margins of error; read from the ACS table-based summary file acsdt5y2024-b25077 for the U.S., Idaho, Mountain West states, counties and places (read Nov. 17, 2026). Read it online. ↩
- U.S. Census Bureau, ACS 2020 to 2024 5-year estimates, table B25064, "Median Gross Rent (Dollars)," with margins of error; table-based summary file acsdt5y2024-b25064 (read Nov. 17, 2026). Read it online. ↩
- U.S. Census Bureau, ACS 2020 to 2024 5-year estimates, table B19013, "Median Household Income in the Past 12 Months (in 2024 Inflation-Adjusted Dollars)," and table B19301, per capita income, with margins of error; table-based summary files acsdt5y2024-b19013 and b19301 (read Nov. 17, 2026). Read it online. ↩
- U.S. Department of Agriculture, National Agricultural Statistics Service, 2022 Census of Agriculture, Volume 1, Chapter 2, Idaho County Level Data, Table 8, "Farms, Land in Farms, Value of Land and Buildings, and Land Use: 2022 and 2017" (read Nov. 17, 2026). Read it online. ↩
- USDA NASS, 2022 Census of Agriculture, Idaho County Level Data, Table 10, "Irrigation: 2022 and 2017," irrigated land in acres (read Nov. 17, 2026). Read it online. ↩
- Phillip G. Mead, "Twin Falls Historic Townsite," SAH Archipedia, Society of Architectural Historians (Buildings of the United States, Idaho), entry dated 1904 (read Nov. 17, 2026). Read it online. ↩
- Food Dive, "Chobani to spend $500M to expand Idaho plant," March 20, 2025: plant opened in 2012; a $100 million expansion in 2016; the new project adds about 500,000 square feet and at least 160 jobs. Trade press account of a company announcement (read Nov. 17, 2026). Read it online. ↩
- Snack and Bakery, "Clif Bar opens new $90 million facility," Sept. 2, 2016: 300,000-square-foot bakery in Twin Falls with 214 employees. Trade press account (read Nov. 17, 2026). Read it online. ↩
- Heather Kennison, Times-News, "Building boom: Twin Falls, Idaho sets building permit record," republished by KSL.com, Oct. 8, 2018: 3,544 permits of all types in the fiscal year ended Sept. 30, 2018, including 243 new single-family homes and 27 fourplexes (read Nov. 17, 2026). Read it online. ↩
- Idaho Code section 67-6526, "Areas of City Impact": county ordinance and map for each city's area of impact, review at least every five years, generally no more than two miles from city limits, and the requirement that cities and counties "reestablish the areas" by Dec. 31, 2025 (read Nov. 17, 2026). Read it online. ↩
- Idaho Legislature, Senate Bill 1403 (2024), "An Act relating to planning and zoning; amending section 67-6509 ... amending section 67-6526, Idaho Code, to revise provisions regarding areas of impact," text as introduced, including the Dec. 31, 2025 deadline (read Nov. 17, 2026). Read it online. ↩
- Idaho Department of Labor, Twin Falls County Labor Force and Economic Profile, October 2026: top employers 2025 and industry employment and wages (QCEW), commuting 2023 (read Nov. 17, 2026). Read it online. ↩
- National Register of Historic Places nomination, Kimberly High School (NRIS 90001229): "The establishment and settlement of Kimberly occurred in 1905"; $40,000 bond passed March 1916; the school opened around the start of 1917 and served as the high school until 1967 (read Nov. 17, 2026). Read it online. ↩
- Times-News (magicvalley.com), "Kimberly among fastest growing cities in Idaho," July 10, 2025, as summarized by Ground News (read Nov. 17, 2026). Read it online. ↩
- National Register of Historic Places nomination, Kelly's Hotel (Gooding Hotel), 112 Main Street, Gooding: the town of Gooding "was platted in 1907 as a supply and shipping center for agricultural establishments" (read Nov. 17, 2026). Read it online. ↩
- Idaho Department of Labor, Gooding County Labor Force and Economic Profile, October 2026: top employers 2025 and industry employment and wages (QCEW), commuting 2023 (read Nov. 17, 2026). Read it online. ↩
- City of Buhl, official website (masthead "City of Buhl, Idaho | Est. 1906") (read Nov. 17, 2026). Read it online. ↩
- National Register of Historic Places nomination, Ramona Theater, Buhl (NRIS 76000682): plans drawn in January 1928 by architect Burton Morse; the theater opened June 29, 1928 (read Nov. 17, 2026). Read it online. ↩
- Times-News (Twin Falls), "At a glance: Hagerman history," reprinted by the Hagerman Valley Chamber of Commerce, June 28, 2013: the city plat was registered with the county in 1908; the name comes from a misspelling of Stanley Hageman, who died Sept. 21, 1898. News account, not an official record (read Nov. 17, 2026). Read it online. ↩
- U.S. Census Bureau, 2020 Census apportionment historical data table (resident population of the United States and each state, 1910 to 2020): United States 226,545,805 (1980) and 281,421,906 (2000); Idaho 943,935 (1980) and 1,293,953 (2000) (read Nov. 17, 2026). Read it online. ↩
- U.S. Census Bureau, Annual Estimates of Housing Units for the United States, Regions, States, and the District of Columbia: April 1, 2020 to July 1, 2025 (NST-EST2025-HU): United States 140,498,736 (April 2020 base) and 148,260,882 (July 2025); Idaho 751,859 and 849,155 (read Nov. 17, 2026). Read it online. ↩
- Federal Housing Finance Agency, House Price Index, annual all-transactions indexes for states (hpi_at_state) and for the nation (separate file hpi_at_national.csv), "HPI with 2000 base" column, last updated March 31, 2026 (read Nov. 17, 2026). Read it online. ↩
- U.S. Geological Survey, Annual NLCD (National Land Cover Database): The Next Generation of Land Cover Mapping, Fact Sheet 2025-3001 (Jan. 17, 2025). Collection 1.0 covers land cover and land change "from 1985 through 2023" at 30-meter resolution (read Nov. 17, 2026). Read it online. ↩
- U.S. Census Bureau, OnTheMap web application (LEHD), free; choose a place or county, then "Inflow/Outflow" or "Destination" analysis (read Nov. 17, 2026). Read it online. ↩
Check yourself
1. By the Census Bureau's Vintage 2025 estimates, which of the six core towns grew fastest from the April 2020 base to July 2025?
Census SUB-EST2025_16: Kimberly went from 4,625 to 5,798, up 25.4 percent; Jerome rose 11.2 percent, Twin Falls 8.4 percent and Buhl 5.2 percent.
2. How many housing units did the Census Building Permits Survey record as authorized in Jerome County from 2020 through 2025?
Census BPS annual county files: 94, 169, 87, 75, 99 and 143, a total of 667. 487 is the City of Jerome alone; 217 was the 2006 peak; 1,083 is Minidoka County.
3. Jerome County's 39.2 percent Hispanic share, often quoted with its 2025 population, actually comes from which source?
ACS table B03003 for 2020 to 2024 shows 9,873 Hispanic of 25,173 (39.2 percent), as the Idaho Department of Labor profile reports. The Vintage 2025 estimate for July 2025 is 42.3 percent.
4. In 2024, how did commuting between Jerome County and Twin Falls County compare in each direction (LODES 8, all jobs)?
Our tabulation of LODES 8 for 2024: 3,266 Jerome County residents worked in Twin Falls County and 3,288 Twin Falls County residents worked in Jerome County.
5. Hagerman shows zero housing units permitted in the Census files for 2024 and 2025. What does that zero mean?
The BPS place files show zero months reported for Hagerman in 2024 and 2025; the Census BPS methodology imputes non-reporting places, so the zero is not a report of no construction.
6. Which town had the most jobs per employed resident in 2024, marking it as the region's job center?
Our LODES 8 tabulation: Twin Falls had 32,238 jobs and 24,675 resident workers, a ratio of 1.31, the highest of the six.
7. From 2020 to 2025, how much did the FHFA house price index for Jerome County rise after adjusting for inflation with CPI-U?
FHFA annual county index (2000 = 100): 201.79 in 2020 and 368.80 in 2025, up 82.8 percent nominal. Dividing by CPI-U (258.811 and 321.943) gives a real gain of 46.9 percent. 24.4 percent is the CPI change; 18.2 percent is the U.S. real price change.
8. The ACS 2020 to 2024 median home value for Kimberly is $339,400 with a margin of error of $41,828. What is the right conclusion?
ACS table B25077: the 90 percent range for Kimberly (about $297,600 to $381,200) overlaps the Twin Falls range, so the ranking is uncertain, though the estimate still says values are in the low to mid $300,000s.
9. What does the Census Gazetteer's city land area measure?
The Gazetteer reports land area of legal boundaries the Census Bureau collects through the annual Boundary and Annexation Survey; annexed land may still be farmed.
10. Which Magic Valley county's per capita personal income was above Idaho's in 2024 (BEA CAINC1)?
BEA CAINC1, 2024: Gooding County $70,962 against Idaho $62,323; Jerome $49,185, Twin Falls $53,767, Lincoln $50,400. BEA counts all income including farm proprietors' income.
Terms in this lesson
- Carey Act
- The Aug. 18, 1894 federal law that let states supervise privately built irrigation projects on federal desert land; the basis for the Twin Falls and North Side tracts.
- Vintage
- A yearly release of Census Bureau population estimates. Each vintage revises earlier years, so Vintage 2025 numbers for 2022 may differ from Vintage 2023 numbers for 2022.
- Estimates base
- The Census Bureau's April 1, 2020 starting population for its estimates, based on the 2020 census with later boundary and count corrections.
- New homes approved by building permits in a year, as counted by the Census Building Permits Survey; not the same as homes started or finished.
- Imputation
- A value the Census Bureau fills in for a place that did not report, based on its past reports and the trend among similar places.
- Margin of error (MOE)
- The plus-or-minus range published with every ACS estimate, at a 90 percent confidence level.
- Jobs per resident worker
- Jobs located in a place divided by employed people living there; above 1 suggests a job center, below 1 a bedroom town. Our ratio from LODES.
- LODES
- LEHD Origin-Destination Employment Statistics: Census files that link each job's work location to the worker's home block, used by OnTheMap.
- Area of city impact
- Under Idaho Code 67-6526, the zone outside a city's limits where it expects to grow, set by county ordinance and map.
- Annexation ordinance
- The city ordinance that adds land to city limits under Idaho Code 50-222, with a legal description of the land.
- Gazetteer file
- A Census file listing each place's land and water area for a given year's legal boundaries.
- Developmental index
- FHFA's label for its annual county house price indexes, warning that small samples can make single years unreliable.
- Per capita personal income
- BEA's total personal income of a county's residents, including wages, farm and business income, investment income and transfers, divided by its population.
- Natural increase
- Births minus deaths, one of the three components of population change with net international and net domestic migration.
Sources
- U.S. Census Bureau, Vintage 2025 population estimates for incorporated places (SUB-EST2025) (2026-11-17) checked 2026-11
- U.S. Census Bureau, Vintage 2025 county population, components and housing unit estimates (2026-11-17) checked 2026-11
- U.S. Census Bureau, 2000 Census PHC-3-14, Population and Housing Unit Counts, Idaho (2026-11-17) checked 2026-11
- U.S. Census Bureau, 2020 and 2010 Census Redistricting Data (P.L. 94-171), Idaho (2026-11-17) checked 2026-11
- U.S. Census Bureau, Building Permits Survey annual place and county files (2026-11-17) checked 2026-11
- U.S. Census Bureau, American Community Survey 2020 to 2024 5-year table-based summary file (2026-11-17) checked 2026-11
- U.S. Census Bureau, LEHD LODES version 8, Idaho (2026-11-17) checked 2026-11
- U.S. Bureau of Economic Analysis, CAINC1 county personal income (2026-11-17) checked 2026-11
- Federal Housing Finance Agency, annual House Price Indexes (counties, states, nation) (2026-11-17) checked 2026-11
- U.S. Bureau of Labor Statistics, CPI-U U.S. city average (CUUR0000SA0), via Idaho Department of Labor 2026 CPI table (2026-11-17) checked 2026-11
- USDA NASS, 2022 Census of Agriculture, Idaho county tables 8 and 10 (2026-11-17) checked 2026-11
- Idaho Department of Labor, Jerome, Twin Falls and Gooding County Labor Force and Economic Profiles, October 2026 (2026-11-17) checked 2026-11
- Idaho State Historical Society, Reference Series No. 497, Milner Dam (2026-11-17) checked 2026-11
- Idaho Code 67-6526 (areas of city impact) and 50-222 (annexation) (2026-11-17) checked 2026-11