Lesson 7 of 13 · about 55 minutes · Updated November 17, 2026
Where People Work
You'll be able to
- Explain what LEHD LODES (OnTheMap), the ACS commuting tables and BLS QCEW each count, and choose the right one for a question about jobs or commuting.
- Read county and city inflow, outflow and live-and-work counts, and compute a work-to-residence ratio to tell job centers from bedroom communities.
- Describe the Canyon to Ada and Jerome to Twin Falls commuting patterns from 2010 to 2024 with numbers and their sources.
- Compare commute mode, commute time and work from home for the U.S., Idaho, the Mountain West neighbors and Magic Valley counties, including margins of error for small places.
- Use QCEW to measure industry mix, location quotients and real average pay, and recognize suppressed cells and classification changes.
- Compare jobs added with housing units added, and average pay with home values and rents, while stating what each ratio can and cannot show.
Start here: the short version
- Idaho had 849,662 jobs located in the state in 2024, and Idaho residents held 869,460 jobs. About 65,800 of the residents' jobs were in other states, and about 46,000 jobs in Idaho were held by people who live elsewhere (Census LEHD LODES 8, All Jobs, 2024, our tabulation).12
- Canyon to Ada is the state's biggest commute. Jobs in Ada County held by Canyon County residents rose from 29,478 in 2010 to 55,263 in 2024. Ada residents working in Canyon rose from 12,634 to 26,312 over the same years (LODES 8, our tabulation).3
- Jerome County is a two-way commuting county. In 2024, 4,324 jobs in the county were held by people who also live there, 7,116 by people who live elsewhere, and 7,067 Jerome residents' jobs were outside the county. About 3,270 jobs flowed each way between Jerome and Twin Falls counties.1
- Work from home roughly doubled. The share of Idaho workers who worked from home went from 7.4 percent in 2019 to 12.8 percent in 2025; the U.S. went from 5.7 to 12.9 percent (ACS 1-year, table B08301).45
- Idaho added jobs three times as fast as the nation from 2019 to 2025: 16.2 percent vs. 5.1 percent, led by construction (up 42.2 percent) and health care and social assistance (up 28.6 percent) (BLS QCEW annual averages).67
- Jerome and Gooding counties are dairy counties. Dairy cattle and milk production was 11.8 percent of all covered jobs in Jerome County and 18.5 percent in Gooding County in 2025, vs. 0.07 percent nationwide (QCEW, NAICS 11212).7
- Homes cost more years of pay in Idaho. The 2025 median home value was 7.3 times Idaho's average annual pay per job, vs. 4.7 times for the U.S. (ACS 2025 1-year B25077 and QCEW 2025; our calculation).87
Data: Census LEHD Origin-Destination Employment Statistics (LODES) Version 8.5, job years 2010 to 2024 (technical document revised Oct. 19, 2026); American Community Survey (ACS) 2025 1-year and 2020 to 2024 5-year, and ACS 2019 1-year; BLS Quarterly Census of Employment and Wages (QCEW) annual averages 2019, 2021, 2022, 2024 and 2025; Census Vintage 2025 population and housing unit estimates; BLS CPI-U 2025 annual average (321.943); USDA NASS Milk Production (Feb. 20, 2026) and 2022 Census of Agriculture. Checked Nov. 17, 2026. Agencies revise data; newer releases may differ.
Where people live and where they work are often two different places, and the gap between them drives traffic on Interstate 84, the price of a rental in Jerome, school enrollment in Kuna and the tax base of every city between Caldwell and Burley. This lesson measures that gap with public data. It starts with the three federal datasets that answer "where do people work?" in different ways, then follows the numbers through the Treasure Valley, the Magic Valley core towns of Jerome, Twin Falls, Kimberly, Gooding, Buhl and Hagerman, and the rest of the state. It then looks at which industries employ Idahoans, how many of those jobs are on dairies and in food plants, whether housing has kept up with jobs, and how pay compares with home prices and rents.
The lesson builds on others in this module and does not repeat them. How to read any growth number (estimates, vintages, margins of error, real dollars) is in How to Measure Growth Without Fooling Yourself. The town-by-town Magic Valley history, populations and permits are in The Magic Valley Case Study. Price and rent series over 25 years are in Prices and Rents vs. Inflation. Who is moving in, and from where, is in Who Is Moving In and From Where. Incentive deals, data centers and the housing pressure they create are in Economic Development and Housing Pressure. Roads and the money behind them are covered in the separate module Idaho Roads and Highway Funding, and the planning tools cities use to place homes and jobs are in Idaho Planning and Zoning.
Three datasets, three different questions
No single federal table says "where Idahoans work." Three datasets come close, and each one counts something different. Mixing them without saying so is the most common mistake in local news coverage of jobs and commuting.
LEHD LODES and OnTheMap: jobs by home and work location
The Census Bureau's Longitudinal Employer-Household Dynamics program (LEHD) links state unemployment insurance wage records to where workers live. Its public product is the LEHD Origin-Destination Employment Statistics, called LODES. LODES is released two ways: inside the free OnTheMap web application and as raw comma-separated files that anyone can download, one set per state.910
- What it counts: jobs, placed at the census block where the job is and the census block where the worker lives. The "origin-destination" (OD) files pair a home block with a work block. Two other file types total jobs by home block (Residence Area Characteristics) or by work block (Workplace Area Characteristics).9
- Jobs, not people. The "All Jobs" files (job type JT00) count every job, so a person with two jobs counts twice. LEHD also publishes "Primary Jobs" (JT01) files. In Jerome County in 2024, there were 11,440 jobs in the All Jobs file and 10,529 in the Primary Jobs file, a difference of 911.9111
- Years: 2002 to 2024 in the current release, LODES Version 8.5. Federal civilian jobs are included only from 2010 on, which is why the time series in this lesson start in 2010. Alaska has no job files from 2017 on and Michigan has none for 2022 to 2024, so a small number of Idahoans working in those states are missing from out-of-state totals.9
- Categories: each OD record splits jobs by worker age (29 or younger, 30 to 54, 55 or older), monthly earnings ($1,250 or less, $1,251 to $3,333, more than $3,333) and three broad industry groups (goods producing; trade, transportation and utilities; all other services).9
- Limits: LODES covers jobs in the unemployment insurance system plus federal jobs. Self-employed people and most farm owners are not in it. Census adds statistical noise to protect confidentiality, so very small block-level counts are not reliable; county and city totals are much sturdier.
Every LODES number in this lesson is our own tabulation of the raw Idaho files plus the out-of-state "auxiliary" files that hold jobs Idaho residents work in other states. We summed blocks to counties with the first five digits of the block code and to cities with the LEHD geography crosswalk. Our 2023 Jerome County totals match the figures in the Idaho Department of Labor's Jerome County workforce profile, which cites LEHD: 4,253 jobs held by people who live and work in the county, 6,541 inflow jobs and 6,919 outflow jobs.12421314
How we figured it: commute flows from LODES
- Downloaded the Idaho LODES 8 OD files for All Jobs (JT00): the "main" file (home and job both in Idaho) and the "aux" file (job in Idaho, home in another state), for each year shown.1
- Downloaded every other state's "aux" file for the same year, which lists jobs in that state held by residents of other states, and kept only the rows with an Idaho home block. That gives Idahoans' out-of-state jobs.2
- For each county or city: jobs located in the area = all jobs with a work block in the area; jobs held by residents = all jobs with a home block in the area, wherever the job is; live and work = jobs with both blocks in the area; inflow = jobs located in the area minus live and work; outflow = jobs held by residents minus live and work.
- Work-to-residence ratio (our calculation) = jobs located in the area divided by jobs held by its residents. Above 1.0 means the area imports workers; below 1.0 means it exports them, the mark of a bedroom community.
These are counts of jobs, not people, in a dataset with statistical noise added. Treat the last two or three digits as approximate.
ACS commuting tables: how and how long people travel
The American Community Survey (ACS) is the Census Bureau's ongoing household survey. Its commuting questions ask, in the Bureau's words, "where people work, how they get there, when they leave home, and how long it takes."15 The ACS reports workers 16 and older, so it counts people, not jobs, and it describes each worker's main job. Its key tables for this lesson are:
- B08301, Means of Transportation to Work: drove alone, carpooled, public transportation, walked, bicycle, other, and worked from home.5
- B08303, Travel Time to Work: the number of workers in bands from under 5 minutes to 90 minutes or more (workers who work from home are excluded).16
- B08013, Aggregate Travel Time to Work: total minutes for all commuters, which we divide by the number of commuters to get the mean one-way trip.17
ACS numbers are estimates from a sample and carry a margin of error (MOE), the range within which the true value is likely to fall at 90 percent confidence. The 1-year file covers only places with 65,000 or more people, so for Jerome, Gooding, Lincoln and the Magic Valley towns we use the 2020 to 2024 5-year file, which pools five years of responses. A 5-year estimate describes the whole period, not 2024.
QCEW: jobs and pay by industry, where the job is
The Bureau of Labor Statistics (BLS) Quarterly Census of Employment and Wages (QCEW) is a count, not a survey. It comes from employers' unemployment insurance reports and "covers more than 95 percent of U.S. jobs available at the county, state, and national level, by detailed industry."18 QCEW counts workers on the payroll for the pay period that includes the 12th of each month, at the employer's work site. It excludes "proprietors, the unincorporated self-employed, unpaid family members, certain farm and domestic workers" and railroad workers.19 QCEW also withholds an industry's numbers in a county when publishing them would reveal one employer's data; this lesson marks those cells "not published." QCEW does not say where workers live.
| Question | Best source | What it counts | Smallest area | Newest year (Nov. 2026) |
|---|---|---|---|---|
| How many people commute from county A to county B? | LEHD LODES (OnTheMap) | Jobs by home and work block | Census block (use counties and cities) | 2024 |
| Is a town a job center or a bedroom community? | LODES, work-to-residence ratio | Jobs located vs. jobs held by residents | City | 2024 |
| How do people get to work, and how long does it take? | ACS B08301, B08303, B08013 | Workers 16 and older (survey estimate) | 1-year: 65,000+ people; 5-year: any place | 2025 (1-year); 2020 to 2024 (5-year) |
| How many people work from home? | ACS B08301, line "worked from home" | Workers (survey estimate) | Same as above | 2025 |
| Which industries employ the most people, and what do they pay? | BLS QCEW | Covered jobs and wages at the work site | County | 2025 annual average |
| How many hired farm workers are there? | USDA Census of Agriculture, Table 7 | Hired workers reported by farms | County | 2022 (next: 2027) |
| How many homes are there to house the workers? | Census housing unit estimates | Housing units (estimate) | County | July 1, 2025 |
Two other federal sources come up in news stories. The BLS Local Area Unemployment Statistics (LAUS) program estimates the labor force and unemployment by where people live. The Bureau of Economic Analysis (BEA) counts total employment including the self-employed and farm proprietors. Both are useful, but neither shows commuting, so this lesson uses them only as cross-checks. The Idaho Department of Labor publishes county labor market profiles and its own analysis of these federal series at lmi.idaho.gov.20

Idaho's commuting picture in 2024
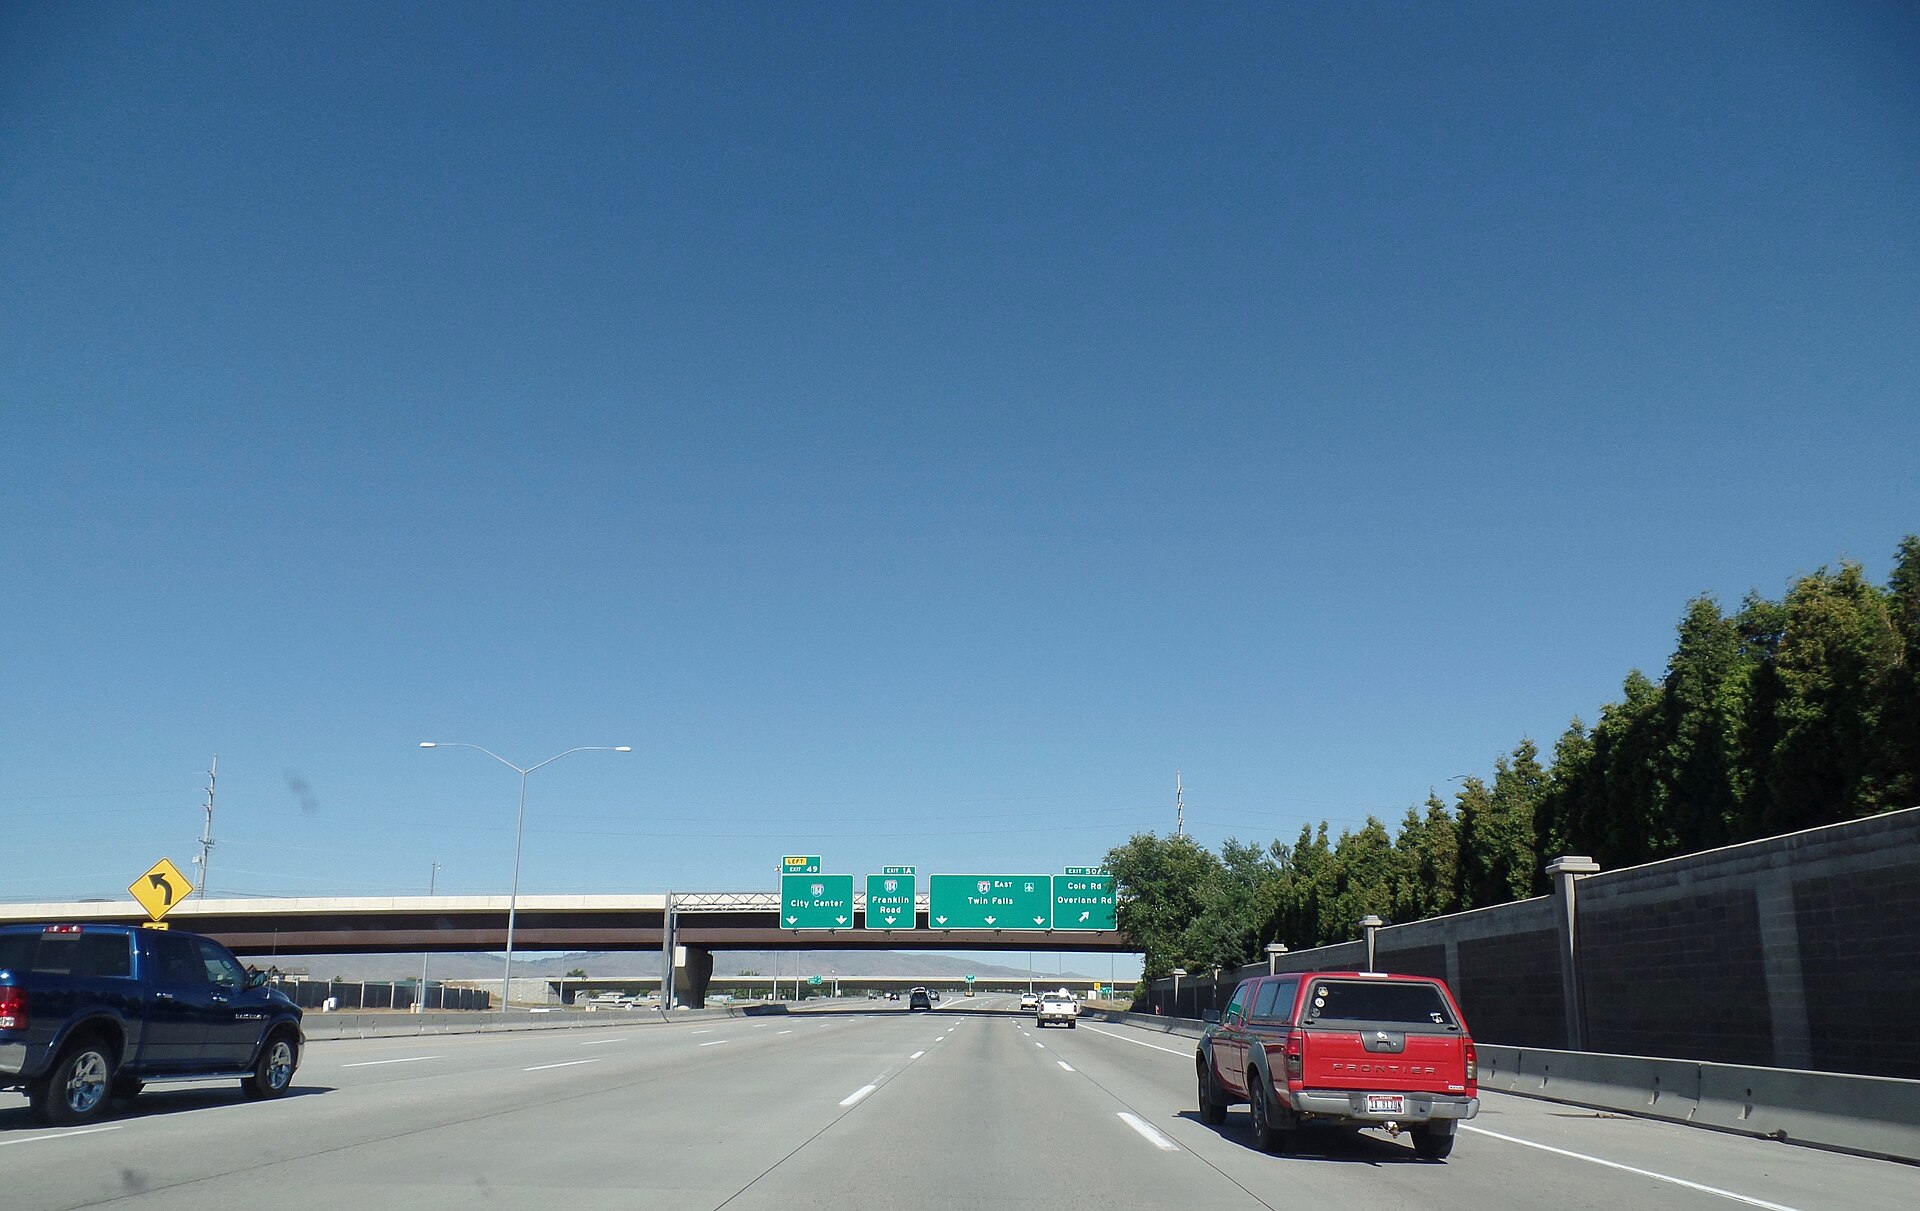
Start with the state as a whole. In 2024, LODES placed 849,662 jobs in Idaho. Idaho residents held 869,460 jobs, of which 65,762 were in other states. Residents of other states held 45,964 jobs in Idaho. In 2019 the same counts were 740,200 jobs in Idaho, 759,825 jobs held by residents, 61,690 residents' jobs out of state and 42,065 jobs held by out-of-state residents.1221 The jobs located in Idaho grew 14.8 percent in those five years by this measure. QCEW, which counts covered jobs differently and has a 2025 figure, shows 752,351 jobs in 2019 and 874,283 in 2025, a 16.2 percent rise; for the U.S. the QCEW rise was 5.1 percent, from 148,105,092 to 155,732,363.67
Most of the cross-border commuting is in north Idaho, where Kootenai County sits next to Spokane County, Washington. In 2024, 11,818 jobs in Spokane County were held by Kootenai County residents, and 6,509 jobs in Kootenai County were held by Spokane County residents. Lewiston and Clarkston, Washington, form another cross-border pair: 3,302 Lewiston residents' jobs were out of state in 2024.12
County job flows, 2024
The table below shows the twelve counties this module follows most closely. "Jobs located in county" counts jobs at work sites in the county. "Jobs held by residents" counts jobs held by people who live in the county, wherever the job is. The work-to-residence ratio is our calculation.
| County | Jobs located in county | Jobs held by residents | Live and work in county | Inflow (held by nonresidents) | Outflow (residents' jobs elsewhere) | Share of county's jobs filled by in-commuters | Work-to-residence ratio 2024 | Ratio 2019 |
|---|---|---|---|---|---|---|---|---|
| Ada | 301,654 | 251,758 | 202,911 | 98,743 | 48,847 | 32.7% | 1.20 | 1.20 |
| Canyon | 92,256 | 119,743 | 51,485 | 40,771 | 68,258 | 44.2% | 0.77 | 0.73 |
| Jerome | 11,440 | 11,391 | 4,324 | 7,116 | 7,067 | 62.2% | 1.00 | 0.95 |
| Twin Falls | 41,638 | 42,275 | 26,967 | 14,671 | 15,308 | 35.2% | 0.98 | 1.04 |
| Gooding | 6,770 | 7,136 | 3,175 | 3,595 | 3,961 | 53.1% | 0.95 | 0.88 |
| Lincoln | 1,966 | 2,701 | 885 | 1,081 | 1,816 | 55.0% | 0.73 | 0.76 |
| Minidoka | 9,609 | 10,312 | 4,352 | 5,257 | 5,960 | 54.7% | 0.93 | 0.81 |
| Cassia | 12,400 | 11,740 | 5,986 | 6,414 | 5,754 | 51.7% | 1.06 | 1.10 |
| Blaine | 14,164 | 11,126 | 8,473 | 5,691 | 2,653 | 40.2% | 1.27 | 1.31 |
| Kootenai | 72,853 | 78,319 | 52,344 | 20,509 | 25,975 | 28.2% | 0.93 | 0.92 |
| Bonneville | 72,927 | 60,428 | 42,310 | 30,617 | 18,118 | 42.0% | 1.21 | 1.13 |
| Bannock | 36,620 | 39,760 | 24,409 | 12,211 | 15,351 | 33.3% | 0.92 | 0.94 |
Source: Census LEHD LODES 8, All Jobs (JT00), 2024 and 2019, Idaho main and auxiliary files plus other states' auxiliary files; our tabulation.122122
Three patterns stand out. Ada, Bonneville and Blaine are job centers: each has more jobs than its residents hold. Canyon and Lincoln are the clearest bedroom counties: Canyon residents hold about 27,500 more jobs than the county has, and in Lincoln County two of every three residents' jobs are outside the county, mostly in Blaine County (648 jobs) and Twin Falls County (277). Jerome, Twin Falls, Gooding and Minidoka sit close to 1.0, which means jobs and resident workers are roughly in balance in total, yet more than half of the jobs in Jerome, Gooding, Minidoka and Cassia are filled by people who live in another county. Balance in the totals hides a great deal of crossing.
Canyon to Ada: the state's biggest commute
The Canyon County to Ada County flow is the largest county-to-county job flow among all the counties this lesson tabulated, in every year checked. In 2024, 55,263 jobs in Ada County were held by Canyon County residents, which is 46.2 percent of all 119,743 jobs held by Canyon residents. Going the other way, 26,312 jobs in Canyon County were held by Ada County residents.1
| Year | Canyon residents working in Ada | Ada residents working in Canyon | Canyon residents' jobs in Idaho (all counties) | Share of those jobs in Ada | Jerome residents working in Twin Falls County | Twin Falls County residents working in Jerome County |
|---|---|---|---|---|---|---|
| 2010 | 29,478 | 12,634 | 66,255 | 44.5% | 2,259 | 2,095 |
| 2014 | 35,261 | 14,351 | 75,638 | 46.6% | 2,610 | 2,462 |
| 2019 | 44,987 | 18,508 | 93,642 | 48.0% | 2,962 | 2,735 |
| 2021 | 47,923 | 23,564 | 101,321 | 47.3% | 2,963 | 3,030 |
| 2023 | 53,019 | 25,174 | 110,609 | 47.9% | 3,239 | 3,074 |
| 2024 | 55,263 | 26,312 | 115,568 | 47.8% | 3,266 | 3,288 |
Source: LODES 8, Idaho OD main files, All Jobs, 2010 to 2024; our tabulation. The share column uses only jobs inside Idaho so every year is comparable.3
The flow nearly doubled from 2010 to 2024 (up 87 percent), while the reverse flow from Ada to Canyon more than doubled (up 108 percent). The share of Canyon residents' Idaho jobs located in Ada County rose from 44.5 percent in 2010 to about 48 percent by 2019 and has stayed near that level since. That is a useful finding for planners: Canyon County's dependence on Ada County jobs has not kept rising since 2019. Canyon County has been adding its own jobs faster than Ada in percentage terms (QCEW: up 26.0 percent from 2019 to 2025 vs. 16.7 percent in Ada), so the number of jobs held by Canyon residents inside Canyon County also rose, from 41,549 in 2019 to 51,485 in 2024, even as the number crossing into Ada kept growing.2167
How long the trip takes
ACS travel time data show the cost of that commute in minutes. In the ACS 2025 1-year estimates, 45.9 percent of Canyon County commuters traveled 30 minutes or more each way, compared with 24.0 percent in Ada County, 29.0 percent statewide and 39.2 percent nationwide. In 2019 the Canyon share was 41.9 percent.1623 Using the 2020 to 2024 5-year estimates, the mean one-way commute was 25.3 minutes for Canyon County workers, 21.2 minutes in Ada County, 21.6 minutes statewide and 26.4 minutes for the U.S. (our calculation from B08013 and B08301).2425
Idaho's commutes are short by national standards, and they are getting a little longer. The 2025 1-year mean for Idaho was 22.7 minutes, up from 21.5 minutes in 2019, while the U.S. mean was 27.4 minutes in 2025 and 27.6 minutes in 2019 (our calculation from B08013 and B08301; both Idaho figures carry sampling error, so treat the change as approximate).2617
Treasure Valley cities: job centers and bedroom towns
City-level LODES totals show which places import workers and which export them. Kuna, Star and Middleton have fewer than half as many jobs as their residents hold. Boise has 1.6 jobs for every job its residents hold.
| City | Jobs located in city 2024 | Jobs held by residents 2024 | Residents' jobs in their own city | Work-to-residence ratio 2024 | Ratio 2019 | Mean commute, minutes (ACS 2020 to 2024) | Largest destination for residents' jobs, 2024 |
|---|---|---|---|---|---|---|---|
| Boise | 190,995 | 118,115 | 61.2% | 1.62 | 1.54 | 18.9 | Boise (72,327); next Meridian (14,057) |
| Meridian | 64,440 | 62,684 | 24.6% | 1.03 | 1.12 | 22.4 | Boise (26,812) |
| Nampa | 53,906 | 53,205 | 29.0% | 1.01 | 0.91 | 24.4 | Nampa (15,404); next Boise (14,849) |
| Caldwell | 21,762 | 32,116 | 17.7% | 0.68 | 0.77 | 24.6 | Boise (7,612) |
| Eagle | 13,403 | 13,571 | 13.7% | 0.99 | 0.93 | 23.7 | Boise (5,738) |
| Kuna | 4,915 | 14,702 | 8.4% | 0.33 | 0.36 | 28.9 | Boise (5,968) |
| Star | 2,695 | 6,351 | 7.7% | 0.42 | 0.27 | 27.5 | Boise (2,196) |
| Middleton | 2,139 | 4,778 | 7.5% | 0.45 | 0.42 | 27.3 | Boise (1,297) |
Sources: LODES 8, All Jobs, 2024 and 2019, cities assigned with the LEHD Idaho geography crosswalk (our tabulation); ACS 2020 to 2024 5-year, B08013 and B08301 (our calculation of the mean).11424
Two changes since 2019 are worth a reporter's call. Meridian's ratio fell from 1.12 to 1.03 as jobs held by its residents grew faster (from 46,521 to 62,684) than jobs located in the city (51,998 to 64,440). Nampa went the other way, from 0.91 to 1.01, as jobs located in the city grew from 39,712 to 53,906. Star's ratio rose from 0.27 to 0.42 on a small base: jobs in Star went from 1,185 to 2,695.121 The big-city growth numbers behind these shifts are in The Big Cities Since 2020.
Other major cities
| City | Jobs located in city 2024 | Jobs held by residents 2024 | Residents' jobs in their own city | Work-to-residence ratio 2024 | Ratio 2019 | Mean commute, minutes (ACS 2020 to 2024) |
|---|---|---|---|---|---|---|
| Idaho Falls | 52,275 | 31,881 | 52.5% | 1.64 | 1.50 | 18.9 |
| Pocatello | 27,963 | 26,014 | 51.2% | 1.07 | 1.10 | 16.2 |
| Coeur d'Alene | 34,647 | 24,565 | 43.6% | 1.41 | 1.43 | 18.1 |
| Post Falls | 15,561 | 18,982 | 21.3% | 0.82 | 0.85 | 24.1 |
| Lewiston | 17,195 | 16,490 | 48.9% | 1.04 | 1.13 | 15.3 |
| Twin Falls | 32,238 | 24,675 | 55.7% | 1.31 | 1.35 | 15.7 |
Jerome and Twin Falls: two counties, one labor market
Jerome County and Twin Falls County face each other across the Snake River Canyon, and the job numbers show that people treat them as one labor market. In 2024, 3,266 jobs in Twin Falls County were held by Jerome County residents, and 3,288 jobs in Jerome County were held by Twin Falls County residents. For most of the period since 2010, more Jerome residents crossed south than Twin Falls residents crossed north; by 2021 the flows were about equal, and they have stayed nearly equal since.3
| Jerome County | 2010 | 2014 | 2019 | 2021 | 2023 | 2024 |
|---|---|---|---|---|---|---|
| Jobs located in Jerome County | 8,034 | 9,399 | 9,916 | 10,254 | 10,794 | 11,440 |
| Held by people who live in the county | 3,438 | 3,937 | 4,141 | 3,948 | 4,253 | 4,324 |
| Held by in-commuters | 4,596 | 5,462 | 5,775 | 6,306 | 6,541 | 7,116 |
| Share filled by in-commuters | 57.2% | 58.1% | 58.2% | 61.5% | 60.6% | 62.2% |
| Jerome residents working in Twin Falls County | 2,259 | 2,610 | 2,962 | 2,963 | 3,239 | 3,266 |
| Twin Falls County residents working in Jerome County | 2,095 | 2,462 | 2,735 | 3,030 | 3,074 | 3,288 |
Source: LODES 8, Idaho OD main and auxiliary files, All Jobs, 2010 to 2024; our tabulation.3
From 2010 to 2024 the jobs located in Jerome County grew 42 percent, from 8,034 to 11,440. The jobs held by people who live in the county grew only 26 percent, from 3,438 to 4,324, so the in-commuter share rose from 57 to 62 percent. Where do Jerome County's in-commuters live? In 2024, 3,288 lived in Twin Falls County, 858 in Gooding County, 372 in Ada County, 254 in Cassia County and 220 in Minidoka County. Where do Jerome residents who leave the county work? 3,266 in Twin Falls County, 738 in Gooding County, 723 in Ada County, 320 in Blaine County and 278 in Cassia County.1
A share often quoted for Jerome County comes from the Idaho Department of Labor's county profile: in 2023 the city of Twin Falls was the top work destination for Jerome County residents, with 2,593 jobs, 23.2 percent.42 Our 2023 tabulation of the same LODES files gives 2,609 jobs, 23.4 percent of the 11,172 jobs held by Jerome County residents; the small gap may come from file versions or boundary matching. Other measures of the same link give different numbers, so say which one you use: in 2024, Jerome County residents held 3,266 jobs anywhere in Twin Falls County (28.7 percent of their 11,391 jobs) and 2,668 in the city of Twin Falls (23.4 percent), and residents of the city of Jerome held 1,301 jobs in the city of Twin Falls (22.4 percent of their 5,797 jobs) (LODES 8, All Jobs, our tabulation).114
The Primary Jobs file tells the same story with slightly smaller numbers. In 2024 it put 10,529 primary jobs in Jerome County, 3,943 held by county residents and 6,586 held by in-commuters (62.6 percent).11
Why the in-commuter share keeps rising is a question the data can frame but not settle. The job side is clear from QCEW: covered jobs in Jerome County rose from 10,474 in 2019 to 12,328 in 2025, a 17.7 percent gain, with food manufacturing alone going from 920 to 1,743 jobs.67 The housing side grew more slowly: Census estimates put Jerome County at 8,683 housing units on July 1, 2021 and 9,107 on July 1, 2025, an increase of 424.27 The section Jobs and housing below compares those two numbers for every county.


The six core towns
City-level counts are smaller and noisier, but they show which Magic Valley towns are job centers and which are home bases for people who work elsewhere. Twin Falls has 1.31 jobs for every job its residents hold and keeps more than half of its residents' jobs inside the city. Kimberly and Buhl are bedroom towns: each has slightly more than half as many jobs as its residents hold, and Twin Falls is the largest single destination for both. Jerome and Gooding are close to balance.
| City | Jobs located in city 2024 | Jobs held by residents 2024 | Residents' jobs in their own city | Ratio 2024 | Ratio 2019 | Largest destinations of residents' jobs outside the city, 2024 | Mean commute, minutes (ACS 2020 to 2024) | Worked from home (ACS 2020 to 2024, MOE) |
|---|---|---|---|---|---|---|---|---|
| Jerome | 5,676 | 5,797 | 22.9% | 0.98 | 0.94 | Unincorporated Idaho 1,695; Twin Falls city 1,301; Boise 258 | 22.0 | 283 of 5,974 (4.7%), plus or minus 120 |
| Twin Falls | 32,238 | 24,675 | 55.7% | 1.31 | 1.35 | Unincorporated Idaho 3,584; Boise 1,111; Jerome city 1,022 | 15.7 | 1,863 of 26,478 (7.0%), plus or minus 427 |
| Kimberly | 1,277 | 2,279 | 8.6% | 0.56 | 0.65 | Twin Falls city 1,042; unincorporated Idaho 436; Boise 84 | 18.0 | 299 of 2,261 (13.2%), plus or minus 142 |
| Gooding | 1,913 | 1,743 | 26.3% | 1.10 | 1.03 | Unincorporated Idaho 513; Twin Falls city 163; Jerome city 73 | 20.6 | 146 of 1,477 (9.9%), plus or minus 87 |
| Buhl | 1,175 | 2,131 | 12.2% | 0.55 | 0.75 | Twin Falls city 589; unincorporated Idaho 577; Boise 111 | 25.3 | 71 of 2,014 (3.5%), plus or minus 68 |
| Hagerman | 340 | 506 | 5.1% | 0.67 | 0.75 | Unincorporated Idaho 158; Twin Falls city 81; Wendell 44 | 23.5 | 24 of 508 (4.7%), plus or minus 23 |
Sources: LODES 8, All Jobs, 2024 and 2019, cities from the LEHD crosswalk (our tabulation); ACS 2020 to 2024 5-year, B08301 and B08013 (worked from home counts with their margins of error as published; the mean commute is our calculation).121142524
"Unincorporated Idaho" means work sites outside any city limit. In the Magic Valley that includes dairies, feedlots, processing plants and other rural employers, which is why it is the largest destination for residents of Jerome, Gooding and Hagerman. Hagerman's numbers are tiny: only 26 jobs in 2024 were held by people who both live and work in the city, and the ACS margin of error on its work-from-home count (24, plus or minus 23) is nearly as large as the estimate. Buhl's ratio fell from 0.75 to 0.55 since 2019 because jobs located in the city dropped from 1,359 to 1,175 while residents' jobs rose from 1,824 to 2,131; both changes are within the range where a single employer's move or a change in how a worksite was coded can matter, so check them against city records before building a story on them. The full town profiles, with population, permits and history, are in The Magic Valley Case Study.
Secondary Magic Valley towns
| City | Jobs located in city 2024 | Jobs held by residents 2024 | Live and work in city | Ratio 2024 | Ratio 2019 | Largest destinations of residents' jobs, 2024 |
|---|---|---|---|---|---|---|
| Wendell | 1,011 | 1,359 | 184 | 0.74 | 0.86 | Unincorporated 460; Twin Falls 207; Jerome 104 |
| Eden | 28 | 179 | 1 | 0.16 | 0.14 | Unincorporated 67; Twin Falls 39 |
| Hazelton | 94 | 328 | 10 | 0.29 | 0.25 | Unincorporated 122; Twin Falls 64 |
| Shoshone | 699 | 869 | 96 | 0.80 | 1.02 | Unincorporated 280; Twin Falls 78; Hailey 59 |
| Filer | 660 | 1,309 | 71 | 0.50 | 0.47 | Twin Falls 557; unincorporated 265 |
| Hansen | 115 | 545 | 12 | 0.21 | 0.19 | Twin Falls 193; unincorporated 156 |
| Rupert | 2,953 | 3,038 | 489 | 0.97 | 0.91 | Unincorporated 915; Burley 575; Twin Falls 192 |
| Burley | 8,212 | 5,685 | 2,015 | 1.44 | 1.31 | Unincorporated 1,486; Twin Falls 399; Rupert 359 |
Source: LODES 8, All Jobs, 2024 and 2019; our tabulation. Counts this small carry noise added by the Census Bureau for confidentiality; read them as rough sizes.121
Shoshone's commuters have the longest trips of any town in this lesson's tables: the ACS 2020 to 2024 mean was 38.1 minutes, and Lincoln County's was 33.6 minutes, the longest of any county in this lesson's tables. Many Lincoln County residents drive north to jobs in Blaine County, where the Wood River Valley's resort economy has more jobs than residents (work-to-residence ratio 1.27) and a 2020 to 2024 median home value of $735,300, plus or minus $68,817.24128
How people get to work
Most Idahoans drive alone to work, fewer than 1 in 100 ride public transportation, and since 2019 the biggest change has been the number who do not commute at all. The table compares 2019, the last full year before the pandemic, with 2025, the newest ACS 1-year release, for the U.S., Idaho and the six Mountain West neighbors.
| Area | Worked from home 2019 | Worked from home 2025 | Drove alone 2019 | Drove alone 2025 | Carpooled 2025 | Public transportation 2025 | Mean one-way commute 2019 (min.) | Mean one-way commute 2025 (min.) |
|---|---|---|---|---|---|---|---|---|
| United States | 5.7% | 12.9% | 75.9% | 69.8% | 8.9% | 3.8% | 27.6 | 27.4 |
| Idaho | 7.4% | 12.8% | 78.3% | 71.8% | 10.5% | 0.5% | 21.5 | 22.7 |
| Ada County | 8.1% | 18.2% | 79.0% | 68.2% | 9.0% | 0.4% | 21.4 | 21.7 |
| Boise city | 5.4% | 15.7% | 77.6% | 68.5% | 8.6% | 0.6% | 18.6 | 19.0 |
| Utah | 7.4% | 14.9% | 76.1% | 68.7% | 10.2% | 1.9% | 22.5 | 23.7 |
| Montana | 6.5% | 12.1% | 76.2% | 72.7% | 8.1% | 0.8% | 19.5 | 20.0 |
| Washington | 6.5% | 15.7% | 70.9% | 65.1% | 9.3% | 5.0% | 28.8 | 27.3 |
| Oregon | 7.3% | 15.1% | 71.5% | 67.3% | 8.4% | 2.8% | 24.2 | 23.6 |
| Nevada | 4.9% | 10.1% | 77.0% | 70.7% | 11.9% | 2.4% | 25.6 | 25.2 |
| Wyoming | 5.7% | 11.6% | 76.9% | 74.6% | 8.4% | 0.6% | 19.1 | 19.6 |
Sources: ACS 2019 and 2025 1-year, table B08301 (shares of workers 16 and older; our calculation from the published counts) and table B08013 (mean = aggregate minutes divided by workers who did not work from home; our calculation).452617 The Idaho work-from-home estimate for 2025 was 122,998 workers, plus or minus 6,138; for 2019 it was 61,935, plus or minus 5,042. Canyon County is not shown because the 2025 1-year B08301 file has no Canyon County row.
Idaho's work-from-home share rose 5.4 percentage points, less than the U.S. rise of 7.2 points, so Idaho went from above the national rate in 2019 to roughly equal in 2025. Within Idaho the change is concentrated in Ada County, where the share more than doubled to 18.2 percent. Washington, Oregon and Utah, with larger technology and office sectors, are higher still. Carpooling in Idaho went up slightly, from 9.2 to 10.5 percent, while the national share held at 8.9 percent.
County commuting profiles
Most Idaho counties are too small for 1-year ACS data, so the county comparison uses the 2020 to 2024 5-year estimates. The work-from-home column gives the count and its margin of error so readers can see how uncertain the small-county shares are.
| Area | Workers 16+ | Worked from home (count, MOE) | Share | Drove alone | Carpooled | Mean one-way commute (min.) |
|---|---|---|---|---|---|---|
| United States | 159,114,094 | 24,042,489 (plus or minus 82,855) | 15.1% | 68.8% | 8.5% | 26.4 |
| Idaho | 906,878 | 120,392 (plus or minus 3,119) | 13.3% | 72.7% | 8.9% | 21.6 |
| Ada | 262,719 | 48,650 (plus or minus 1,934) | 18.5% | 69.3% | 7.1% | 21.2 |
| Canyon | 117,256 | 15,197 (plus or minus 1,300) | 13.0% | 73.5% | 10.0% | 25.3 |
| Jerome | 11,535 | 673 (plus or minus 231) | 5.8% | 80.6% | 11.3% | 21.7 |
| Twin Falls | 44,286 | 3,263 (plus or minus 472) | 7.4% | 79.0% | 10.9% | 17.8 |
| Gooding | 7,151 | 591 (plus or minus 168) | 8.3% | 76.1% | 10.7% | 21.7 |
| Lincoln | 2,650 | 140 (plus or minus 44) | 5.3% | 78.6% | 11.2% | 33.6 |
| Minidoka | 10,364 | 491 (plus or minus 174) | 4.7% | 80.8% | 12.2% | 17.4 |
| Cassia | 11,330 | 1,007 (plus or minus 234) | 8.9% | 78.4% | 9.3% | 17.9 |
| Blaine | 13,888 | 2,030 (plus or minus 437) | 14.6% | 67.3% | 8.0% | 18.7 |
| Kootenai | 83,799 | 12,679 (plus or minus 993) | 15.1% | 73.9% | 7.9% | 22.8 |
| Bonneville | 57,962 | 6,024 (plus or minus 605) | 10.4% | 74.2% | 10.4% | 20.8 |
| Bannock | 41,283 | 4,698 (plus or minus 527) | 11.4% | 74.9% | 8.8% | 17.6 |
Sources: ACS 2020 to 2024 5-year, tables B08301 and B08013; shares and means are our calculations from the published counts.2524
The Magic Valley counties have the lowest work-from-home shares in the table, between 4.7 percent (Minidoka) and 8.9 percent (Cassia). That fits their job mix: dairies, food plants, farms, trucking and hospitals require people on site. Among cities, Eagle had the highest 5-year work-from-home share in this lesson's tables, 28.6 percent (4,083 workers, plus or minus 479), followed by Star (21.2 percent) and Meridian (19.4 percent).25
What jobs are here: QCEW by industry
QCEW shows where jobs are and what they pay, by industry, at the work site. The first table compares Idaho with the U.S. from 2019 to 2025 for the industries that matter most to growth and housing.
| Industry (NAICS code) | Idaho jobs 2019 | Idaho jobs 2025 | Idaho change | U.S. change | Idaho share of all jobs 2025 | U.S. share 2025 | Idaho average annual pay 2025 | U.S. average annual pay 2025 |
|---|---|---|---|---|---|---|---|---|
| All industries, all ownerships | 752,351 | 874,283 | 16.2% | 5.1% | 100% | 100% | $62,392 | $78,720 |
| Construction (23) | 50,684 | 72,070 | 42.2% | 10.7% | 8.2% | 5.3% | $70,753 | $84,826 |
| Health care and social assistance (62) | 97,644 | 125,530 | 28.6% | 13.9% | 14.4% | 14.8% | $58,895 | $66,522 |
| Manufacturing (31 to 33) | 68,404 | 74,296 | 8.6% | minus 1.5% | 8.5% | 8.1% | $86,864 | $89,471 |
| Food manufacturing (311) | 19,193 | 21,363 | 11.3% | 8.7% | 2.4% | 1.1% | $66,233 | $63,416 |
| Dairy product manufacturing (3115) | 4,087 | 5,027 | 23.0% | 10.1% | 0.6% | 0.1% | $72,738 | $76,745 |
| Agriculture, forestry, fishing and hunting (11) | 24,259 | 24,348 | 0.4% | minus 2.5% | 2.8% | 0.8% | $50,023 | $48,809 |
| Dairy cattle and milk production (11212) | 7,294 | 7,406 | 1.5% | 0.3% | 0.85% | 0.07% | $47,233 | $50,396 |
| Government, federal plus state plus local | 120,907 | 125,704 | 4.0% | 3.8% | 14.4% | 14.5% | not combined | not combined |
Sources: BLS QCEW annual averages, 2019 and 2025, U.S. and Idaho area files; private ownership for industry rows, all ownerships for totals; government is the sum of federal, state and local government ownership totals (our calculation). Percent changes and shares are our calculations.67
Construction is the fastest-growing major industry in Idaho, and it is tied directly to population growth: its share of Idaho jobs rose from 6.7 percent in 2019 to 8.2 percent in 2025, well above the U.S. share of 5.3 percent. If home building slows, those are the jobs most exposed. Health care grew at twice the national rate, which tracks Idaho's growing and aging population (see Who Idahoans Are Now). Government's share of jobs fell from 16.1 percent to 14.4 percent because private employment grew much faster than public employment.67
Core counties by industry, 2025
| Industry, 2025 (jobs and share of county total) | Ada | Canyon | Twin Falls | Jerome | Gooding | Minidoka | Cassia |
|---|---|---|---|---|---|---|---|
| All covered jobs | 295,234 | 90,221 | 42,703 | 12,328 | 6,664 | 9,227 | 12,609 |
| Change in all jobs, 2019 to 2025 | 16.7% | 26.0% | 6.9% | 17.7% | 9.0% | 12.3% | 8.2% |
| Dairy cattle and milk production | 202 (0.07%) | 507 (0.56%) | 1,370 (3.2%) | 1,450 (11.8%) | 1,236 (18.5%) | 262 (2.8%) | 955 (7.6%) |
| Food manufacturing | 2,094 (0.7%) | 3,668 (4.1%) | 3,472 (8.1%) | 1,743 (14.1%) | 866 (13.0%) | 1,161 (12.6%) | 1,048 (8.3%) |
| Health care and social assistance | 47,038 (15.9%) | 11,463 (12.7%) | 7,382 (17.3%) | 654 (5.3%) | not published | not published | 1,394 (11.1%) |
| Construction | 23,741 (8.0%) | 11,921 (13.2%) | 2,233 (5.2%) | 677 (5.5%) | 326 (4.9%) | 647 (7.0%) | 744 (5.9%) |
| Government, all levels | 39,227 (13.3%) | 10,064 (11.2%) | 5,101 (11.9%) | 1,153 (9.4%) | 1,008 (15.1%) | 1,543 (16.7%) | 1,596 (12.7%) |
| Average annual pay, all jobs | $73,786 | $54,271 | $50,136 | $54,347 | $52,022 | $52,213 | $52,100 |
Source: BLS QCEW 2025 and 2019 annual averages, county area files; private ownership for industries; shares and changes are our calculations. "Not published" means BLS withheld the figure to protect an employer's confidential data.76
Canyon County's construction share, 13.2 percent of all jobs, is the highest in the table and grew 59.4 percent from 2019 to 2025, from 7,478 to 11,921 jobs. Twin Falls County leans on health care (17.3 percent of jobs) and food manufacturing. Jerome County's mix is the most specialized: in 2025 its manufacturing sector, mostly food and dairy processing, held 2,651 jobs (21.5 percent), and dairy product manufacturing alone grew from 686 jobs in 2019 to 944 in 2025.76 Which plants those are, and what incentives came with them, is covered in Economic Development and Housing Pressure; QCEW itself does not name employers.
One measure of specialization is the location quotient: an industry's share of local jobs divided by its share of U.S. jobs. A quotient of 1.0 means the area has the national share. By our calculation from QCEW 2025, dairy cattle and milk production had a location quotient of 12.4 for Idaho, 47 for Twin Falls County, 111 for Cassia County, 172 for Jerome County and 272 for Gooding County. For food manufacturing the quotient was 2.1 for Idaho and 12.4 for Jerome County.7
Farm and dairy labor
Farm work is the part of the Magic Valley economy that the job datasets see least clearly, so it needs its own section. QCEW excludes "certain farm" workers, and both QCEW and LODES leave out farm owners and other self-employed people.19 The USDA Census of Agriculture, taken every five years, asks farms directly how many people they hired. It counted 22,877 Idaho farms in 2022, down from 24,996 in 2017.29
What USDA reports
- Hired workers: the 2022 Census of Agriculture counted 42,990 hired farm workers on 5,697 Idaho farms that hired labor, with a total payroll of $1,043,118,000. Of those workers, 21,741 worked 150 days or more on the farm that reported them and 21,249 worked fewer than 150 days. In Jerome County, 183 farms reported 1,360 hired workers and a payroll of $30,160,000.30 A worker hired by two farms can be counted twice, so this is a count of farm-worker positions in 2022, not of people.
- Milk cows: USDA's National Agricultural Statistics Service (NASS) estimated 714,000 milk cows in Idaho in 2025, up from 672,000 in 2024. Idaho produced 18,258 million pounds of milk in 2025, third among the states and just ahead of Texas at 18,207 million pounds. Idaho had 7.5 percent of U.S. milk cows and 7.9 percent of U.S. milk production (shares are our calculation).31
- Jerome County farms: the 2022 Census of Agriculture county profile counted 448 farms on 180,152 acres with $944,081,000 in sales. Livestock, poultry and their products made up 79 percent of sales. Milk sales of $519,029,000 ranked third among Idaho counties and 13th in the nation. The profile reports that 40 percent of Jerome County farms hired farm labor.32
- Covered dairy jobs: QCEW counted 7,406 jobs in dairy cattle and milk production in Idaho in 2025, at an average annual pay of $47,233, plus 5,027 jobs in dairy product manufacturing at $72,738. Jerome County had 1,450 dairy farm jobs and 944 dairy plant jobs; Gooding County had 1,236 dairy farm jobs; Twin Falls County had 1,370.7
The dairy farm jobs count in QCEW barely changed from 2019 to 2025 (7,294 to 7,406 statewide) even as the NASS cow count grew. Herd size and job counts can move separately as dairies consolidate and automate, and QCEW cannot show workers who are not on a covered payroll. Do not divide cows by QCEW jobs and call it a productivity measure; the two series cover different things.
Who does the work
Industry and university sources describe a dairy workforce that is largely immigrant. The Idaho Dairymen's Association, an industry group, has said that 90 percent of Idaho dairy workers are foreign-born and Spanish-speaking, as reported by Boise State Public Radio and the Idaho Capital Sun in July 2024.33 The same story covered a June 2024 University of Idaho McClure Center for Public Policy Research report, "Idaho at a Glance: Unauthorized Immigrants and Idaho's Economy," requested by the Idaho Dairymen's Association, the Idaho Farm Bureau Federation and the Idaho Association of Commerce and Industry. The report estimated about 35,000 unauthorized immigrants in Idaho, a figure based on 2021 data, the newest available to its authors.33 Those figures come from an industry group and a report that industry groups requested; they are not federal counts, and no federal dataset reports immigration status by county and industry. The Hispanic share of Jerome County and other Magic Valley counties, from Census data, is covered in Who Idahoans Are Now.
For housing, the point is practical. Dairies operate every day of the year and need workers who live nearby, and many farm and dairy jobs pay less than the county average: QCEW's 2025 average annual pay for Jerome County dairy cattle and milk production was $45,632, compared with $54,347 for all jobs in the county.7 Where those workers live, in employer housing, rentals in Jerome, Wendell and Gooding, or mobile homes on farm ground, is not something any federal dataset tracks well.

Jobs and housing: did homes keep up?
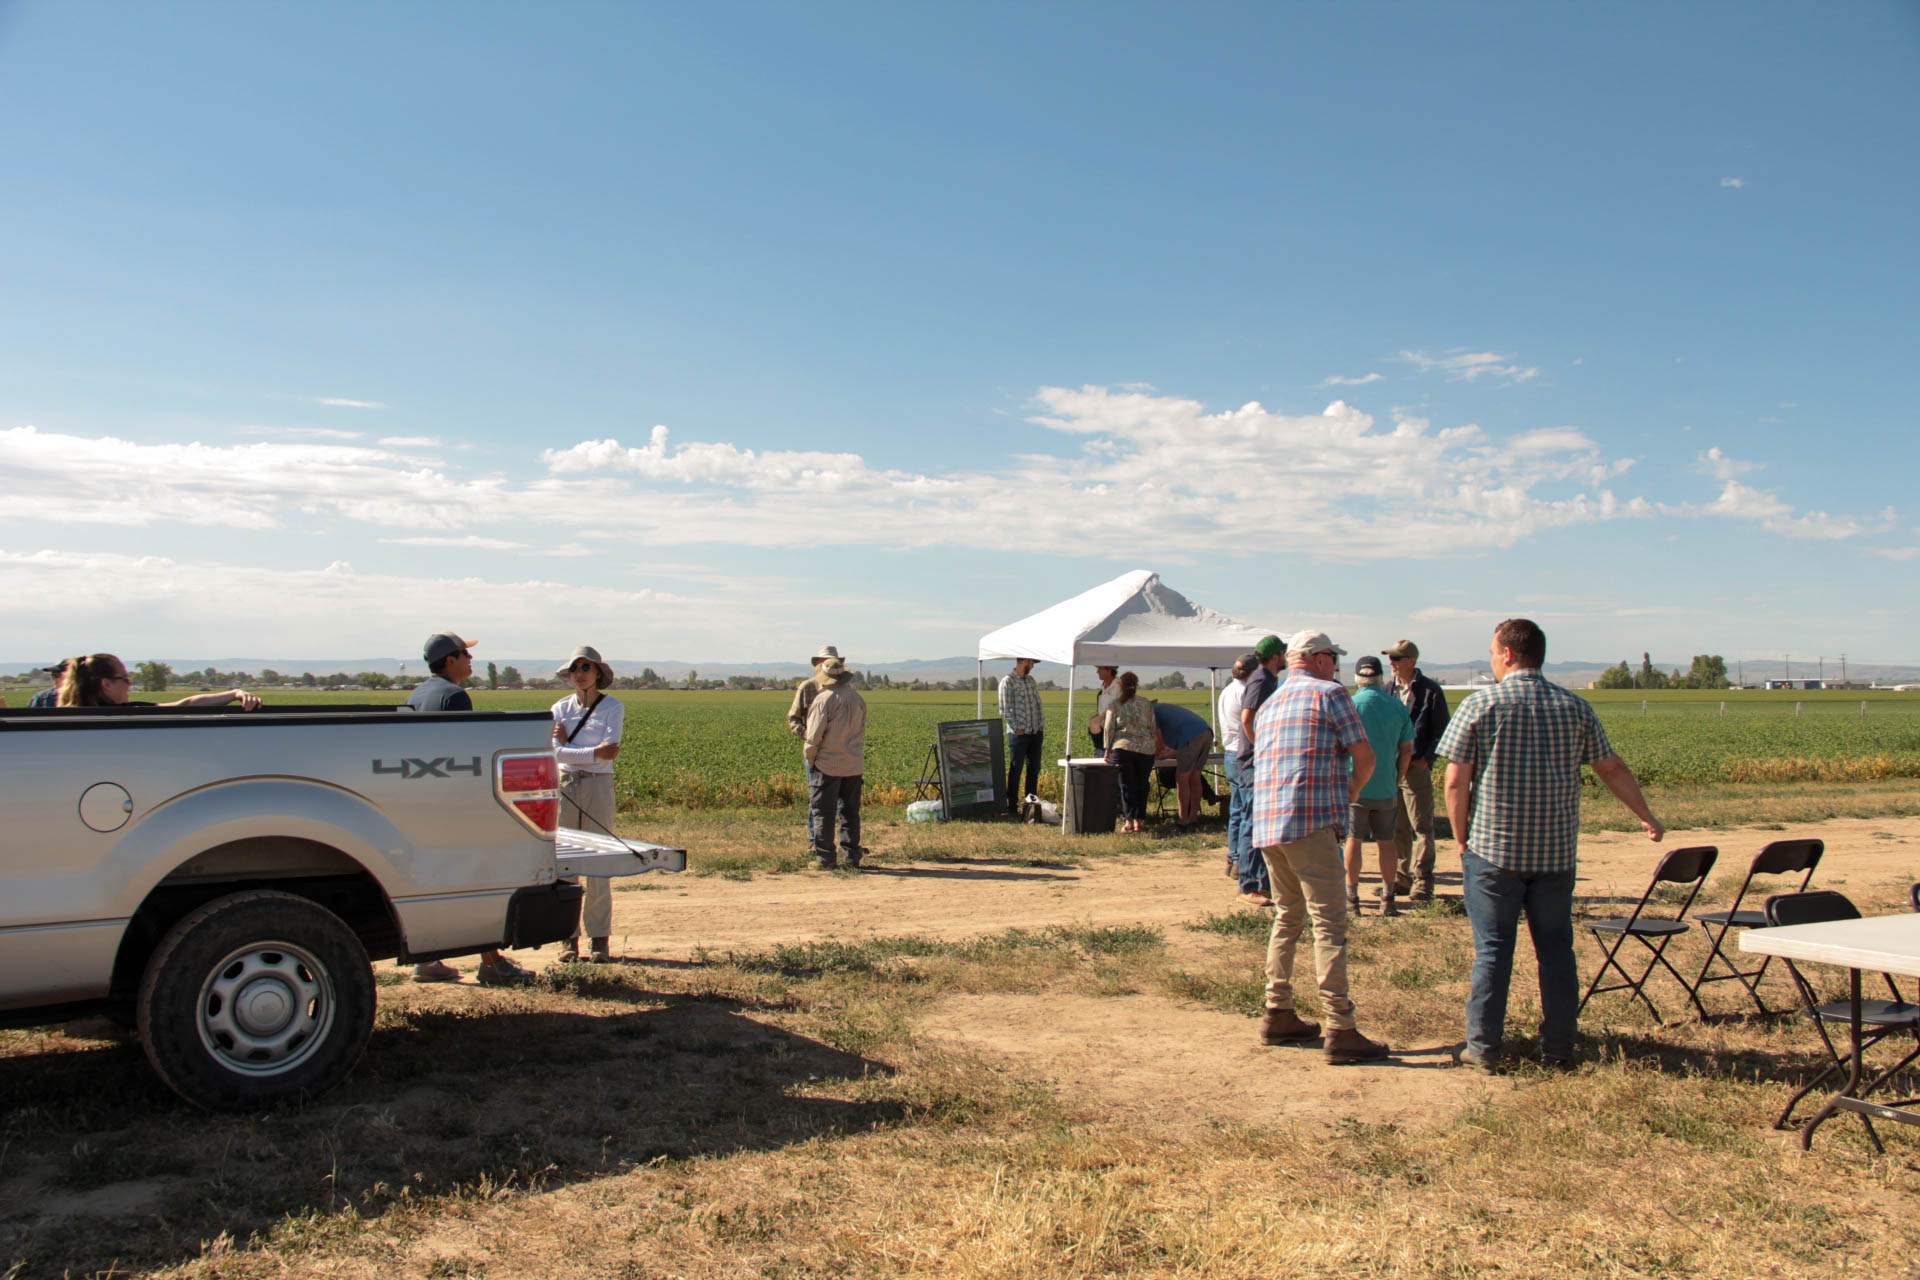
A simple way to check the balance between jobs and homes is to compare the number of jobs located in an area with the number of housing units there, and to compare how many of each were added over the same years. Neither number is a measure of need on its own: a housing unit can be vacant, a vacation home or occupied by retirees, and a job can be filled by someone from the next county. Read together, though, they show where job growth is outrunning home building.
How we figured it: jobs per housing unit
Jobs per housing unit = QCEW 2025 annual average covered jobs in the county, all ownerships, divided by the Census Vintage 2025 housing unit estimate for July 1, 2025. Jobs added per housing unit added = (QCEW jobs 2025 minus QCEW jobs 2021) divided by (housing units July 1, 2025 minus housing units July 1, 2021). We start in 2021 because both series have a 2021 value from the same release families and 2021 is after the 2020 job collapse; the U.S. job count in 2021 was still below 2019, which inflates the U.S. ratio.3472735
| Area | Jobs 2025 (QCEW) | Housing units July 1, 2025 | Jobs per housing unit | Jobs added 2021 to 2025 | Housing units added July 2021 to July 2025 | Jobs added per unit added |
|---|---|---|---|---|---|---|
| United States | 155,732,363 | 148,260,882 | 1.05 | 11,952,295 | 6,067,827 | 1.97 |
| Idaho | 874,283 | 849,155 | 1.03 | 83,859 | 74,367 | 1.13 |
| Ada | 295,234 | 228,926 | 1.29 | 32,606 | 24,481 | 1.33 |
| Canyon | 90,221 | 99,839 | 0.90 | 10,526 | 14,712 | 0.72 |
| Jerome | 12,328 | 9,107 | 1.35 | 1,351 | 424 | 3.19 |
| Twin Falls | 42,703 | 38,164 | 1.12 | 2,183 | 2,361 | 0.92 |
| Gooding | 6,664 | 6,288 | 1.06 | 408 | 214 | 1.91 |
| Lincoln | 1,729 | 2,024 | 0.85 | 98 | 58 | 1.69 |
| Minidoka | 9,227 | 9,138 | 1.01 | 846 | 746 | 1.13 |
| Cassia | 12,609 | 9,469 | 1.33 | 441 | 493 | 0.89 |
| Blaine | 14,438 | 16,603 | 0.87 | 1,421 | 933 | 1.52 |
| Kootenai | 71,925 | 86,151 | 0.83 | 5,274 | 7,947 | 0.66 |
| Bonneville | 63,586 | 52,208 | 1.22 | 6,453 | 5,950 | 1.08 |
| Bannock | 38,273 | 37,337 | 1.03 | 3,450 | 1,622 | 2.13 |
Sources: BLS QCEW annual averages 2021 and 2025; Census Vintage 2025 housing unit estimates for counties (CO-EST2025-HU-16) and for the nation and states (NST-EST2025-HU); ratios are our calculations.3472735
Jerome County stands out. From 2021 to 2025 it added about three jobs for every new housing unit, the highest ratio in the table, and it already had more jobs than housing units (1.35 per unit). That is consistent with the rising in-commuter share in the LODES data: jobs in Jerome County are being filled more and more by people who live in Twin Falls, Gooding and other counties. Canyon and Kootenai are the reverse: they added more homes than jobs, and their residents commute out, to Ada County and to Spokane County, Washington. Bannock County added about two jobs per new unit, a pattern worth a local check. Statewide, Idaho added 1.13 jobs for every new housing unit; how fast those units were permitted, city by city, is in The Big Cities Since 2020 and The Magic Valley Case Study.34727
Population gives a second check. Using Census Vintage 2025 population estimates, Idaho had 431 covered jobs for every 1,000 residents in 2025. Ada County had 541, Jerome 468, Twin Falls 438, Gooding 405 and Canyon 328 (our calculation).736 Canyon's low figure matches its role as the Treasure Valley's largest bedroom county.
Wages against home prices and rents
Pay rose fast in Idaho after 2019, faster than prices in general. Housing rose faster still.
How we figured it: real pay and pay-based ratios
Real dollars remove general inflation so different years can be compared. This module uses one deflator, the BLS Consumer Price Index for All Urban Consumers (CPI-U), U.S. city average, all items, annual average (series CUUR0000SA0). The 2025 annual average is 321.943 and the 2019 annual average is 255.657.37
real = nominal x (CPI 2025 / CPI year). Example: Idaho's 2019 average annual pay of $44,264 x (321.943 / 255.657) = $55,741 in 2025 dollars.
Value-to-pay ratio (our calculation) = ACS median home value (table B25077) divided by QCEW average annual pay per job. Rent-to-pay share (our calculation) = ACS median gross rent (table B25064) x 12, divided by QCEW average annual pay. Average pay per job is not household income: a household may have two earners or none, and a worker may hold two jobs. These ratios compare the price of housing in a place with what the jobs in that place pay. For household-income ratios, see Prices and Rents vs. Inflation.
Real pay, 2019 to 2025
| Area | Average annual pay 2019 (nominal) | 2019 pay in 2025 dollars | Average annual pay 2025 | Real change, 2019 to 2025 |
|---|---|---|---|---|
| United States | $59,209 | $74,561 | $78,720 | 5.6% |
| Idaho | $44,264 | $55,741 | $62,392 | 11.9% |
| Ada | $51,969 | $65,443 | $73,786 | 12.7% |
| Canyon | $37,898 | $47,724 | $54,271 | 13.7% |
| Jerome | $39,723 | $50,022 | $54,347 | 8.6% |
| Twin Falls | $36,641 | $46,141 | $50,136 | 8.7% |
| Gooding | $37,187 | $46,829 | $52,022 | 11.1% |
| Lincoln | $37,345 | $47,028 | $50,392 | 7.2% |
| Minidoka | $38,908 | $48,996 | $52,213 | 6.6% |
| Cassia | $37,900 | $47,727 | $52,100 | 9.2% |
| Kootenai | $40,909 | $51,516 | $59,140 | 14.8% |
| Bonneville | $39,756 | $50,064 | $51,060 | 2.0% |
| Bannock | $37,816 | $47,621 | $50,030 | 5.1% |
| Blaine | $43,723 | $55,059 | $62,702 | 13.9% |
Sources: BLS QCEW annual averages 2019 and 2025, all industries, all ownerships; CPI-U annual averages; real values are our calculation.6737
Idaho's real average pay grew about twice as fast as the nation's, which narrowed but did not close the gap: Idaho's 2025 average was 79 percent of the U.S. figure, up from 75 percent in 2019. Average pay can rise for two reasons that look the same in this table: workers getting raises, or low-paid jobs making up a smaller share of all jobs. Both happened after 2019, and QCEW alone cannot separate them.
What a year's pay buys
| Area | Median home value 2025 (ACS 1-year, MOE) | Median gross rent 2025 (MOE) | Average annual pay 2025 (QCEW) | Home value to pay | Rent as share of pay |
|---|---|---|---|---|---|
| United States | $371,100 (plus or minus $646) | $1,557 (plus or minus $4) | $78,720 | 4.71 | 23.7% |
| Idaho | $457,800 (plus or minus $6,135) | $1,462 (plus or minus $31) | $62,392 | 7.34 | 28.1% |
| Ada | $544,500 (plus or minus $8,552) | $1,765 (plus or minus $36) | $73,786 | 7.38 | 28.7% |
| Canyon | $427,600 (plus or minus $8,564) | $1,547 (plus or minus $84) | $54,271 | 7.88 | 34.2% |
| Twin Falls | $363,400 (plus or minus $13,321) | $1,176 (plus or minus $84) | $50,136 | 7.25 | 28.1% |
| Kootenai | $569,000 (plus or minus $28,500) | $1,645 (plus or minus $71) | $59,140 | 9.62 | 33.4% |
| Bonneville | $422,300 (plus or minus $20,633) | $1,424 (plus or minus $119) | $51,060 | 8.27 | 33.5% |
| Bannock | $332,500 (plus or minus $11,258) | $1,091 (plus or minus $97) | $50,030 | 6.65 | 26.2% |
| Utah | $543,400 (plus or minus $4,242) | $1,646 (plus or minus $22) | $69,316 | 7.84 | 28.5% |
| Montana | $427,500 (plus or minus $6,599) | $1,208 (plus or minus $43) | $62,882 | 6.80 | 23.1% |
| Washington | $605,600 (plus or minus $4,205) | $1,873 (plus or minus $16) | $99,675 | 6.08 | 22.5% |
| Oregon | $507,900 (plus or minus $4,066) | $1,629 (plus or minus $18) | $73,706 | 6.89 | 26.5% |
| Nevada | $459,400 (plus or minus $5,404) | $1,692 (plus or minus $21) | $69,776 | 6.58 | 29.1% |
| Wyoming | $357,300 (plus or minus $9,475) | $1,087 (plus or minus $57) | $63,535 | 5.62 | 20.5% |
Sources: ACS 2025 1-year, tables B25077 and B25064; BLS QCEW 2025 annual averages; ratios are our calculations.8387
By this measure Idaho's median home was worth 7.3 years of average pay in 2025, more than any neighbor except Utah (7.8) and far above the U.S. (4.7). Washington's home values are higher than Idaho's, yet its value-to-pay ratio is lower because its jobs pay much more. Canyon County shows the commuter trade-off in one row: homes are cheaper than in Ada County, but jobs located in Canyon pay less, so the ratio is higher, which is part of why so many Canyon residents drive to Ada County jobs.
Smaller counties: the five-year view
Jerome, Gooding, Lincoln, Minidoka and Cassia are too small for 1-year ACS estimates. For them we compare the 2020 to 2024 5-year median value and rent with QCEW pay in 2022, the middle year of the five-year period. These ratios are not comparable with the 2025 table above.
| Area | Median home value, 2020 to 2024 (MOE) | Median gross rent, 2020 to 2024 (MOE) | Average annual pay 2022 | Value to pay | Rent as share of pay |
|---|---|---|---|---|---|
| United States | $332,700 (plus or minus $236) | $1,413 (plus or minus $2) | $69,986 | 4.75 | 24.2% |
| Idaho | $418,600 (plus or minus $2,550) | $1,238 (plus or minus $16) | $54,236 | 7.72 | 27.4% |
| Jerome | $271,800 (plus or minus $16,969) | $966 (plus or minus $81) | $47,397 | 5.73 | 24.5% |
| Twin Falls | $337,900 (plus or minus $8,873) | $1,089 (plus or minus $35) | $44,483 | 7.60 | 29.4% |
| Gooding | $250,900 (plus or minus $25,286) | $880 (plus or minus $62) | $44,082 | 5.69 | 24.0% |
| Lincoln | $255,600 (plus or minus $15,905) | $1,021 (plus or minus $121) | $46,280 | 5.52 | 26.5% |
| Minidoka | $262,600 (plus or minus $17,480) | $900 (plus or minus $51) | $45,053 | 5.83 | 24.0% |
| Cassia | $284,600 (plus or minus $17,279) | $1,000 (plus or minus $64) | $44,771 | 6.36 | 26.8% |
| Blaine | $735,300 (plus or minus $68,817) | $1,338 (plus or minus $227) | $57,001 | 12.90 | 28.2% |
| Ada | $512,300 (plus or minus $8,186) | $1,577 (plus or minus $32) | $63,343 | 8.09 | 29.9% |
| Canyon | $390,000 (plus or minus $4,957) | $1,347 (plus or minus $33) | $47,092 | 8.28 | 34.3% |
Sources: ACS 2020 to 2024 5-year, tables B25077 and B25064; BLS QCEW 2022 annual averages; ratios are our calculations.283940
On this measure Jerome County was one of the more affordable places to live relative to local pay, at 5.7 years of pay for the median home, compared with 7.6 in Twin Falls County. Combined with the commuting data, that suggests a reason for the two-way flow: Twin Falls County residents take jobs in Jerome County, and some Jerome County workers live in Twin Falls for its services and housing choices. Neither dataset records why people choose where to live, so treat that as a question to ask; the data do not answer it. Jerome's margin of error on median value, plus or minus $16,969, is large enough that its ranking against Gooding, Lincoln and Minidoka is not certain.
Pictures, Numbers and Infographics
| Measure | U.S. | Idaho | Place | Year | Source |
|---|---|---|---|---|---|
| Jobs located in area | 155,732,363 (QCEW) | 849,662 (LODES); 874,283 (QCEW 2025) | Jerome County 11,440 (LODES) | 2024 | LODES 8; QCEW17 |
| Share of area's jobs held by in-commuters | not applicable | 5.4% (out-of-state residents) | Jerome County 62.2%; Canyon 44.2% | 2024 | LODES 8, our tabulation1 |
| Work-to-residence ratio | not applicable | 0.98 | Ada 1.20; Canyon 0.77; Jerome 1.00; Kuna 0.33 | 2024 | LODES 8, our calculation1 |
| Canyon residents' jobs in Ada County | not applicable | not applicable | 55,263 (29,478 in 2010) | 2024 | LODES 83 |
| Worked from home | 12.9% | 12.8% | Ada County 18.2% | 2025 | ACS 1-year B083015 |
| Mean one-way commute (minutes) | 27.4 | 22.7 | Ada County 21.7 | 2025 | ACS 1-year B08013, B0830117 |
| Commute of 30 minutes or more | 39.2% | 29.0% | Canyon County 45.9% | 2025 | ACS 1-year B0830316 |
| Job growth, 2019 to 2025 | 5.1% | 16.2% | Jerome County 17.7%; Canyon 26.0% | 2019 to 2025 | QCEW67 |
| Dairy cattle and milk production, share of jobs | 0.07% | 0.85% | Gooding County 18.5%; Jerome 11.8% | 2025 | QCEW NAICS 112127 |
| Real change in average annual pay | 5.6% | 11.9% | Jerome County 8.6% | 2019 to 2025 | QCEW, CPI-U737 |
| Median home value to average pay | 4.71 | 7.34 | Twin Falls County 7.25 | 2025 | ACS B25077, QCEW8 |
| Jobs added per housing unit added | 1.97 | 1.13 | Jerome County 3.19; Canyon 0.72 | 2021 to 2025 | QCEW, Census housing unit estimates27 |
| Milk cows | 9,498,000 | 714,000 (third in milk production) | no county estimate used | 2025 | USDA NASS31 |
| Hired farm workers | not compared | 42,990 on 5,697 farms | Jerome County: 40% of farms hire labor | 2022 | Census of Agriculture3032 |
The share of Idaho's jobs held by out-of-state residents is 45,964 divided by 849,662 (our calculation). The statewide work-to-residence ratio is 849,662 divided by 869,460.

Common mistakes
These are general pitfalls in reading job and commuting data, each shown with a real Idaho number from this lesson. None is attributed to a particular report or news story.
Calling LODES jobs "workers"
LODES All Jobs counts jobs. A person with a day job in Twin Falls and a weekend job in Jerome is two jobs, in two counties. In 2024 the All Jobs file put 11,440 jobs in Jerome County and the Primary Jobs file put 10,529 there.111 Say "jobs held by Canyon County residents," not "Canyon County workers," unless you used the Primary Jobs file.
Reporting only the net flow
Jerome County's 2024 inflow (7,116) and outflow (7,067) nearly cancel, so a "net commuting" number of 49 would suggest almost nobody crosses the county line. In fact more than 14,000 jobs involve a crossing in one direction or the other.1 Report inflow, outflow and live-and-work separately.
Comparing LODES earnings bands across years without inflation
LODES sorts jobs into three monthly earnings bands with the same dollar boundaries in every year of the files: $1,250 or less, $1,251 to $3,333, and more than $3,333.9 Because the line does not move with inflation, more jobs cross it every year even if real pay does not change. In Jerome County the share of jobs paying more than $3,333 a month rose from 40.8 percent in 2019 to 59.4 percent in 2024; in Twin Falls County it rose from 32.8 to 48.5 percent.211 The CPI-U rose 22.7 percent over the same years (313.689 for 2024 vs. 255.657 for 2019, our calculation).37 Part of the shift is real wage growth and part is inflation, and the bands alone cannot separate them. Use QCEW average pay, deflated with the CPI-U, to measure real pay.
Mixing LODES and QCEW job counts
LODES put 849,662 jobs in Idaho in 2024. QCEW, which counts covered jobs differently and averages over the year, reported 858,504 for the same year and 874,283 for 2025; for Jerome County the 2024 counts were 11,440 (LODES) and 12,175 (QCEW).1417 A story that subtracts one from the other to find "jobs added" is comparing two different measures. Use one dataset for any change over time.
Ignoring the margin of error in small places
The ACS 2020 to 2024 estimate of Hagerman residents who worked from home is 24, plus or minus 23. The true number could plausibly be anywhere from about 1 to 47. Ranking Hagerman against Kimberly (299, plus or minus 142) on that basis is not supported.25 For places under 65,000 people, use the 5-year file, print the margin of error, and do not compare a 5-year estimate with a 1-year estimate for a larger place as if they described the same year.
Treating "not published" as zero
QCEW withholds industry figures that would reveal a single employer. Jerome County's agriculture, forestry, fishing and hunting total was published for 2019 (2,895 jobs) but withheld for 2025, even though the dairy cattle line inside it was published (1,450 jobs).67 A spreadsheet that reads the withheld cell as zero would show agriculture vanishing from Jerome County. It did not.
Missing a change in how an employer is classified
In Kootenai County, QCEW local government jobs fell from 9,969 in 2019 to 6,819 in 2025 while private health care and social assistance jobs rose from 7,865 to 13,452.67 That pattern is consistent with an employer moving from public to private ownership in the data, and a reporter should confirm the cause with the Idaho Department of Labor before writing that local government shed 3,150 jobs. One likely cause is on the public record: Kootenai Health, the county's hospital system with more than 4,000 employees, changed from a public hospital district to a private nonprofit on Jan. 1, 2024.43 QCEW does not name employers, so how many of the 3,150 jobs that conversion accounts for is not published.
Starting a LODES trend too early
LODES files go back to 2002, but federal jobs are included only from 2010 on, and some early county-to-county flows jump in ways that look like changes in how employer work sites were coded. For example, our tabulation shows Jerome residents' jobs in Twin Falls County at 1,206 in 2002 and 3,717 in 2006, then 2,259 in 2010.93 This lesson's trends start in 2010 for that reason.
Using average pay per job as household income
QCEW average annual pay is total covered wages divided by average jobs. It leaves out the self-employed, retirement income, investment income and second earners. The ratios in this lesson compare housing with job pay; affordability for households is measured with ACS household income in Prices and Rents vs. Inflation.
What we know, what we don't, and what the data can show
What we know
- The Canyon to Ada job flow grew from 29,478 in 2010 to 55,263 in 2024, and the Ada to Canyon flow grew from 12,634 to 26,312 (LODES 8).3
- The share of Canyon County residents' Idaho jobs located in Ada County leveled off at about 48 percent from 2019 to 2024 (LODES 8).3
- Jerome County's jobs grew faster than its housing: 1,351 jobs (QCEW) against 424 housing units (Census estimates) from 2021 to 2025, and in-commuters filled 62.2 percent of its jobs in 2024, up from 57.2 percent in 2010.7273
- About 3,270 jobs crossed each way between Jerome and Twin Falls counties in 2024.1
- Idaho's work-from-home share rose from 7.4 percent in 2019 to 12.8 percent in 2025 (ACS 1-year), and Magic Valley counties have the lowest shares in the state's comparison set.525
- Idaho jobs grew 16.2 percent from 2019 to 2025 vs. 5.1 percent for the U.S. (QCEW), and Idaho's real average pay rose 11.9 percent vs. 5.6 percent.737
- Dairy cattle and milk production is 18.5 percent of covered jobs in Gooding County and 11.8 percent in Jerome County (QCEW 2025).7
What we don't know
- Why people live where they do. No federal dataset records whether a Jerome worker lives in Twin Falls by choice or because no housing was available in Jerome.
- How many in-commuters would move closer to work if housing were available, and at what price.
- How many workers are missing from the job data: farm owners, other self-employed people, workers paid off the books and some farm workers outside unemployment insurance coverage.
- Where remote workers' jobs are counted. LODES places a job at the work site the employer reports, so an Idaho resident working from home for an employer based in another state may appear as an out-of-state job.
- Commute flows for 2025. LODES job year 2024 is the newest as of Nov. 17, 2026.
- Immigration status of farm and dairy workers. The figures quoted in this lesson come from an industry group and a university report requested by industry groups, not from a federal count.
- Why the Idaho Department of Labor's 2023 count of Jerome County residents working in the city of Twin Falls (2,593) is 16 jobs lower than our tabulation of the same year's LODES files (2,609).
What the data can show
- Which towns are becoming bedroom communities: the work-to-residence ratio and the live-and-work share from LEHD LODES (OnTheMap), tracked yearly since 2010.
- Whether housing keeps pace with jobs, county by county: QCEW job counts against Census housing unit estimates and the Census Building Permits Survey.
- Whether pay in a county keeps up with its housing costs: QCEW average annual pay, deflated with the CPI-U, against ACS median value (B25077) and median gross rent (B25064).
- How long commutes take and how people make them: ACS tables B08301, B08303 and B08013, 1-year for large areas and 5-year for small towns.
- Which industries a county depends on, and how specialized it is: QCEW by NAICS industry, with location quotients.
- Whether a new plant changes commuting: compare LODES flows into the plant's census blocks before and after it opens, when the job years are available.
Questions people ask
If I work from home, am I in OnTheMap?
Yes, if your job is covered by unemployment insurance or is a federal job. LODES places your job at the work site your employer reports, not at your house. If your employer's Idaho office is in Boise, your job counts in Boise even if you work from your kitchen in Kuna. If your employer is in another state, your job may appear there. The ACS, by contrast, records you as someone who worked from home.915
How many people commute between Jerome and Twin Falls?
In 2024, 3,266 jobs in Twin Falls County were held by Jerome County residents and 3,288 jobs in Jerome County were held by Twin Falls County residents (LODES All Jobs, our tabulation). At the city level, 1,301 jobs in the city of Twin Falls were held by residents of the city of Jerome, and 1,022 jobs in the city of Jerome were held by residents of the city of Twin Falls.114
Why do job numbers from different agencies not match?
They count different things. QCEW counts jobs on covered payrolls averaged over the year at the work site. LODES counts jobs from state unemployment insurance records and federal personnel records, places them by work and home block, and adds confidentiality noise. The ACS counts people, from a survey, by where they live. BEA adds the self-employed. A difference of a few percent between them is normal; pick one source for any comparison over time and say which one you used.
Is my town a bedroom community?
Divide the jobs located in the town by the jobs held by its residents (both in OnTheMap's "Inflow/Outflow" report). Well below 1.0 means the town exports most of its workers: Kuna (0.33), Star (0.42), Middleton (0.45), Filer (0.50), Buhl (0.55) and Kimberly (0.56) in 2024. A step-by-step guide to pulling these numbers for any town is in Build Your Own Growth Profile.110
Are dairy and farm jobs counted?
Partly. QCEW and LODES include farm jobs on payrolls covered by unemployment insurance, which is why QCEW shows 7,406 dairy cattle and milk production jobs in Idaho in 2025. They exclude farm owners and some farm workers. The Census of Agriculture counted 42,990 hired farm workers in Idaho in 2022 by asking farms directly.73019
Does a long commute mean housing is too expensive?
Not by itself. Some people choose a longer drive for a larger lot, a school district or to live near family. The data can show the pattern: Canyon County has more residents than jobs, the longest average commute of the large counties, and lower home prices than Ada County. Whether that is choice or constraint takes local reporting and surveys to answer.1168
When will newer numbers come out?
QCEW publishes county data quarterly; the 2025 annual averages used here are the newest full year. The ACS usually releases 1-year estimates each September and 5-year estimates each December, but the 2025 1-year estimates came out late, on Oct. 29, 2026, and as of Nov. 17, 2026 the Census Bureau had not yet scheduled the 2021 to 2025 5-year release.44 LODES adds one job year at a time; check the LEHD data page for the job years available before citing "the newest" flows.79
Hard questions
Should a county require housing when it approves a large new employer?
The case for requiring it: Jerome County added about three jobs per new housing unit from 2021 to 2025, and in-commuters now fill 62 percent of its jobs. Residents and workers bear the cost in driving time, road wear and rents. An employer that brings hundreds of jobs could build or fund workforce housing.
The case against: Employers already pay wages and taxes, Twin Falls is close, and the two counties work as one labor market; requiring housing could push a plant to another state. Housing is better left to builders responding to demand, with cities clearing the way through zoning.
What the evidence shows: The commuting data show the cost is real but spread across two counties: 3,288 Twin Falls County residents hold jobs in Jerome County. Jerome County's housing is cheaper relative to local pay (5.7 years of pay) than Twin Falls County's (7.6), so price alone does not explain the in-commuting. The incentive agreements and what they require are in Economic Development and Housing Pressure.128
Is the Canyon to Ada commute a road problem or a jobs problem?
The case for roads: 55,263 Canyon residents' jobs are in Ada County, and 45.9 percent of Canyon commuters travel 30 minutes or more. Widening and new interchanges serve the trips people are already making.
The case for jobs in Canyon: Every job located in Canyon County is a trip that does not cross the county line. Canyon County's own job count grew 26.0 percent from 2019 to 2025, faster than Ada's 16.7 percent, and the share of Canyon residents' jobs in Ada has leveled off since 2019.
What the evidence shows: Both are happening. The flow to Ada keeps growing in absolute numbers while Canyon's own jobs grow faster. Neither trend has reversed the other. Road funding questions are covered in Idaho Roads and Highway Funding.3716
Do jobs follow people, or do people follow jobs?
People follow jobs: Jerome County's processing and dairy jobs grew first and in-commuting grew with them; people come where the work is.
Jobs follow people: Construction, health care and retail jobs grew fastest in Idaho after 2019, and those industries serve residents. Canyon County's construction jobs grew 59.4 percent from 2019 to 2025 as its population grew.
What the evidence shows: In Idaho since 2019, both. Construction (up 42.2 percent statewide) and health care (up 28.6 percent) are population-serving and grew fastest, while Magic Valley food processing grew where plants chose to expand. Lesson 06, Who Is Moving In and From Where, shows how many new residents came from other states.67
Is work from home good for rural Idaho?
The case for: Remote workers bring outside paychecks into small towns, spend locally and do not add to rush-hour traffic.
The case against: Remote workers paid on big-city salaries can bid up home prices beyond what local jobs pay, and they may not use or support local businesses as much as hoped.
What the evidence shows: In the Magic Valley, remote work is still uncommon (4.7 to 8.9 percent of workers in the core counties, 2020 to 2024), so it is not yet a large force there. It is concentrated in Ada County and its suburbs, Eagle (28.6 percent) and Star (21.2 percent).25
For reporters and advocates
Public data you can use today, free:
- OnTheMap (onthemap.ces.census.gov): draw or select a city or county, choose "Inflow/Outflow," and pick All Jobs or Primary Jobs and a year. Export the results; note the job type and year in your story.10
- LODES raw files for repeatable analysis across many towns and years, with the technical document.9
- QCEW county files for jobs and pay by industry, quarterly and annual.7
- ACS tables B08301, B08303 and B08013 on data.census.gov for commute mode and time; use 5-year data for towns.25
- Idaho Department of Labor county workforce profiles and staff economists at lmi.idaho.gov.20
Public records worth requesting under the Idaho Public Records Act, Idaho Code Title 74, Chapter 1 (how to file is in Idaho Public Records Requests):
- City and county building permit logs, to compare new homes with the job counts above.
- Incentive agreements and annual job and wage reports for employers that received state or local incentives, including the Idaho Department of Commerce's Tax Reimbursement Incentive reports.
- Conditional use permits, development agreements and annexation ordinances for new plants and dairies, which may include worker housing conditions.
- Transportation studies and traffic counts held by the Idaho Transportation Department, highway districts and the regional planning organization for Ada and Canyon counties, the Community Planning Association of Southwest Idaho (COMPASS).
- School district enrollment and transfer data, which show where families move (see Water, Schools and Roads).
Questions to ask officials: How many of the jobs at this new facility are expected to be filled by people already living in the county? What is the expected pay, and how does it compare with the county's median rent and home value? Does the incentive agreement say anything about housing? What share of the city's jobs are held by people who live in the city, and is that share going up or down? How is the county planning for the road traffic between Jerome and Twin Falls?
The Idaho and Magic Valley angle: Jerome County is a test case for job growth outrunning home building in a rural county, with a near-perfect two-way exchange of workers with Twin Falls County. Canyon County is the opposite case: home building outrunning local jobs. Both show up clearly in public data that any reporter can pull in an afternoon. The local government offices that make these decisions are described in Local Government, and statistics basics for reporters are in the training course Data and Statistics.
Where to go next
- OnTheMap (U.S. Census Bureau): Free web tool for anyone. Select a city or county, choose Inflow/Outflow or Home/Work Area, pick All Jobs or Primary Jobs and a year, and export the report. The fastest way to see where a town's workers live and work.
- LEHD data page (U.S. Census Bureau): Free raw LODES files and documentation for analysts and reporters who want to repeat a tabulation across many towns or years. Needs a spreadsheet or a short script.
- data.census.gov (U.S. Census Bureau): Free. Search table numbers such as B08301, B08303 and B08013 for commuting, or B25077 and B25064 for home values and rents, and choose the 1-year or 5-year product and your geography. Shows margins of error.
- Quarterly Census of Employment and Wages (BLS): Free county jobs and pay by industry, quarterly and annual, with data viewers and downloadable files. Best source for industry mix and average pay where the job is.
- Idaho Department of Labor, labor market information: Free Idaho county workforce profiles, publications and data tools from the state's labor economists; useful for local context and for questions about Idaho series.
- Census commuting guidance (U.S. Census Bureau): Free guidance on which Census products cover commuting and how to use them, with links to commuting flows and home-based worker data.
- Census of Agriculture (USDA NASS): Free county tables every five years (latest 2022, next 2027), including hired farm labor, number of farms and sales by commodity; county profiles summarize each county on two pages.
Still being checked (2 items)
These points could not be fully confirmed against a primary source when this lesson was written and fact checked in November 2026. The text above states each one as uncertain.
- The Idaho Dairymen's Association figure that 90 percent of Idaho dairy workers are foreign-born comes from a July 2024 news report quoting the association; we did not see the association's own publication.
- The Idaho Department of Labor's Jerome County profile counts 2,593 Jerome County residents working in the city of Twin Falls in 2023; our LODES 8 tabulation of the same year gives 2,609. The reason for the 16-job difference (file version or boundary matching) was not confirmed.
Last verified November 17, 2026. General education, not legal, financial or real estate advice; every figure names its source and year in the Notes and Sources below. Data is revised: check the newest release before relying on any number.
Notes
- U.S. Census Bureau, Longitudinal Employer-Household Dynamics (LEHD), LODES Version 8.5, Idaho origin-destination files id_od_main_JT00_2024.csv.gz and id_od_aux_JT00_2024.csv.gz (All Jobs, job year 2024; Idaho 2024 files posted Oct. 14, 2026); county and city totals are our tabulation (read Nov. 17, 2026). Read it online. ↩
- U.S. Census Bureau, LEHD, LODES Version 8.5, auxiliary origin-destination files of the other 49 states and the District of Columbia, All Jobs, 2024 (no files are published for Alaska, or for Michigan in 2022 to 2024); rows with an Idaho home block were summed by us to get Idaho residents' out-of-state jobs (read Nov. 17, 2026). Read it online. ↩
- U.S. Census Bureau, LEHD, LODES Version 8.5, Idaho origin-destination main and auxiliary files, All Jobs, job years 2002, 2006, 2010, 2014, 2019, 2021, 2023 and 2024; county-to-county flows are our tabulation (read Nov. 17, 2026). Read it online. ↩
- U.S. Census Bureau, American Community Survey 2019 1-year estimates, table B08301, Means of Transportation to Work, table-based summary file (prototype release); U.S., states, Ada County and Boise city (read Nov. 17, 2026). Read it online. ↩
- U.S. Census Bureau, American Community Survey 2025 1-year estimates, table B08301, Means of Transportation to Work, table-based summary file; U.S., states, Ada County and Boise city (read Nov. 17, 2026). Read it online. ↩
- U.S. Bureau of Labor Statistics, Quarterly Census of Employment and Wages (QCEW), 2019 annual averages, open data area files for the U.S. (US000), Idaho (16000), Idaho counties and six neighbor states (read Nov. 17, 2026). Read it online. ↩
- U.S. Bureau of Labor Statistics, QCEW, 2025 annual averages, open data area files for the U.S., Idaho, Idaho counties and six neighbor states; industry rows are private ownership (own_code 5), totals are all ownerships (read Nov. 17, 2026). Read it online. ↩
- U.S. Census Bureau, ACS 2025 1-year estimates, table B25077, Median Value (Dollars), owner-occupied housing units, table-based summary file (read Nov. 17, 2026). Read it online. ↩
- U.S. Census Bureau, LEHD, LEHD Origin-Destination Employment Statistics (LODES) Dataset Structure, Format Version 8.5, revised Oct. 19, 2026: file types, job types JT00 to JT05, years 2002 to 2024, federal jobs from 2010, states without data by year (read Nov. 17, 2026). Read it online. ↩
- U.S. Census Bureau, OnTheMap web application (free; Inflow/Outflow and Home/Work Area reports) (read Nov. 17, 2026). Read it online. ↩
- U.S. Census Bureau, LEHD, LODES Version 8.5, Idaho origin-destination files, Primary Jobs (JT01), 2024; our tabulation (read Nov. 17, 2026). Read it online. ↩
- U.S. Census Bureau, LEHD, LODES Version 8.5, Idaho origin-destination main and auxiliary files and other states' auxiliary files, All Jobs, 2023; our tabulation of Jerome County gives 10,794 jobs located, 4,253 live and work, 6,541 inflow and 6,919 outflow (read Nov. 17, 2026). Read it online. ↩
- U.S. Census Bureau, LEHD, LODES Version 8.5, other states' auxiliary origin-destination files, All Jobs, 2023; needed to count Idaho residents' out-of-state jobs (read Nov. 17, 2026). Read it online. ↩
- U.S. Census Bureau, LEHD, LODES Version 8.5 Idaho geography crosswalk id_xwalk.csv.gz (2020 census blocks to counties and places, 2025 TIGER/Line geography) (read Nov. 17, 2026). Read it online. ↩
- U.S. Census Bureau, "Commuting: Guidance for Data Users," Commuting topic pages (read Nov. 17, 2026). Read it online. ↩
- U.S. Census Bureau, ACS 2025 1-year estimates, table B08303, Travel Time to Work, table-based summary file; shares of commuters at 30 minutes or more are our calculation (read Nov. 17, 2026). Read it online. ↩
- U.S. Census Bureau, ACS 2025 1-year estimates, table B08013, Aggregate Travel Time to Work (in Minutes) of Workers; mean commute is our calculation (aggregate minutes divided by workers in B08301 minus those who worked from home) (read Nov. 17, 2026). Read it online. ↩
- U.S. Bureau of Labor Statistics, Handbook of Methods, "Quarterly Census of Employment and Wages: Overview" (read Nov. 17, 2026). Read it online. ↩
- U.S. Bureau of Labor Statistics, Handbook of Methods, "Quarterly Census of Employment and Wages: Concepts" (coverage, exclusions and the pay period including the 12th of the month) (read Nov. 17, 2026). Read it online. ↩
- Idaho Department of Labor, Communications and Research, labor market information website (county workforce profiles and data tools) (read Nov. 17, 2026). Read it online. ↩
- U.S. Census Bureau, LEHD, LODES Version 8.5, Idaho origin-destination main and auxiliary files, All Jobs, 2019; our tabulation (read Nov. 17, 2026). Read it online. ↩
- U.S. Census Bureau, LEHD, LODES Version 8.5, other states' auxiliary origin-destination files, All Jobs, 2019 (Alaska not published); our tabulation (read Nov. 17, 2026). Read it online. ↩
- U.S. Census Bureau, ACS 2019 1-year estimates, table B08303, Travel Time to Work, table-based summary file (prototype release); shares are our calculation (read Nov. 17, 2026). Read it online. ↩
- U.S. Census Bureau, ACS 2020 to 2024 5-year estimates, table B08013, Aggregate Travel Time to Work; means are our calculation using B08301 (read Nov. 17, 2026). Read it online. ↩
- U.S. Census Bureau, ACS 2020 to 2024 5-year estimates, table B08301, Means of Transportation to Work, counties and places; margins of error as published, shares our calculation (read Nov. 17, 2026). Read it online. ↩
- U.S. Census Bureau, ACS 2019 1-year estimates, table B08013, Aggregate Travel Time to Work, table-based summary file (prototype release); means our calculation (read Nov. 17, 2026). Read it online. ↩
- U.S. Census Bureau, Population Estimates Program, Vintage 2025, Annual Estimates of Housing Units for Counties in Idaho: April 1, 2020 to July 1, 2025 (CO-EST2025-HU-16) (read Nov. 17, 2026). Read it online. ↩
- U.S. Census Bureau, ACS 2020 to 2024 5-year estimates, table B25077, Median Value (Dollars), with margins of error (read Nov. 17, 2026). Read it online. ↩
- USDA National Agricultural Statistics Service, 2022 Census of Agriculture, Idaho, Volume 1, Chapter 1, Table 1, "Historical Highlights" (farms and land in farms, 2022 and 2017) (read Nov. 17, 2026). Read it online. ↩
- USDA National Agricultural Statistics Service, 2022 Census of Agriculture, Idaho, Volume 1, Chapter 2, Table 7, "Hired Farm Labor, Workers and Payroll: 2022," state total column (read Nov. 17, 2026). Read it online. ↩
- USDA National Agricultural Statistics Service, Milk Production, released Feb. 20, 2026, table "Milk Cows and Production, States and United States: 2024 and 2025" (read Nov. 17, 2026). Read it online. ↩
- USDA National Agricultural Statistics Service, 2022 Census of Agriculture County Profile: Jerome County, Idaho (read Nov. 17, 2026). Read it online. ↩
- Boise State Public Radio (story by the Idaho Capital Sun), "Unauthorized immigrants are key players in Idaho's economy, agricultural sector, study shows," July 5, 2024, reporting on the University of Idaho McClure Center report Idaho at a Glance: Unauthorized Immigrants and Idaho's Economy (June 2024) and citing Idaho Dairymen's Association workforce figures (industry source) (read Nov. 17, 2026). Read it online. ↩
- U.S. Bureau of Labor Statistics, QCEW, 2021 annual averages, open data area files for the U.S., Idaho and Idaho counties (read Nov. 17, 2026). Read it online. ↩
- U.S. Census Bureau, Population Estimates Program, Vintage 2025, Annual Estimates of Housing Units for the United States, Regions, States, and the District of Columbia: April 1, 2020 to July 1, 2025 (NST-EST2025-HU) (read Nov. 17, 2026). Read it online. ↩
- U.S. Census Bureau, Population Estimates Program, Vintage 2025, Annual Estimates of the Resident Population for Counties in Idaho: April 1, 2020 to July 1, 2025 (CO-EST2025-POP-16) (read Nov. 17, 2026). Read it online. ↩
- U.S. Bureau of Labor Statistics, Consumer Price Index for All Urban Consumers (CPI-U), U.S. city average, all items, not seasonally adjusted, series CUUR0000SA0, annual averages: 2019 = 255.657, 2021 = 270.970, 2022 = 292.655, 2024 = 313.689, 2025 = 321.943 (read Nov. 17, 2026). Read it online. ↩
- U.S. Census Bureau, ACS 2025 1-year estimates, table B25064, Median Gross Rent (Dollars), renter-occupied units paying cash rent (read Nov. 17, 2026). Read it online. ↩
- U.S. Census Bureau, ACS 2020 to 2024 5-year estimates, table B25064, Median Gross Rent (Dollars), with margins of error (read Nov. 17, 2026). Read it online. ↩
- U.S. Bureau of Labor Statistics, QCEW, 2022 annual averages, open data area files for the U.S., Idaho and Idaho counties (read Nov. 17, 2026). Read it online. ↩
- U.S. Bureau of Labor Statistics, QCEW, 2024 annual averages, open data area files for the U.S., Idaho and Idaho counties (read Nov. 17, 2026). Read it online. ↩
- Idaho Department of Labor, Communications and Research, Jerome County workforce profile, last updated August 2026: commuting patterns, 2023 (4,253 lived and worked in the county, 6,541 employed in the county but living outside, 6,919 commuted to other counties) and top cities where residents work (Twin Falls, 2,593, 23.2 percent), source U.S. Census Bureau LEHD (read Nov. 17, 2026). Read it online. ↩
- The Spokesman-Review, "Kootenai Health makes change from public-district hospital to nonprofit ahead of new CEO this spring," Jan. 10, 2024 (transition took effect Jan. 1, 2024; more than 4,000 employees) (read Nov. 17, 2026). Read it online. ↩
- U.S. Census Bureau, American Community Survey, "2025 Data Release Schedule" (2025 ACS 1-year estimates Oct. 29, 2026; release dates for the remaining 2025 ACS products "will be forthcoming") (read Nov. 17, 2026). Read it online. ↩
Check yourself
1. In 2024, how many jobs in Ada County were held by Canyon County residents, according to LODES All Jobs?
Our tabulation of Census LEHD LODES 8 Idaho origin-destination files (All Jobs, 2024) gives 55,263 jobs in Ada County held by Canyon County residents, up from 29,478 in 2010. 26,312 is the reverse flow and 119,743 is all jobs held by Canyon residents.
2. What does the LODES 'All Jobs' (JT00) file count?
The LODES Version 8.5 technical document describes the files as job totals by home and work block. In Jerome County in 2024 the All Jobs file had 11,440 jobs and the Primary Jobs (JT01) file had 10,529.
3. What share of the jobs located in Jerome County in 2024 were held by people who live outside the county?
LODES 8 All Jobs 2024, our tabulation: 7,116 of 11,440 jobs in Jerome County were held by in-commuters, 62.2 percent, up from 57.2 percent in 2010. 35.2 percent is Twin Falls County and 44.2 percent is Canyon County.
4. According to the ACS 2025 1-year estimates (table B08301), what share of Idaho workers worked from home?
ACS 2025 1-year B08301: 122,998 of 959,066 Idaho workers worked from home, 12.8 percent. Idaho's 2019 share was 7.4 percent, Ada County's 2025 share was 18.2 percent and the U.S. 2019 share was 5.7 percent.
5. Which of these counties had the lowest work-to-residence ratio (jobs located in the county divided by jobs held by its residents) in 2024?
Our calculation from LODES 8 All Jobs 2024: Lincoln 0.73 (1,966 jobs located, 2,701 held by residents), Canyon 0.77, Kootenai 0.93 and Jerome 1.00.
6. From 2021 to 2025, about how many jobs did Jerome County add for each housing unit it added?
QCEW jobs rose from 10,977 (2021) to 12,328 (2025), 1,351 jobs; Census Vintage 2025 housing unit estimates rose from 8,683 (July 1, 2021) to 9,107 (July 1, 2025), 424 units. 1,351 divided by 424 is 3.19 (our calculation). Canyon was 0.72 and Idaho 1.13.
7. Why can't the share of LODES jobs paying more than $3,333 a month be compared across years as a measure of real pay?
The LODES 8.5 technical document lists the same earnings bands for all years. With CPI-U up 22.7 percent from 2019 to 2024 (BLS series CUUR0000SA0), more jobs cross the fixed $3,333 line even without real raises; Jerome County's share rose from 40.8 to 59.4 percent.
8. In 2025, what share of all covered jobs in Gooding County were in dairy cattle and milk production (NAICS 11212)?
BLS QCEW 2025 annual averages: 1,236 dairy cattle and milk production jobs out of 6,664 total in Gooding County, 18.5 percent (our calculation). Jerome County was 11.8 percent, Twin Falls County 3.2 percent and Idaho 0.85 percent.
9. Which CPI-U annual average does this module use to convert to 2025 dollars?
BLS CPI-U, U.S. city average, all items, series CUUR0000SA0, 2025 annual average is 321.943. 255.657 is 2019, 313.689 is 2024 and 304.702 is 2023.
10. Which workers does the QCEW exclude?
The BLS Handbook of Methods, QCEW Concepts, says QCEW excludes proprietors, the unincorporated self-employed, unpaid family members, certain farm and domestic workers, and railroad workers covered by the railroad unemployment insurance system.
Terms in this lesson
- LEHD
- Longitudinal Employer-Household Dynamics, a Census Bureau program that links state unemployment insurance wage records with information on where workers live.
- LODES
- LEHD Origin-Destination Employment Statistics: public files that count jobs by the census block where the job is and the census block where the worker lives. Version 8.5 covers job years 2002 to 2024.
- OnTheMap
- The Census Bureau's free web application for mapping and reporting LODES data, including Inflow/Outflow reports for any city or county.
- All Jobs and Primary Jobs
- Two LODES job types. All Jobs (JT00) counts every job, so a worker with two jobs counts twice; Primary Jobs (JT01) is a separate file designed to count one job per worker.
- Inflow and outflow
- Inflow is jobs located in an area held by people who live elsewhere; outflow is jobs held by an area's residents that are located elsewhere.
- Live and work
- Jobs held by people who both live and work in the same county or city; sometimes called internal jobs.
- Work-to-residence ratio
- Our calculation: jobs located in an area divided by jobs held by its residents. Above 1.0 the area imports workers; below 1.0 it exports them.
- Bedroom community
- A town or county where many more residents work elsewhere than there are local jobs; in this lesson, a work-to-residence ratio well below 1.0.
- QCEW
- Quarterly Census of Employment and Wages, a BLS count of jobs and wages from employers' unemployment insurance reports, by industry and county, at the work site.
- Average annual pay
- Total covered wages divided by average covered jobs in a QCEW area and industry. It is pay per job, not household income.
- Location quotient
- An industry's share of local jobs divided by its share of U.S. jobs. A value of 1.0 means the local share equals the national share.
- NAICS
- The North American Industry Classification System, the code list QCEW uses for industries; for example 11212 is dairy cattle and milk production and 311 is food manufacturing.
- Suppressed (not published) cell
- A QCEW figure withheld because publishing it would reveal one employer's confidential data. It is not a zero.
- Mean travel time to work
- Our calculation from ACS tables: total minutes all commuters spend getting to work (B08013) divided by the number of workers who did not work from home (B08301).
Sources
- U.S. Census Bureau, LEHD Origin-Destination Employment Statistics (LODES) Version 8, data files (2026-11-17) checked 2026-11
- U.S. Census Bureau, LODES Dataset Structure, Format Version 8.5 (2026-10-19) checked 2026-11
- U.S. Census Bureau, OnTheMap (2026-11-17) checked 2026-11
- U.S. Census Bureau, American Community Survey 2025 1-year table-based summary file (2026-11-17) checked 2026-11
- U.S. Census Bureau, American Community Survey 2020 to 2024 5-year table-based summary file (2026-11-17) checked 2026-11
- U.S. Census Bureau, American Community Survey 2019 1-year table-based summary file (prototype) (2026-11-17) checked 2026-11
- U.S. Bureau of Labor Statistics, QCEW open data, annual area files (example: Idaho 2025) (2026-11-17) checked 2026-11
- U.S. Bureau of Labor Statistics, Handbook of Methods: Quarterly Census of Employment and Wages, Concepts (2026-11-17) checked 2026-11
- U.S. Census Bureau, Vintage 2025 housing unit estimates for Idaho counties (CO-EST2025-HU-16) (2026-11-17) checked 2026-11
- U.S. Bureau of Labor Statistics, CPI-U, U.S. city average, all items (CUUR0000SA0) (2026-11-17) checked 2026-11
- USDA NASS, Milk Production (Feb. 20, 2026) (2026-02-20) checked 2026-11
- USDA NASS, 2022 Census of Agriculture, Idaho, Table 7, Hired Farm Labor (2026-11-17) checked 2026-11
- USDA NASS, 2022 Census of Agriculture County Profile, Jerome County, Idaho (2026-11-17) checked 2026-11