Lesson 13 of 13 · about 55 minutes · Updated November 17, 2026
Build Your Own Growth Profile
You'll be able to
- Download population, housing unit and building permit data for an Idaho city and county from the Census Bureau, using one estimates vintage.
- Run an OnTheMap inflow and outflow analysis, or tabulate the raw LODES files, to show where a town's residents work.
- Pull ACS 5-year tables DP04, DP05, B25077, B25064, B19013 and S0801 with margins of error, and test whether two estimates differ.
- Convert FHFA index, HUD Fair Market Rent and BEA income figures to 2025 dollars with the CPI-U annual average.
- Compute permits per 1,000 residents, price-to-income and rent-to-income ratios and label them as your own calculations.
- Assemble a growth card that compares a town with its county, Idaho and the United States, and write it up fairly.
Start here: the short version
- A growth profile is one page of public numbers about one place, each with its year, its source table and a U.S. and Idaho comparison. Every number in this lesson's worked example for Kimberly, in Twin Falls County, came from a federal file you can download for free.
- Kimberly grew faster than almost anywhere around it. The Census Bureau estimates Kimberly at 5,798 residents on July 1, 2025, up 25.4 percent from its April 2020 base of 4,625. Idaho grew 10.4 percent and the United States 3.1 percent over the same span.12
- Kimberly permitted 502 new homes from 2020 to 2025, about 108.5 units for every 1,000 people it had in 2020. Idaho's rate was 61.5 and the nation's 28.1 (our calculation from the Census Building Permits Survey).34
- Most working Kimberly residents leave town for work. In 2024, 197 people both lived and worked in Kimberly, 1,080 came in to work and 2,014 went out to jobs elsewhere in Idaho, just over half of them (1,042) to the city of Twin Falls (our tabulation of Census LODES files).5
- Small towns come with wide error bands. The American Community Survey puts Kimberly's median household income at $97,799 for 2020 to 2024, plus or minus $34,495. A plausible range runs from about $63,000 to $132,000, so any ratio built on it is soft.6
- Use one deflator. This module converts dollars with the BLS CPI-U annual average; the 2025 value is 321.943, an average of 11 months because October 2025 was never collected.78
- The last step is the write-up. A fair profile says what grew, what it cost and whom it helped, and lists what the data cannot show.
Data used: Census Vintage 2025 population and housing unit estimates (released May 14, 2026); 2020 and 2010 census redistricting files; Census Building Permits Survey annual files for 2020 to 2025; LODES 8 origin-destination files for 2023 and 2024; American Community Survey 2020 to 2024 5-year estimates; FHFA all-transactions House Price Index through 2026 Q2; HUD Fair Market Rents for FY2020, FY2025 and FY2026; BEA CAINC1 county personal income through 2024; 2022 Census of Agriculture; Census Gazetteer files for 2020 and 2025; BLS CPI-U annual average 2025 = 321.943. All checked Nov. 17, 2026. Agencies revise data; newer releases may differ.
Most arguments about growth in Idaho start with a number someone heard: a town "doubled," rents "tripled," "everyone is from California." Some of those numbers are right, some are wrong, and many are right about one place and wrong about another. The cure is to build the numbers yourself from the agencies that publish them, write down where each came from, and put the town next to Idaho and the United States so the reader can see whether it is unusual.
This lesson walks through that work step by step, with the exact files, menus, table IDs and column names, and then does it for one town. The town is Kimberly, a city of about 5,800 people just east of the city of Twin Falls, chosen because it is small enough to show every problem a small place brings (wide margins of error, no house price index of its own, counts too small for some tables) and because it grew fast enough to make the numbers interesting. Gooding, the county seat of Gooding County, appears beside it as a contrast: a town of similar size that grew slowly.
The lesson builds on the module's first lesson, How to Measure Growth Without Fooling Yourself, which explains why each measure behaves as it does, and on the Magic Valley case study in lesson 04, which tells Kimberly's history. The general skills of finding data, building spreadsheets and charting honestly are in the training course Data and Statistics for Reporters and Citizens. When a number lives in a city or county office instead of a federal file, the Idaho Public Records Act is the tool, covered in Idaho Public Records Requests.


What goes on a growth card
A growth card is a one-page summary of a place: how many people, how many homes, how fast each grew, how many homes were permitted, where residents work, what homes and rents cost, what people earn, and what happened to nearby farmland. Each line carries three numbers (the place, Idaho and the United States), the year, and a note naming the table. The card is the product. The workbook behind it is the proof.
The table below is the template. Each row is a measure, the agency file it comes from, the table or series ID, the smallest geography the file covers, how often it is updated, and the trap to watch. Copy it into the first tab of your workbook and fill in the last two columns (value and note number) as you go.
| Measure | Source and table or series ID | Smallest geography | Updated | Newest release (Nov. 2026) | Watch for |
|---|---|---|---|---|---|
| Population, census count | Decennial census, table P1 (2020 redistricting file or data.census.gov table DECENNIALPL2020.P1) | Block | Every 10 years | April 1, 2020 | A count, not an estimate; city boundaries as of 2020 |
| Population, annual | Census population estimates, SUB-EST2025 (places), CO-EST2025 (counties), NST-EST2025 (states) | Incorporated place | Yearly (May for places) | Vintage 2025 (July 1, 2025) | Each vintage revises every earlier year; use one vintage |
| Housing units, count | Decennial census, table H1 | Block | Every 10 years | April 1, 2020 | Includes vacant and seasonal units |
| Housing units, annual | Census housing unit estimates, CO-EST2025-HU-16, NST-EST2025-HU | County | Yearly | Vintage 2025 | No city-level series; use ACS B25001 for a town, with its margin of error |
| New homes permitted | Census Building Permits Survey, annual place file (we2025a.txt) and county file (co2025a.txt); FRED county series such as BPPRIV016083 | Permit-issuing place | Monthly and yearly | 2025 annual | Permits are not completions; unincorporated areas are counted by the county |
| Where residents work | Census OnTheMap (LODES), Inflow/Outflow analysis; raw LODES 8 OD files | Block | Yearly | 2024 (LODES 8.5 and OnTheMap, Nov. 5, 2026) | Counts jobs, not people; self-employed workers not on a payroll are missing |
| Home value, rent, income | ACS 5-year: DP04, DP05, B25077, B25064, B19013, S0801 | Block group (most tables) | Yearly (December) | 2020 to 2024 5-year | Margin of error; period average; dollars of the final year |
| House price trend | FHFA House Price Index, all-transactions, metro and state files | Metro area (also ZIP and county, annual) | Quarterly | 2026 Q2 | An index, not a price; no city series for small towns |
| Rent benchmark | HUD Fair Market Rents, FY county file | County or HUD metro FMR area | Yearly (Oct. 1) | FY2026 | A program standard, not a survey of current asking rents |
| Income per person | BEA CAINC1, line 3 (per capita personal income) | County | Yearly (November) | 2024 | Includes farm proprietors' income, which swings with milk and crop prices |
| Farmland | Census of Agriculture, county Table 1 and Table 8, county profiles | County | Every 5 years | 2022 | "Land in farms" includes rangeland |
| City land area | Census Gazetteer files (places), TIGER boundaries | Incorporated place | Yearly | 2025 | Shows annexation only as reported to the Census Bureau |
| Inflation | BLS CPI-U, U.S. city average, all items, CUUR0000SA0 (FRED CPIAUCNS) | Nation | Monthly | 2025 annual average 321.943 | One deflator for every series |
Set up the workbook before you download anything
The most common reason a growth profile falls apart is not a bad number. It is a good number nobody can trace. Set up the structure first so every figure has a home and a source.
- Make a folder named for the place and the date, for example
kimberly-growth-2026-11. Inside it, make a subfolder namedraw. Every file you download goes intorawunchanged, with the agency's file name kept and the download date added (for examplesub-est2025_16_downloaded-2026-11-17.csv). - Open a new spreadsheet (Excel, Google Sheets or LibreOffice Calc all work) and make five tabs: Sources, Raw, Calc, Card and Charts.
- On the Sources tab, make columns for note number, agency, file or table ID, release or vintage, geography, URL and date read. Fill in a row the moment you open a file, not later.
- On the Raw tab, paste values exactly as published, one block per source, with the source note number in the cell above each block. Do not round, do not fix anything, and do not delete columns you think you will not need.
- On the Calc tab, write every derived number as a formula that points at the Raw tab. If a reader asks where "108.5 permits per 1,000" came from, clicking the cell should show
=Raw!C14/Raw!C5*1000, not a typed number. - Put the CPI-U annual averages in one block on the Calc tab (the values are in the inflation section below) and point every real-dollar formula at that block. One deflator, one place.
- On the Card tab, build the one-page summary from Calc cells only. On the Charts tab, chart from Calc cells only.
- Save a dated copy each time you change a source. Agencies revise; your profile should say which release it used.
The training course lesson Spreadsheets from Zero covers formulas, absolute references and sorting if any of that is new.
Step 1: Population, counts and estimates
Population comes in two kinds. The decennial census is a count of everyone living in a place on April 1 of a year ending in zero. Between censuses, the Census Bureau's Population Estimates Program produces an estimate for July 1 of each year, built from the last census plus births, deaths and migration, with housing unit change used to spread county totals to cities. A count and an estimate are different things; label them.
Get the census counts
- Go to data.census.gov and type the table ID
P1and the place name in the search box, for example "P1 Kimberly city, Idaho." Choose the result from the 2020 Decennial Census Redistricting Data (DEC), table P1, "Race." - Check the geography line under the table title. It should read "Kimberly city, Idaho," not Kimberly CCD or a ZIP code. If it does not, open the Geography filter and choose Place, then Idaho, then the city.
- Read the first row, "Total." For Kimberly, the 2020 count is 4,626.9
- Change the year to 2010 (the year selector sits above the table) and repeat. Kimberly's 2010 count was 3,264.10
- Use the same steps with table
H1("Occupancy Status") for housing units: 1,502 in 2020 and 1,190 in 2010 for Kimberly.910 - For a whole county at once, download the state redistricting file (id2020.pl.zip, about 10 MB) from the Census Bureau's server. It is a pipe-delimited text file that needs the technical documentation to read; most users will prefer data.census.gov.
Get the annual estimates
- Go to census.gov, open Data, then Population Estimates, then Data, then Datasets, and choose the 2020 to 2025 folder and cities/totals. Download
sub-est2025_16.csv(16 is Idaho's state code). - Open it in a spreadsheet. Each place appears twice: once with summary level 162 (the whole city) and once with 157 (the part of the city in each county). Use the 162 row unless the city crosses a county line.
- Copy the columns
ESTIMATESBASE2020andPOPESTIMATE2020toPOPESTIMATE2025. The base is the April 1, 2020 starting point after the Bureau's adjustments; the others are July 1 estimates. - For the county, download
co-est2025-alldata.csvfrom the counties folder. It also holds the components of change (births, deaths, domestic and international migration) by year. - For Idaho and the nation, download
NST-EST2025-ALLDATA.csvfrom the state folder.
The Vintage 2025 estimates were released May 14, 2026.11 The state housing unit table from the same vintage (NST-EST2025-HU) shows Idaho with the fastest percentage growth in housing units of any state from July 2023 to July 2024 and from July 2024 to July 2025 (2.1 percent in the latest year). Utah grew faster in each earlier year and over the whole span from April 2020 to July 2025 (13.5 percent against Idaho's 12.9 percent, our calculation).16 The release text describes Idaho as leading in every year, which the table does not show; read the table, not the summary.
| Area | 2010 census | 2020 census | April 2020 base | July 2021 | July 2022 | July 2023 | July 2024 | July 2025 | Change from base |
|---|---|---|---|---|---|---|---|---|---|
| Kimberly city | 3,264 | 4,626 | 4,625 | 4,844 | 5,088 | 5,372 | 5,582 | 5,798 | +1,173 (+25.4%) |
| Gooding city | 3,567 | 3,707 | 3,703 | 3,743 | 3,757 | 3,818 | 3,863 | 3,855 | +152 (+4.1%) |
| Twin Falls County | 77,230 | 90,046 | 90,050 | 92,382 | 93,890 | 95,392 | 96,467 | 97,539 | +7,489 (+8.3%) |
| Idaho | 1,567,582 | 1,839,106 | 1,839,123 | 1,904,855 | 1,942,951 | 1,970,497 | 2,000,872 | 2,029,733 | +190,610 (+10.4%) |
| United States | n.a. here | n.a. here | 331,516,113 | 332,100,166 | 333,996,304 | 336,755,052 | 340,003,797 | 341,784,857 | +10,268,744 (+3.1%) |
Sources: census counts from the 2010 and 2020 redistricting files;109 estimates from Vintage 2025 SUB-EST2025_16, co-est2025-alldata and NST-EST2025-ALLDATA.1122 Percent changes are our calculation. The national census counts are not repeated here because the national row is taken entirely from the estimates file.
Vintages and revisions: the 465-person lesson
Each year's release, called a vintage, re-estimates every year back to the last census. Mixing vintages produces fake growth or fake decline. Kimberly shows how large the gap can be. The Vintage 2020 file, built forward from the 2010 census, estimated Kimberly at 4,161 people on July 1, 2020. Three months earlier, on April 1, 2020, the census had counted 4,626.139 The town had grown faster during the 2010s than the estimates could see, and the census caught the difference: 465 people, or about 11 percent.
A reader who took 4,161 for 2020 from the old file and 5,798 for 2025 from the new one would report growth of 39 percent. The correct figure, both ends from Vintage 2025, is 25.4 percent. The rule: take every year of a series from the same vintage, and say which vintage it is.
The same caution applies to sources that borrow population figures. The Bureau of Economic Analysis divides county income by a population estimate to get per capita income, and its 2024 county figures use an earlier vintage. BEA's 2024 population for Twin Falls County is 96,509; Vintage 2025 puts the same county at 96,467 for July 2024.1412 The gap is small here, but it explains why your own per capita math will not exactly match BEA's.
Step 2: Housing units, the stock
A housing unit is a house, apartment, mobile home or room occupied or intended as separate living quarters. Housing units include vacant homes and second homes. A household is the people living in one occupied unit. The census counts both; the difference is vacancy.
- For the 2020 and 2010 counts, use table H1 as in step 1. Record total units, occupied and vacant.
- For annual county and state figures, go to census.gov Population Estimates, then Data, then Tables, choose the 2020 to 2025 period and Housing Units, and download
CO-EST2025-HU-16.xlsx(counties in Idaho) andNST-EST2025-HU.xlsx(states and the nation). - For a city there is no annual housing unit estimate. Use ACS 5-year table B25001 ("Housing Units") with its margin of error, and treat it as a 2020 to 2024 period estimate, not a July 2024 number.
- Write down the vacancy rate at the 2020 census (vacant divided by total). It tells you whether new households can move into existing homes or need new ones.
| Area | Units, 2010 census | Units, 2020 census | Vacant 2020 | Units, July 2025 estimate | Change, April 2020 to July 2025 | ACS 2020 to 2024 units (MOE) |
|---|---|---|---|---|---|---|
| Kimberly city | 1,190 | 1,502 | 51 (3.4%) | No city estimate | No city estimate | 1,848 (plus or minus 232) |
| Gooding city | 1,537 | 1,488 | 88 (5.9%) | No city estimate | No city estimate | 1,313 (plus or minus 154) |
| Twin Falls County | 31,072 | 34,693 | 1,932 (5.6%) | 38,164 | +3,471 (+10.0%) | 36,429 (plus or minus 72) |
| Idaho | 667,796 | 751,859 | 75,653 (10.1%) | 849,155 | +97,296 (+12.9%) | 795,014 (plus or minus 223) |
| United States | See national census tables | 148,260,882 | +7,762,146 (+5.5%) | 143,775,355 (plus or minus 10,234) | ||
Sources: 2010 and 2020 redistricting files, table H1;109 Vintage 2025 housing unit estimates;1516 ACS 2020 to 2024 5-year, table B25001.6 Vacancy rates and changes are our calculation. The national base in the estimates table is 140,498,736 units on April 1, 2020.
Two things in this table are worth a second look. First, Gooding's 2020 count (1,488) is lower than its 2010 count (1,537), and its ACS figure (1,313) is lower still, though the margin of error is wide. The census counts can drop when units are demolished, merged or reclassified, or when a boundary changes. That is a question to put to the city, not a conclusion. Second, Kimberly's people grew faster than its homes during the 2010s: population rose 41.7 percent and housing units 26.2 percent, so the number of people per unit climbed from about 2.74 to 3.08 (our calculation from the census counts).109 Fast-growing family suburbs often look like this.
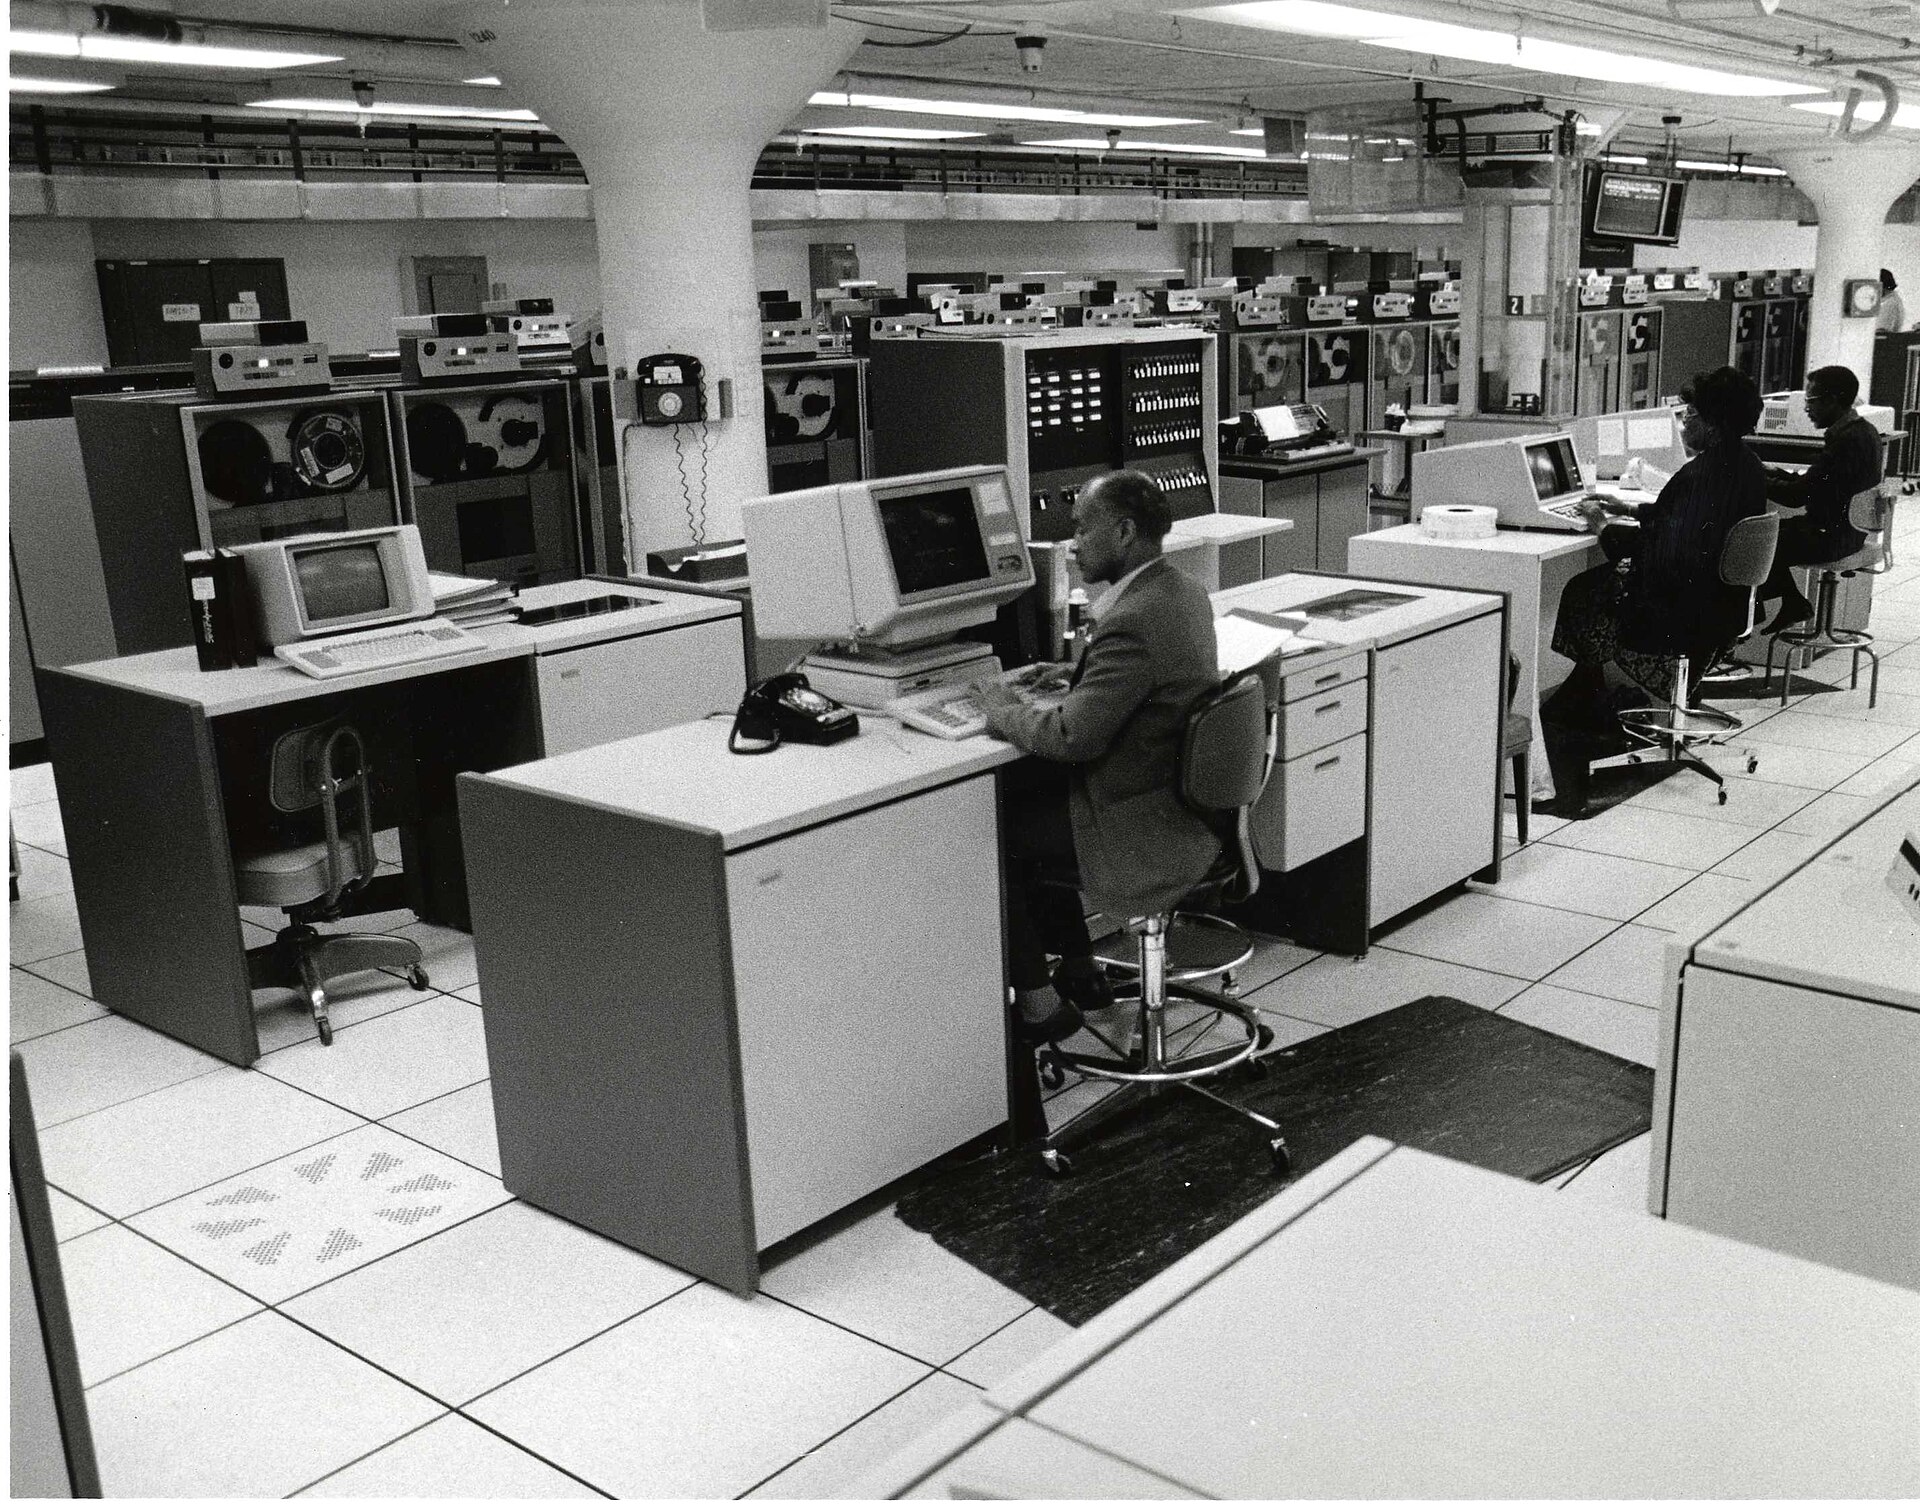

Step 3: Building permits, the new homes
A building permit is a local government's authorization to build. The Census Bureau's Building Permits Survey collects the number of new privately owned housing units authorized from about 20,000 permit-issuing places. It surveys about 8,400 of them each month and all of them once a year, and fills in (imputes) missing reports. The Bureau says over 98 percent of privately owned residential buildings constructed are in permit-issuing places.17 Three limits matter for a profile:
- A permit is not a finished home. Some are never built, and the ones that are can take a year or more. Permits count intentions; completions add to the stock.
- Permits are counted by the government that issued them. Homes built outside city limits under a county permit show up in the county's "unincorporated area" line, not in the nearest town, even when the address says the town's name.
- The survey counts new units only. Demolitions, conversions and manufactured homes placed without a building permit are not in it.
Get the place file
- Go to census.gov/construction/bps and open the data section. Choose the ASCII files by geography: Place, then West Region (Idaho is in the West). The annual file for 2025 is
we2025a.txt; the letterameans annual, whilecfiles are year to date by month. - Open the file in a spreadsheet as comma-separated text. The first two rows are headers split across two lines. Columns include the survey year, state code (16), the 6-digit place ID, county code, FIPS place code, a population figure the survey uses for sampling, the place name, and then four groups of three columns: 1-unit, 2-units, 3 to 4 units and 5 or more units, each with buildings, units and construction value. A second set of the same columns repeats with "rep" in the header: reported values only, without imputation.
- Find your town by its name or FIPS place code (Kimberly is 43570; Gooding is 32140). Add the four "Units" columns from the first set to get total units authorized.
- Repeat for each year you need (we2020a.txt through we2025a.txt). Check that the "Number of Months Rep" column reads 12 for a full year of reports.
- For the county total, use the county file in the County folder (for example
co2025a.txt), or the FRED series for the county. FRED names county permit seriesBPPRIVplus 0, the state code and the county code: Twin Falls County isBPPRIV016083, which shows 527 units for 2025.18 Cite the Census Bureau as the source and FRED as where you read it. - For the state and nation, use the State folder files (for example
st2025a.txt).
| Area | 2020 | 2021 | 2022 | 2023 | 2024 | 2025 | Total 2020 to 2025 | Per 1,000 residents (2020 base) | 2025 per 1,000 (2025 pop.) |
|---|---|---|---|---|---|---|---|---|---|
| Kimberly city | 72 | 96 | 94 | 69 | 83 | 88 | 502 | 108.5 | 15.2 |
| Gooding city | 7 | 12 | 12 | 11 | 7 | 5 | 54 | 14.6 | 1.3 |
| Twin Falls County (all permit offices) | 959 | 899 | 518 | 380 | 634 | 527 | 3,917 | 43.5 | 5.4 |
| Idaho | 19,130 | 21,732 | 18,706 | 17,919 | 17,630 | 17,944 | 113,061 | 61.5 | 8.8 |
| United States | 1,471,141 | 1,736,982 | 1,680,368 | 1,511,102 | 1,478,000 | 1,431,616 | 9,309,209 | 28.1 | 4.2 |
Sources: Census Building Permits Survey annual place, county and state files, units authorized summed across building sizes, estimates with imputation.3194 Rates per 1,000 residents are our calculation using the Vintage 2025 April 2020 base and July 2025 estimates.1122
What the table shows: Kimberly issued permits at about 1.8 times Idaho's rate and almost four times the national rate over six years, and its pace barely slowed after 2022, while Twin Falls County as a whole fell from 959 units in 2020 to 380 in 2023 before recovering. Almost all of Kimberly's permits were single-family houses. The exceptions were one duplex each in 2021, 2022 and 2025, nine duplexes (18 units) in 2023, and in 2024 four duplexes (8 units) and two buildings of five or more units (12 units).3 Gooding issued 54 units in six years, mostly single-family houses, with a few duplexes and one 4-unit building in 2022.
How we figured it: permits per 1,000 residents
Permits per 1,000 residents = units authorized / population x 1,000. For the six-year rate we divided the 2020 to 2025 total by the April 1, 2020 estimates base, so places of different sizes start on the same footing. For Kimberly: 502 / 4,625 x 1,000 = 108.5. For a single year we divided by that year's July 1 estimate: 88 / 5,798 x 1,000 = 15.2 for Kimberly in 2025. All inputs are in the tables above. A small town's rate can jump with one subdivision, so read single-year rates for places under 10,000 people with care and look at the multiyear total.
Land area and annexation: what you can measure
No agency publishes "acres developed per city since 2020." Two public sources get partway there. The Census Gazetteer files list each city's land area as drawn in the Bureau's boundary files, which are updated through the annual Boundary and Annexation Survey that local governments answer.20 Kimberly's land area was 1.892 square miles in the 2020 Gazetteer and 2.038 square miles in the 2025 Gazetteer, a gain of 377,874 square meters, or about 93 acres (our calculation).2122 Gooding's barely changed (1.518 to 1.519 square miles). That 93-acre figure is the area added to Kimberly's limits as reported to the Census Bureau. It is not a measure of land actually built on, and annexations not yet reported would be missing.
The legal record is local. Idaho Code 50-222 governs annexation by cities and requires notice to landowners and the county that includes a legal description and a simple map, and, for most annexations, written consent from landowners recorded with the county recorder.23 Idaho Code 63-215 requires a taxing district that changes its boundaries, which includes a city, to file a legal description and map with the county recorder, the county assessor and the Idaho State Tax Commission within 30 days and no later than January 10 of the next year.24 Those filings, plus the annexation ordinances in city council minutes, are the records to request when you want acres by year. Lesson 03, The Big Cities Since 2020, compares what the larger cities report, and the planning side is in Idaho Planning and Zoning.
Density follows from the same two files: Kimberly had about 2,445 people per square mile at the 2020 census (4,626 / 1.892) and about 2,845 in 2025 (5,798 / 2.038), our calculation. Mixing an estimate with a boundary from a different date is a small inconsistency; say so if you publish a density.
Step 4: Where residents work (OnTheMap)
The Census Bureau's Longitudinal Employer-Household Dynamics program combines state unemployment insurance records and federal data to estimate where workers live and where they work, down to the census block. The public product is called LODES (LEHD Origin-Destination Employment Statistics), and OnTheMap is the free web tool that maps it. The Bureau updated OnTheMap on Dec. 18, 2025 with 2023 data (LODES version 8.4).25 On Nov. 5, 2026 it released LODES version 8.5, which adds 2024, and updated OnTheMap to cover 23 years, 2002 to 2024, with its maps moved to the 2025 Census boundary (TIGER) files; 2024 data for Alaska and Michigan are not included.42 The Idaho 2024 files were on the Bureau's file server from Oct. 14, 2026, three weeks before that announcement, and the version 8.5 technical document covers 2002 to 2024.265
Run an inflow and outflow analysis
- Go to onthemap.ces.census.gov. In the search box on the left, type the place name, for example "Kimberly city, ID," and press Search.
- In the result box, choose Perform Analysis on Selected Area.
- In Analysis Settings, choose Inflow/Outflow as the analysis type. Pick the newest year in the year list (2024 since the Nov. 5, 2026 update) and leave the job type at All Jobs. Click Go!.
- Read the three numbers: employed in the selection area but living outside, living in the selection area but employed outside, and employed and living in the selection area. Use Export to download the report and keep it in your
rawfolder. - For the top destinations, run a second analysis with type Destination, choose "Places (Cities, CDPs, etc.)," and export the table.
- Repeat for the county and for Idaho as a whole, so the card can compare.
If you are comfortable with large text files, the raw LODES files let you tabulate any year the Bureau has posted. Download the state's main origin-destination file (id_od_main_JT00_2024.csv.gz for all jobs in 2024), the auxiliary file for workers who live out of state (id_od_aux_JT00_2024.csv.gz) and the geography crosswalk (id_xwalk.csv.gz). Each row in the OD file is a pair of census blocks (home and work) and a job count in column S000. The crosswalk maps each block to its place (stplc) and county. Summing rows where the work block is in the town and the home block is not gives the inflow, and so on. The main file covers only jobs where both ends are in Idaho, so outflow to jobs in other states is not in this tabulation; OnTheMap's own numbers can differ slightly for that reason and because the tool uses the boundary vintage it was built on.
| Measure (all jobs) | Kimberly 2023 | Kimberly 2024 | Gooding city 2024 |
|---|---|---|---|
| Live and work in the town | 165 | 197 | 458 |
| Work in the town, live elsewhere in Idaho | 959 | 1,046 | 1,406 |
| Work in the town, live in another state | 37 | 34 | 49 |
| Total jobs located in the town | 1,161 | 1,277 | 1,913 |
| Live in the town, work elsewhere in Idaho | 1,906 | 2,014 | 1,239 |
| Residents with an Idaho job | 2,071 | 2,211 | 1,697 |
| Jobs in town per resident with an Idaho job | 0.56 | 0.58 | 1.13 |
| Top destination for residents | Twin Falls city, 1,007 | Twin Falls city, 1,042 | Gooding County outside any census place, 329 |
Source: our tabulation of LODES 8 Idaho main and auxiliary origin-destination files and the Idaho crosswalk, 2023 and 2024, all jobs.5 Ratios are our calculation.
The two towns are mirror images. Kimberly is a bedroom community: it has roughly six jobs for every ten residents who work, and nearly half of its working residents (1,042 of 2,211 in 2024) work in the city of Twin Falls. Gooding is a small job center: it has more jobs than working residents, drawing in people from the surrounding county, Twin Falls, Jerome and Wendell. That difference shapes everything else on the card, from traffic on the roads to whether new housing is meeting local job growth or regional demand. Lesson 07, Where People Work, covers commuting across the Magic Valley and Treasure Valley.
Step 5: The American Community Survey tables
The American Community Survey (ACS) is the Census Bureau's continuous monthly sample survey of households. It replaced the old census "long form" and is the only source of home values, rents, incomes, commute times and much else for small towns. Because it is a sample, every ACS number is an estimate with a margin of error (MOE). The Bureau publishes MOEs at the 90 percent confidence level: if the survey were repeated many times, the true value would fall within the estimate plus or minus the MOE about 90 percent of the time.27
The ACS comes in two main products. 1-year estimates cover only areas of 65,000 people or more; Twin Falls County qualifies, Kimberly and Gooding do not. The 2025 1-year estimates were released Oct. 29, 2026, later than the usual September, after a delay the Bureau attributed to a Commerce Department administrative order on disclosure avoidance, which led it to review its disclosure rules for the release.282943 5-year estimates pool five years of responses and cover every place, down to block groups. The newest 5-year release covers 2020 to 2024. A 5-year estimate is an average over the period, not a snapshot of 2024, and its dollar figures are stated in the final year's dollars (2024 dollars for 2020 to 2024). For a growth card that compares a town with Idaho and the nation, use the 5-year estimates for all three levels so the periods match.
Which tables to pull
| Table ID | Title | What to take from it |
|---|---|---|
| DP05 | ACS Demographic and Housing Estimates | Total population (period average), median age, age groups, race, Hispanic or Latino share |
| DP04 | Selected Housing Characteristics | Housing units, occupancy, tenure (owner and renter), year built, units in structure, median value, median gross rent, gross rent as a percent of income |
| B25077 | Median Value (Dollars), owner-occupied units | The median home value by itself, with its MOE |
| B25064 | Median Gross Rent (Dollars) | Median rent plus utilities paid by renter households |
| B19013 | Median Household Income in the Past 12 Months | Median household income, in the final year's dollars |
| S0801 | Commuting Characteristics by Sex | How workers get to work, share working from home, mean travel time |
| B25001 | Housing Units | Total housing units with MOE (the only town-level unit count between censuses) |
- At data.census.gov, type the table ID and the place, for example "B25077 Kimberly city, Idaho," and open the table.
- Check the product line above the table. It should say "American Community Survey" and "ACS 5-Year Estimates Detailed Tables" (B tables), "Data Profiles" (DP tables) or "Subject Tables" (S tables), with the year 2024. If it says 1-Year, change it with the product selector; a 1-year table will show no data for a small town.
- Add comparison geographies in the same table: open Geography, and add the county (Twin Falls County, Idaho), the state (Idaho) and the nation (United States). The table now has a column pair, Estimate and Margin of Error, for each.
- Download with the Download Table button (CSV or Excel). Keep the MOE columns.
- For DP04, scroll to the VALUE section for "Median (dollars)" and to the GROSS RENT section for "Median (dollars)." Data profile rows are renumbered in some years, so find rows by their labels, not by line number.
- If data.census.gov is slow or a large download times out, the same estimates are in the ACS table-based summary files on the Census Bureau's file server, one pipe-delimited file per table for every geography, keyed by GEO_ID (Kimberly is
1600000US1643570).
| Measure, ACS 2020 to 2024 5-year (2024 dollars) | Kimberly city | Gooding city | Twin Falls County | Idaho | United States |
|---|---|---|---|---|---|
| Median home value, owner-occupied (B25077) | $339,400 (plus or minus $41,828) | $186,100 (plus or minus $21,489) | $337,900 (plus or minus $8,873) | $418,600 (plus or minus $2,550) | $332,700 (plus or minus $236) |
| Median gross rent (B25064) | $1,127 (plus or minus $46) | $861 (plus or minus $45) | $1,089 (plus or minus $35) | $1,238 (plus or minus $16) | $1,413 (plus or minus $2) |
| Median household income (B19013) | $97,799 (plus or minus $34,495) | $41,899 (plus or minus $14,165) | $67,409 (plus or minus $3,701) | $77,800 (plus or minus $743) | $80,734 (plus or minus $166) |
| Per capita income (B19301) | $29,861 (plus or minus $5,499) | $20,851 (plus or minus $3,707) | $35,344 (plus or minus $1,840) | $38,952 (plus or minus $416) | $44,673 (plus or minus $122) |
| Owner-occupied share of occupied units (B25003) | 82.7% (1,425 of 1,723) | 60.7% (792 of 1,305) | 70.5% | 72.1% | 65.2% |
| Median age (B01002) | 32.2 (plus or minus 2.6) | 32.6 (plus or minus 4.1) | 36.1 (plus or minus 0.3) | 37.3 (plus or minus 0.1) | 38.9 (plus or minus 0.1) |
Source: ACS 2020 to 2024 5-year estimates, tables as listed.6 Owner shares are our calculation from table B25003 (owner-occupied units divided by occupied units); the town counts carry their own margins of error (for Kimberly, 1,425 plus or minus 262 owner units).
Reading margins of error
Three checks keep a small-town ACS number honest. The Census Bureau's ACS handbook gives the formulas.2730
- Write the range. Kimberly's median household income is $97,799 plus or minus $34,495, so the 90 percent range runs from $63,304 to $132,294. Put the range on the card, or at least the MOE.
- Compute the coefficient of variation (CV). Standard error = MOE / 1.645. CV = standard error / estimate x 100. For Kimberly's income: 34,495 / 1.645 = 20,970; 20,970 / 97,799 = 21.4 percent. The Bureau sets no fixed cutoff, but a CV above about 15 to 20 percent means the estimate can move a lot from one release to the next; say so in the text.
- Test a difference before you claim one. To ask whether two estimates differ, compute Z = (estimate 1 minus estimate 2) / square root of (SE1 squared + SE2 squared). If the absolute value of Z is above 1.645, the difference is statistically significant at the 90 percent level. Kimberly's median income ($97,799, SE 20,970) against Twin Falls County's ($67,409, SE 2,250): Z = 30,390 / 21,090 = 1.44. That is below 1.645, so even a $30,000 gap in the estimates is not a statistically significant difference. Kimberly's median value ($339,400) against the county's ($337,900) is plainly no difference at all.
The handbook also says comparisons are best made between periods that do not overlap. Compare 2015 to 2019 with 2020 to 2024, not 2019 to 2023 with 2020 to 2024, which share four of five years; overlapping comparisons "can be made with caution" using an adjusted formula.27 The training lesson Uncertainty works through more examples.
Step 6: House prices, the FHFA index
The Federal Housing Finance Agency's House Price Index (HPI) tracks how prices of the same houses change when they sell again or are refinanced, using mortgages bought or guaranteed by Fannie Mae and Freddie Mac. The all-transactions index includes appraisals from refinances as well as sales. An index is not a price: it shows change relative to a base period. Only the percentage changes between two dates mean anything.
- Go to fhfa.gov, open Data, then House Price Index Datasets. Under quarterly data, download the all-transactions files for metropolitan areas (
hpi_at_metro.csv), states (hpi_at_state.csv) and the U.S. and census divisions (hpi_at_us_and_census.csv). - In the metro file, find your area by name or code. The Twin Falls, Idaho metropolitan area is CBSA 46300; HUD's FY2025 and FY2026 rent files place Twin Falls and Jerome counties in that metro area.31 The metro file's columns are name, code, year, quarter, index and, in parentheses, the index's standard error.
- Pick the same quarter in each year (the second quarter avoids most seasonal swings in a not seasonally adjusted series) and compute percent change.
- Small towns have no index of their own. FHFA also publishes annual indexes for counties and ZIP codes; check whether your county has one and use the metro index when it does not.
| FHFA all-transactions HPI | 2020 Q2 | 2025 Q2 | 2026 Q2 | Nominal change 2020 Q2 to 2025 Q2 | Real change (2025 dollars) | Nominal change 2020 Q2 to 2026 Q2 |
|---|---|---|---|---|---|---|
| Twin Falls metro (CBSA 46300) | 255.82 | 435.41 | 428.66 | +70.2% | +36.8% | +67.6% |
| Idaho | 515.84 | 853.00 | 878.19 | +65.4% | +32.9% | +70.2% |
| United States | 453.17 | 698.69 | 719.87 | +54.2% | +23.9% | +58.9% |
Sources: FHFA all-transactions HPI, metro, state and U.S. files, through 2026 Q2.323334 Changes are our calculation; real changes use the CPI-U annual averages for 2020 and 2025 (method below). Index levels differ because each series has its own base period; compare changes, never levels. The 2026 Q2 change is not deflated because no 2026 annual CPI exists yet. The Twin Falls metro index slipped from 2025 Q2 to 2026 Q2 while Idaho's rose; one year of a small metro index is noisy, and its standard error in 2026 Q2 is 10.17 index points.
Lesson 09, Prices and Rents vs. Inflation, carries these series back to 2000.
Step 7: Rents, HUD Fair Market Rents
A Fair Market Rent (FMR) is HUD's estimate of what a modest unit rents for, used to set Housing Choice Voucher payment standards. For FY2026 HUD describes it as its "best effort to estimate the 40th percentile gross rent paid by recent movers into standard quality units," built from ACS 2019 to 2023 5-year base rents and updated with more recent data, and effective Oct. 1, 2025.35 It is a benchmark, not a survey of current asking rents, and it lags the market.
- Go to huduser.gov, open Datasets, then Fair Market Rents, and choose the fiscal year. Download the county-level Excel file (for example
FY26_FMRs.xlsx). - Find your county by the
countynamecolumn. Columnsfmr_0tofmr_4are rents for efficiency through four-bedroom units; most comparisons use two bedrooms (fmr_2). - Note the
hud_area_name. When a county moves from nonmetro to a metro area, as Twin Falls County did under the 2023 metro definitions, the method changes with it. - Repeat for an earlier year to show change (older files are named differently, for example
FY20_4050_FMRs_rev.xlsx).
| Two-bedroom FMR | FY2020 | FY2020 in 2025 dollars | FY2025 | FY2026 | Real change FY2020 to FY2025 |
|---|---|---|---|---|---|
| Twin Falls County | $801 (nonmetro county) | $996 | $1,285 (HUD metro FMR area) | $1,284 | +29.0% |
| Gooding County | $714 | $888 | $939 | $1,026 | +5.7% |
| Jerome County | $787 | $979 | $1,127 | $1,186 | +15.1% |
Sources: HUD FY2020, FY2025 and FY2026 FMR files.363731 Real values are our calculation with CPI-U annual averages for 2020 and 2025. HUD does not publish a statewide or national FMR; the ACS median gross rent in step 5 is the comparison for Idaho and the United States.
Step 8: Income, BEA per capita personal income
The Bureau of Economic Analysis measures personal income: wages, business and farm proprietors' income, rent, interest, dividends and government transfers such as Social Security, for everyone who lives in a county. Per capita personal income divides that total by population. It is broader than ACS household income and is published every year for every county, which makes it the better trend line for a county card.
- Go to apps.bea.gov/regional, choose Personal Income and Employment by County and Metropolitan Area, then table CAINC1, "Personal Income Summary: Personal Income, Population, Per Capita Personal Income." Pick your counties and years. Or download the full table as
CAINC1.zipfrom the Regional data downloads page. - Line 1 is personal income in thousands of dollars, line 2 population, line 3 per capita personal income in dollars.
- Note the newest year (2024 in the file read for this lesson) and convert to 2025 dollars with the CPI-U.
| Per capita personal income (CAINC1 line 3) | 2020 nominal | 2024 nominal | 2020 in 2025 dollars | 2024 in 2025 dollars | Real change |
|---|---|---|---|---|---|
| Twin Falls County | $43,724 | $53,767 | $54,390 | $55,182 | +1.5% |
| Gooding County | $63,425 | $70,962 | $78,896 | $72,829 | minus 7.7% |
| Idaho | $49,724 | $62,323 | $61,853 | $63,963 | +3.4% |
| United States | $59,151 | $73,204 | $73,580 | $75,130 | +2.1% |
Source: BEA CAINC1, 1969 to 2024 file.14 Real values and changes are our calculation. Gooding County's per capita income is well above Twin Falls County's and fell in real terms; in a county where dairy and cattle are a large share of the economy, farm proprietors' income can swing per capita income from year to year. Check BEA table CAINC4 (components of personal income) before writing about it. The county file had not been updated for BEA's 2026 annual revision as of Nov. 17, 2026. BEA's revised state table (SAINC1, released Sept. 30, 2026) puts Idaho's per capita income at $49,715 for 2020, $61,345 for 2024 and $64,200 for 2025, and the nation's 2024 figure at $73,634. On those revised numbers Idaho's real change from 2020 to 2024 is +1.8 percent and the nation's +2.7 percent, the reverse of the order in the table above (our calculation). Say which release you used, and do not mix the two.44
Step 9: Farmland, the Census of Agriculture
The Census of Agriculture counts farms and land in farms every five years; the newest is 2022, and the next is 2027. "Land in farms" includes cropland, pasture and rangeland, so a drop can mean subdivisions, a ranch leaving the program or a change in how land is reported. Use cropland and irrigated acres when the question is conversion of farmland to houses. Lesson 05, Farmland to Rooftops, covers this in depth.
- Go to nass.usda.gov, open Census of Agriculture, then 2022 Census Volume 1, Chapter 2: County Level Data, and choose Idaho. Table 1 ("County Summary Highlights") and Table 8 ("Farms, Land in Farms, Value of Land and Buildings, and Land Use: 2022 and 2017") are the core tables.
- For a quick two-year comparison, open the county profile (under Online Resources, County Profiles, Idaho). It shows 2022 values and the percent change from 2017.
- For a longer series (1978 to 2022), use the NASS Quick Stats database or the scanned historical volumes in the USDA Census of Agriculture Historical Archive; note that some definitions changed over the decades.
Twin Falls County had 1,169 farms and 459,167 acres in farms in 2022, down 3 percent and 2 percent from 2017, while the market value of farm products sold rose 67 percent.3839 Idaho had 11,547,963 acres in farms in 2022, down from 11,691,912 in 2017 (minus 1.2 percent, our calculation).40 County figures cannot tell you how much of the loss happened at Kimberly's edge. For that, the module's farmland lesson uses USGS land cover data, and county assessor parcel records show land moving from agricultural to residential use.
Step 10: Turn nominal dollars into 2025 dollars
Nominal dollars are the dollars of the year the number describes. Real dollars remove general inflation so that years can be compared. This module uses one deflator for everything: the Consumer Price Index for All Urban Consumers (CPI-U), U.S. city average, all items, not seasonally adjusted, BLS series CUUR0000SA0, annual average. FRED carries the same series as CPIAUCNS.41
The 2025 annual average has a wrinkle. The 2025 federal government shutdown stopped BLS price collection, and no October 2025 index was published. BLS computed 2025 annual averages for affected series as the average of the 11 published months.8 For the CPI-U that average is 321.943, the figure the Idaho Department of Labor lists with October marked not available.7
| Year | CPI-U annual average (1982 to 84 = 100) | Multiply a dollar from that year by this to get 2025 dollars |
|---|---|---|
| 1979 | 72.575 | 4.436 |
| 2000 | 172.2 | 1.870 |
| 2010 | 218.056 | 1.476 |
| 2020 | 258.811 | 1.244 |
| 2021 | 270.970 | 1.188 |
| 2022 | 292.655 | 1.100 |
| 2023 | 304.702 | 1.057 |
| 2024 | 313.689 | 1.026 |
| 2025 | 321.943 | 1.000 |
Sources: Idaho Department of Labor CPI table (2020 to 2025) and BLS CPI-U monthly values read through FRED (1979, 2000, 2010).741 Multipliers are our calculation, rounded to three decimals; use the full ratio in your workbook.
How we figured it: real dollars
Real (2025 dollars) = nominal x (CPI 2025 / CPI year). CPI 2025 = 321.943.
- Twin Falls County's FY2020 two-bedroom FMR: $801 x (321.943 / 258.811) = $996.
- Twin Falls County per capita income, 2020: $43,724 x (321.943 / 258.811) = $54,390; 2024: $53,767 x (321.943 / 313.689) = $55,182. Real change: 55,182 / 54,390 minus 1 = +1.5 percent.
- An index works the same way. The real change in the Twin Falls metro HPI from 2020 Q2 to 2025 Q2 is (435.41 / 255.82) x (258.811 / 321.943) minus 1 = +36.8 percent. Using the annual CPI for a single quarter is an approximation we accept to keep one deflator.
- ACS 5-year dollars are already in the final year's dollars. To move 2020 to 2024 estimates into 2025 dollars, multiply by 321.943 / 313.689 = 1.0263. Kimberly's median value becomes about $348,300, median rent about $1,157 and median household income about $100,400.
- Do not deflate 2026 figures with a guessed index. Label them "2026 to date, nominal."
Step 11: Ratios and per-capita rates
Ratios turn a pile of numbers into an answer, and they are where most mistakes enter. Every ratio on a growth card is your own calculation: say so, show the inputs, and round to a sensible number of digits.
How we figured it: price-to-income and rent-to-income
Price-to-income = median home value / median household income, both from the same ACS 5-year release (2020 to 2024, 2024 dollars). Rent-to-income = median gross rent x 12 / median household income. These are rough gauges: median value describes owner-occupied homes, median income describes all households, and the median renter household earns less than the median household. For the share of renters who are cost burdened, use ACS table B25070 (gross rent as a percentage of household income) instead.
- Kimberly: $339,400 / $97,799 = 3.47; with the income's 90 percent range ($63,304 to $132,294) the ratio could plausibly run from about 2.6 to 5.4.
- Gooding city: $186,100 / $41,899 = 4.44.
- Twin Falls County: $337,900 / $67,409 = 5.01.
- Idaho: $418,600 / $77,800 = 5.38.
- United States: $332,700 / $80,734 = 4.12.
- Rent-to-income: Kimberly 13.8 percent; Gooding 24.7 percent; Twin Falls County 19.4 percent; Idaho 19.1 percent; United States 21.0 percent.
Notice that Kimberly looks more affordable than Idaho on this measure only because its estimated household income is high, and that income estimate is the shakiest number on the card. A careful write-up says the town's price-to-income ratio is "about 3.5, with a wide margin of error," and leans on the county figure (5.0) for the regional picture.
Other rates worth computing: permits per 1,000 residents (step 3); housing units added per 1,000 residents; jobs located in town per resident worker (step 4); and percent change per year. Divide by the right base: per-resident rates use population, per-household rates use occupied units, and growth rates use the starting value.
Step 12: Chart it in a spreadsheet
- For growth over time across places of very different size, make an index: divide each year by the base year and multiply by 100. Kimberly's 5,798 / 4,625 x 100 = 125.4. A line chart of indexes puts a town of 5,800 and a nation of 342 million on one axis.
- For a comparison at one point in time (permits per 1,000, price-to-income), use a bar chart sorted from high to low, with the town, the county, Idaho and the nation as bars.
- Start bar charts at zero. A line chart of an index may start near 100, but say where the axis starts.
- Label lines directly at their ends instead of using a legend, and do not rely on color alone; use line weight or dashes as well.
- Put the source, table ID and release under every chart, and the words "our calculation" when the chart shows a ratio or real dollars you computed.
- For ACS estimates, show the margin of error as an error bar (in Excel, Add Chart Element, Error Bars, More Options, Custom, and point both directions at the MOE column).
- Check each chart against the Calc tab once more before you publish. The training lesson Honest Charts lists the common distortions.

Step 13: Check your work
Run this checklist before anyone else sees the card.
- Same vintage. Every population figure from one estimates vintage; every ACS figure from one 5-year release.
- Right geography. City means the incorporated city (summary level 160 or 162), not the ZIP code, the census county division or the school district. A ZIP code named for a town usually covers rural land outside its limits.
- Estimate or count. The words "estimate" and "count" are used correctly in every sentence.
- Margins of error. Every ACS number for the town has its MOE in the workbook, and any number with a CV above about 15 percent is flagged in the text.
- Like with like. 5-year with 5-year; nominal with nominal or real with real; the same quarter in each year of an index.
- Totals add up. Permit units equal the sum of the four building-size columns; inflow plus live-and-work equals jobs in town.
- Recompute two numbers by hand. Pick any two derived figures and redo them on paper from the Raw tab.
- Read the footnotes. Each agency file has notes about imputation, boundary changes or suppressed values. In the permits file, check the months-reported column; in the HPI file, look at the standard error.
- Ask the source. When a number looks odd (Gooding's housing count falling between censuses, for example), ask the city or the agency before you explain it.
Step 14: Write it up fairly
Growth helps some people and costs others, often the same people in different ways. A fair profile states the numbers first, then names who gains and who pays, and keeps each claim tied to a figure. Some guidelines:
- Lead with the measured fact and its comparison: "Kimberly's population grew an estimated 25 percent from 2020 to 2025, compared with 10 percent for Idaho."
- Give the benefits their due. New homes let young families buy in a town with a school district and a short drive to Twin Falls jobs. Permit fees and new taxable value come with them. Builders and the trades employ local people.
- Give the costs their due. Fast growth puts pressure on schools, water and sewer systems and roads before the new tax base catches up; farmland at the edge of town becomes subdivisions; rents and prices rose faster than incomes across the region.
- Say what you do not know: whether the new homes went to people moving from out of state or to families already in the Magic Valley; how many acres were built on, as opposed to annexed; how incomes of new residents compare with those already here.
- Do not attach political labels to people who hold either view, and do not quote unnamed "residents" or "experts." Name the person or the document.
- End with the records that could answer the open questions, not with a summary.
A model paragraph for Kimberly: "Kimberly added an estimated 1,173 residents from April 2020 to July 2025, a 25.4 percent increase, according to the Census Bureau's Vintage 2025 estimates. The city authorized 502 new housing units over 2020 to 2025, nearly all single-family homes, at about 1.8 times Idaho's rate per resident. Most working residents commute: in 2024, about 2,000 left town for jobs elsewhere in Idaho, about half of them to the city of Twin Falls, while about 200 both lived and worked in Kimberly. Census figures do not show where the new residents came from."
Worked example: the Kimberly growth card
Kimberly is in Twin Falls County on the south side of the Snake River, east of the city of Twin Falls. Its history, schools and main employers are in the Magic Valley case study. Here it is as a finished card, built from the steps above. Every figure has a note in the earlier sections.

| Band | Measure | Kimberly | Twin Falls County | Idaho | United States | Year and source |
|---|---|---|---|---|---|---|
| People | Population estimate, July 1, 2025 | 5,798 | 97,539 | 2,029,733 | 341,784,857 | Vintage 2025 estimates |
| People | Change from April 2020 base | +25.4% | +8.3% | +10.4% | +3.1% | Vintage 2025; our calculation |
| People | Census count, 2010 to 2020 | 3,264 to 4,626 (+41.7%) | 77,230 to 90,046 (+16.6%) | 1,567,582 to 1,839,106 (+17.3%) | See note | 2010 and 2020 census, P1 |
| Homes | Housing units, 2020 census | 1,502 | 34,693 | 751,859 | 140,498,736 (April 2020 estimates base) | 2020 census, H1; NST-EST2025-HU |
| Homes | Housing units, latest | 1,848 plus or minus 232 (ACS 2020 to 2024) | 38,164 (July 2025) | 849,155 (July 2025) | 148,260,882 (July 2025) | ACS B25001; Vintage 2025 HU estimates |
| Homes | Units permitted, 2020 to 2025 | 502 | 3,917 | 113,061 | 9,309,209 | Census BPS |
| Homes | Permitted per 1,000 residents (2020 base) | 108.5 | 43.5 | 61.5 | 28.1 | Our calculation |
| Work | Live and work in the place, 2024 | 197 | Not computed for this card | LODES 8, our tabulation | ||
| Work | Commute in / commute out (Idaho jobs), 2024 | 1,080 / 2,014 | See lesson 07 | LODES 8, our tabulation | ||
| Money | Median home value (2025 dollars) | $348,300 (MOE about $42,900) | $346,800 | $429,600 | $341,500 | ACS 2020 to 2024, B25077, adjusted by CPI-U |
| Money | Median gross rent (2025 dollars) | $1,157 | $1,118 | $1,271 | $1,450 | ACS B25064, adjusted |
| Money | Median household income (2025 dollars) | $100,400 (MOE about $35,400) | $69,200 | $79,800 | $82,900 | ACS B19013, adjusted |
| Money | Real house price change, 2020 Q2 to 2025 Q2 | Twin Falls metro: +36.8% | (metro) | +32.9% | +23.9% | FHFA HPI; our calculation |
| Money | Two-bedroom FMR, FY2026 (nominal) | $1,284 (county FMR) | $1,284 | No state FMR | No national FMR | HUD FY2026 |
| Money | Per capita personal income, 2024 (2025 dollars) | No city series | $55,182 | $63,963 | $75,130 | BEA CAINC1; adjusted |
| Land | City land area, 2020 to 2025 | 1.892 to 2.038 sq. mi. (about 93 acres added) | Not applicable | Census Gazetteer; our calculation | ||
| Land | Land in farms, 2022 (change from 2017) | County only | 459,167 acres (minus 2%) | 11,547,963 acres (minus 1.2%) | Not pulled for this card | 2022 Census of Agriculture |
Notes: dollar conversions use 321.943 / 313.689 for ACS figures; MOEs in 2025 dollars are the published MOEs times the same factor. Twin Falls County's 2010 to 2020 change (+16.6 percent) and Idaho's (+17.3 percent) are our calculation from the census counts.109 The national 2010 and 2020 census counts were not pulled for this card; a full card would add them from table P1. Per capita income for all four areas comes from BEA's county file (CAINC1, 1969 to 2024) so that every column shares one release; BEA's revised state file gives Idaho $61,345 for 2024 (step 8).
What the Kimberly card says
Read across the rows and a picture forms. Kimberly is growing about two and a half times as fast as Idaho, and Idaho is growing more than three times as fast as the nation. The town's permit pace held through the 2022 and 2023 slowdown. The homes are almost all single-family, and about four in five occupied homes are owner occupied, well above the state's share. Its residents mostly work elsewhere, especially in the city of Twin Falls. Its median home value is about the county's, and its median household income estimate is high but too uncertain to lean on. House prices and Fair Market Rents across the Twin Falls area rose far faster than inflation from 2020 to 2025, while county income per person barely beat inflation.
The card does not say whether Kimberly's growth is good or bad, who the newcomers are, how many acres of farmland at the town's edge became houses, or whether the water, sewer and school systems are keeping up. Those questions need the local records listed in the reporting box at the end of this lesson, and the module lessons on water, schools and roads and migration.
The Gooding contrast
Gooding, the county seat of Gooding County, about 33 miles northwest of Kimberly in a straight line (our calculation from Gazetteer coordinates), makes a useful second card. Its population grew an estimated 4.1 percent from 2020 to 2025; it permitted 54 units in six years, 14.6 per 1,000 residents; it has more jobs than working residents (1,913 jobs located in town and 1,697 residents with an Idaho job in 2024); its median home value ($186,100) and median household income ($41,899) are far below Kimberly's; and its Fair Market Rent rose much less in real terms. The same tools, applied to two towns of similar size in the same region, describe two different kinds of place. That is the point of building the card yourself.
Pictures, Numbers and Infographics
The key numbers from this lesson in one table, with the infographic version of the Kimberly card below it.
| Measure | United States | Idaho | Kimberly (or Twin Falls County where noted) | Year | Source |
|---|---|---|---|---|---|
| Population change from April 2020 base | +3.1% | +10.4% | +25.4% | 2020 to 2025 | Census Vintage 20251 |
| Housing unit change from April 2020 base | +5.5% | +12.9% | Twin Falls County +10.0% | 2020 to 2025 | Census Vintage 2025 HU15 |
| Units permitted per 1,000 residents | 28.1 | 61.5 | 108.5 | 2020 to 2025 | Census BPS; our calculation3 |
| Residents who work in town (share of residents with Idaho jobs) | Not computed | Not computed | 8.9% (197 of 2,211) | 2024 | LODES 8; our tabulation5 |
| Median home value, 2024 dollars | $332,700 | $418,600 | $339,400 (plus or minus $41,828) | 2020 to 2024 | ACS B250776 |
| Median household income, 2024 dollars | $80,734 | $77,800 | $97,799 (plus or minus $34,495) | 2020 to 2024 | ACS B190136 |
| Real house price change | +23.9% | +32.9% | Twin Falls metro +36.8% | 2020 Q2 to 2025 Q2 | FHFA HPI; our calculation32 |
| Real per capita income change | +2.1% | +3.4% | Twin Falls County +1.5% | 2020 to 2024 | BEA CAINC1; our calculation14 |
Common mistakes
These are general pitfalls in growth data, illustrated with the Kimberly and Gooding numbers rather than with anyone else's published errors.
Mixing estimate vintages
Taking 2020 from an old vintage and 2025 from the new one turns Kimberly's 25.4 percent growth into 39 percent, because the Vintage 2020 estimate (4,161) missed 465 people the census later counted.131 Always take a series from one vintage.
Calling an estimate a count
"Kimberly has 5,798 residents" reads like a count. It is a July 1, 2025 estimate. Write "an estimated 5,798" and give the vintage.
Treating permits as homes built or as the stock
Kimberly's 502 permitted units since 2020 are authorizations. The 2020 census count plus permits through 2024 (1,502 + 414 = 1,916) is not the 2024 housing stock: some permits were not built, some homes were finished after the period, and the census counts April 1 while permits run by calendar year. The ACS figure (1,848 plus or minus 232) is a separate estimate with its own error.
Using the wrong geography
County permit totals include every permit office in the county. Homes built outside Kimberly's city limits are counted under Twin Falls County's unincorporated area, not under Kimberly. A ZIP code or school district named for a town usually covers more land than the city. The commute table uses the city as drawn in Census boundary files.
Comparing ACS 1-year with 5-year, or ignoring the margin
A 2025 1-year figure for Twin Falls County and a 2020 to 2024 5-year figure for Kimberly describe different periods with different error. And a $30,000 gap between Kimberly's and the county's median household income is not statistically significant (Z = 1.44).27
Mixing nominal and real dollars
Twin Falls County's two-bedroom Fair Market Rent rose 60.4 percent in nominal terms from FY2020 to FY2025 and 29.0 percent after inflation. Both are true; the sentence has to say which one it means, and a comparison has to use the same kind on both sides.3637
Reading an index level as a price
The Idaho HPI of 853.00 and the Twin Falls metro HPI of 435.41 in 2025 Q2 do not mean Idaho homes cost twice as much. The indexes have different base periods. Only changes are comparable.3233
Ignoring base effects
A town of 3,700 that adds 12 homes in a year has a higher rate than a town of 100,000 that adds 300, but the larger town built 25 times as many homes. Report both the count and the rate.
What we know, what we don't, and what the data can show
What we know
- Kimberly's estimated population grew 25.4 percent from April 2020 to July 2025, about two and a half times Idaho's rate (Census Vintage 2025).
- Kimberly authorized 502 housing units from 2020 to 2025, 108.5 per 1,000 residents, mostly single-family (Census BPS).
- In 2024 most working Kimberly residents worked outside the town, nearly half in the city of Twin Falls (LODES 8, our tabulation).
- Twin Falls metro house prices rose 36.8 percent after inflation from 2020 Q2 to 2025 Q2, faster than Idaho and the nation (FHFA HPI).
- Twin Falls County's per capita personal income rose 1.5 percent after inflation from 2020 to 2024 (BEA CAINC1).
What we don't know
- How many acres in and around Kimberly were actually developed since 2020; the 93-acre change in Census land area is annexation as reported, not construction.
- Where Kimberly's new residents came from, and how many new homes went to newcomers versus families moving within the Magic Valley.
- Kimberly's median household income with any precision; the 90 percent range is about $63,000 to $132,000.
- Town-level price and rent trends; no agency publishes an index or annual rent series for a town this size.
- Whether OnTheMap's own 2024 figures, which use 2025 boundary files, match our tabulation exactly; we tabulated the raw files and did not rerun the tool.
What the data can show
- Whether permits kept pace with population: compare Census BPS place totals with Vintage 2025 population change for any Idaho city.
- Whether a town is a bedroom community or a job center: OnTheMap inflow and outflow (LODES) gives jobs per resident worker.
- Whether housing costs outran incomes: FHFA HPI and HUD FMR against BEA CAINC1, all deflated with CPI-U.
- How uncertain a small-town estimate is: the ACS margin of error and CV for tables B25077, B25064 and B19013.
- How much land a city added: Census Gazetteer place files year to year, checked against annexation filings under Idaho Code 63-215.
- County farmland trends at five-year intervals: Census of Agriculture Tables 1 and 8.
Questions people ask
How long does it take to build a growth card for one town?
With the template and the file names in this lesson, a first card takes most people a long afternoon: an hour or two to download and paste, an hour for the calculations and checks, and the rest for charts and the write-up. Updating it the next year is faster, because the workbook structure and formulas carry over and only the raw blocks change.
The city says one population and the Census Bureau says another. Which is right?
Cities sometimes publish their own estimates for planning, often based on utility hookups or permits multiplied by an average household size. Those can be good local information, but they are not the federal estimate, and the method may differ year to year. On a growth card, use the Census estimate for comparability with Idaho and the nation and quote the city's figure separately with its method. The Census Bureau's estimates can be challenged by a local government through a formal process if officials believe they are wrong.
My town is too small for some of these tables. What then?
Towns of a few hundred people still have census counts, population estimates and (if the town issues permits) BPS data. ACS 5-year estimates exist, but margins of error can exceed the estimate. Use the county for income and price trends, say plainly that you are doing so, and lean on counts (census, permits, LODES) rather than survey estimates. For very small places, OnTheMap figures are also small and can move a lot from year to year.
Most of the new houses near our town are outside city limits. How do I count them?
Census permit data credit those homes to the county's unincorporated area. In the place file, the county's unincorporated line appears with place code 99990 (Gooding County's unincorporated area authorized 26 units in 2025, for example).3 For a finer picture, ask the county building or planning department for its permit log by address, or use the county assessor's parcel records. The census designated places (CDPs) the Census Bureau draws around some unincorporated communities also have census counts and ACS estimates.
Why use county income instead of the town's?
BEA publishes personal income by county, not by city. The ACS gives town-level household and per capita income, but with wide margins for small towns, and as a five-year average. For a trend line, the county BEA series is more reliable; for a snapshot of the town itself, use the ACS with its margin.
OnTheMap and the ACS commuting table disagree. Why?
They measure different things. LODES counts jobs from employer records (a person with two jobs counts twice) and leaves out self-employed workers who are not on a payroll. ACS table S0801 asks a sample of workers how they got to work last week, with a margin of error. Use LODES for where jobs are and how many cross town lines; use S0801 for travel time, mode and work at home.
Can I use Zillow or a realtor's numbers instead of the FHFA index?
Private series can be useful for recent months and small areas, but they are private products with methods that can change, and some are model estimates, not sales. If you use one, label it as an industry source, say what it measures, and keep the FHFA index or ACS value beside it. Lesson 01 compares these sources in detail.
Hard questions
Is Kimberly's fast growth good for the town?
The case for: New residents and homes bring a larger tax base, more customers for local businesses, more students to keep schools staffed and programs open, and a place for families who work in Twin Falls to own a home in a small town. Builders, trades and suppliers in the Magic Valley earn their living from it. Kimberly's owner-occupied share (about 83 percent in the ACS) suggests many of the new homes are owner occupied.
The case against: Growth arrives faster than roads, water, sewer and school buildings can be paid for, and impact fees and property taxes from new homes may not cover the full cost. Farmland at the edge of town is lost for good. Prices and rents across the region rose faster than incomes after 2020, and longtime residents face higher assessments.
What the evidence shows: The growth itself is measured (population, permits, land area). Whether it pays its way is not on any federal table. It requires the city's and school district's budgets, impact fee reports and capacity studies, which are public records. Property tax effects are covered in Idaho Property Taxes.
Should a bedroom community try to add jobs, or accept its role?
The case for adding jobs: A town with about six jobs for every ten working residents depends on other cities' tax bases for employment, and long commutes cost residents time and money. Local jobs would keep more spending in town.
The case for accepting the role: Twin Falls is a short drive away and already has the employers and the infrastructure. Competing for employers with incentives can cost more than it returns, and residents may have chosen Kimberly for its quiet.
What the evidence shows: LODES shows the commuting pattern but not residents' preferences or the costs of either path. Lesson 12, Economic Development and Housing Pressure, covers what incentive agreements require and report.
Should a growth profile use city or county numbers?
The case for city: Residents and council members care about their town, and city limits are where the city's decisions apply. A county average can hide a town growing 25 percent beside one growing 4 percent.
The case for county: County data are more complete and more precise (BEA income, housing unit estimates, the Census of Agriculture, the 1-year ACS for larger counties), and growth spills across city lines through unincorporated subdivisions and commuting.
What the evidence shows: Both are needed. The Kimberly card uses city counts where they exist (population, permits, LODES, land area) and county series where they do not, and labels each.
Should small cities annex farmland to manage growth?
The case for annexing: Houses built on county land at the city's edge often need city water and sewer eventually; annexing lets the city plan streets and utilities and collect taxes from the people who use its services.
The case against: Annexation can speed the conversion of irrigated farmland and extend city costs, and landowners and neighbors may prefer to stay in the county.
What the evidence shows: Kimberly added about 93 acres to its limits between the 2020 and 2025 Gazetteer files. Idaho Code 50-222 sets the procedure, including landowner consent.23 Whether those acres were farmland and whether they have been built on is answerable from county assessor and planning records, not from federal tables.
For reporters and advocates
Federal data, free and downloadable: Census population and housing unit estimates (SUB-EST2025, CO-EST2025, CO-EST2025-HU-16), decennial tables P1 and H1, Building Permits Survey place and county files, LODES and OnTheMap, ACS 5-year tables DP04, DP05, B25077, B25064, B19013 and S0801, the FHFA House Price Index, HUD Fair Market Rents, BEA CAINC1, the Census of Agriculture and the Census Gazetteer files. FRED mirrors many of them with stable series IDs.
Local records to request:
- The city's building permit log by year and type, with addresses, and the count of certificates of occupancy issued (completions).
- Annexation ordinances adopted since 2020, with acreage, and the legal descriptions and maps filed with the county recorder, county assessor and the Idaho State Tax Commission under Idaho Code 63-215.24
- Subdivision plats approved and recorded, with lot counts and the date of final plat.
- The city's long-range land use plan and area of city impact agreement with the county.
- Water and sewer capacity reports and connection counts; impact fee collections and capital improvement plans.
- School district enrollment by school and year (the Idaho State Department of Education publishes district enrollment; districts hold building capacity studies).
- Idaho Department of Water Resources well permits and drilling records for new homes outside city service.
- County assessor reports on new construction value and land reclassified from agricultural to residential use.
Most of these are public records under the Idaho Public Records Act (Idaho Code Title 74, Chapter 1). The module Idaho Public Records Requests explains deadlines and fees, and its lesson Writing a Request That Works has sample language.
Questions to ask officials: How many permits did the city issue each year since 2020, and how many homes received occupancy? How many acres were annexed, and what was their use before? What is the city's estimate of its population, and how does it compare with the Census Bureau's? What share of new homes are served by city water and sewer, and how much capacity is left? What do impact fees cover, and what do they not?
The Idaho and Magic Valley angle: By the Census Bureau's Vintage 2025 housing unit estimates, Idaho's housing stock grew faster than any other state's from July 2023 to July 2024 and from July 2024 to July 2025, and second only to Utah's from April 2020 to July 2025 (our calculation).16 Kimberly shows how that growth looks in one small town: a bedroom community for Twin Falls adding homes faster than the state. The same card, built for Jerome, Buhl, Hagerman or Gooding, will show a different town, and the differences are the story. Lesson 11, Idaho vs. the United States, puts the state numbers beside the Mountain West.
Where to go next
- data.census.gov: The Census Bureau's free search tool for decennial and ACS tables. For anyone building a profile: type a table ID and a place name, add comparison geographies, and download as CSV or Excel. Free; no account needed.
- OnTheMap: Free Census Bureau mapping tool for where workers live and work, built on LODES. Search a place, choose Perform Analysis on Selected Area, then Inflow/Outflow or Destination, and export the report. Useful to city staff, reporters and planners.
- Census Building Permits Survey: Monthly and annual counts of new housing units authorized by permit-issuing places, counties, metros and states, with documentation. Free text files; open them in any spreadsheet.
- FRED, Federal Reserve Bank of St. Louis: Free mirror of thousands of agency series with stable IDs (for example BPPRIV016083 for Twin Falls County permits and CPIAUCNS for the CPI-U). Good for quick downloads and charts; cite the original agency.
- FHFA House Price Index: Free quarterly and annual repeat-sales price indexes for the nation, states, metros, counties and ZIP codes. Download the CSV files and compute percent changes; never compare index levels across areas.
- HUD USER Fair Market Rents: Free yearly FMR files by county and HUD metro area, with documentation of the method. Used by housing authorities, landlords and tenant advocates.
- BEA Regional Data: Free county personal income, per capita income and employment back to 1969 (tables CAINC1, CAINC4 and others). Interactive tables and bulk zip downloads.
- Data and Statistics for Reporters and Citizens (this site's training course): Free nine-lesson course on finding data, spreadsheets, pivot tables, cleaning data, uncertainty and honest charts, written for reporters, officials and residents.
Still being checked (2 items)
These points could not be fully confirmed against a primary source when this lesson was written and fact checked in November 2026. The text above states each one as uncertain.
- The reason Gooding city's housing unit count fell from 1,537 (2010 census) to 1,488 (2020 census). The figures are from the census redistricting files; the cause (demolition, reclassification or boundary change) was not confirmed with the city.
- Exact menu labels on data.census.gov, census.gov, fhfa.gov, huduser.gov and OnTheMap can change when agencies redesign their sites; the steps describe the menus as of November 2026 from the agencies' file locations and help pages, not from a screen-by-screen check of every page.
Last verified November 17, 2026. General education, not legal, financial or real estate advice; every figure names its source and year in the Notes and Sources below. Data is revised: check the newest release before relying on any number.
Notes
- U.S. Census Bureau, Population Division, Annual Estimates of the Resident Population for Incorporated Places, Vintage 2025, Idaho file SUB-EST2025_16 (columns ESTIMATESBASE2020 and POPESTIMATE2020 to POPESTIMATE2025), Kimberly city (place 43570) and Gooding city (place 32140), released May 14, 2026 (read Nov. 17, 2026). Read it online. ↩
- U.S. Census Bureau, National and State Population Totals, Vintage 2025 dataset NST-EST2025-ALLDATA, United States and Idaho (read Nov. 17, 2026). Read it online. ↩
- U.S. Census Bureau, Building Permits Survey, annual place-level files for the West Region, we2020a.txt to we2025a.txt (new privately owned housing units authorized, by number of units in the building), Kimberly (place 43570) and Gooding (place 32140), Idaho; units are the sum of the 1-unit, 2-unit, 3 and 4 unit and 5 or more unit columns (estimates with imputation) (read Nov. 17, 2026). Read it online. ↩
- U.S. Census Bureau, Building Permits Survey, annual state files st2020a.txt to st2025a.txt, Idaho and United States, units authorized by building size, estimates with imputation (read Nov. 17, 2026). Read it online. ↩
- U.S. Census Bureau, LODES 8, Idaho origin-destination files id_od_main_JT00_2023 and 2024 and id_od_aux_JT00_2023 and 2024 (all jobs, column S000), with the Idaho geography crosswalk id_xwalk (2024 files posted Oct. 14, 2026); place totals for Kimberly city and Gooding city are our tabulation (read Nov. 17, 2026). Read it online. ↩
- U.S. Census Bureau, American Community Survey 2020 to 2024 5-year estimates, table-based summary file (acsdt5y2024), tables B25077 (median value), B25064 (median gross rent), B19013 (median household income), B19301 (per capita income), B25001 (housing units), B25003 (tenure) and B03003 (Hispanic or Latino origin), with 90 percent margins of error; estimates in 2024 inflation-adjusted dollars (read Nov. 17, 2026). Read it online. ↩
- Idaho Department of Labor, "2026 CPI" (Consumer Price Index, CPI-U, U.S. city average, all items, 1982 to 84 = 100, not seasonally adjusted, with annual averages from BLS): 2020 258.811; 2021 270.970; 2022 292.655; 2023 304.702; 2024 313.689; 2025 321.943, with October 2025 shown as not available (read Nov. 17, 2026). Read it online. ↩
- U.S. Bureau of Labor Statistics, frequently asked questions on the 2025 federal government shutdown and the Consumer Price Index (2025 annual averages for series missing an October 2025 index are the average of the 11 published values) (read Nov. 17, 2026). Read it online. ↩
- U.S. Census Bureau, 2020 Census Redistricting Data (Public Law 94-171) Summary File, Idaho (id2020.pl.zip), tables P1 (total population), P2 (Hispanic or Latino) and H1 (occupancy status), places and counties; our tabulation of the state file (read Nov. 17, 2026). Read it online. ↩
- U.S. Census Bureau, 2010 Census Redistricting Data (Public Law 94-171) Summary File, Idaho (id2010.pl.zip), tables P1, P2 and H1; our tabulation of the state file (read Nov. 17, 2026). Read it online. ↩
- U.S. Census Bureau, press release on the Vintage 2025 city and town population estimates and the housing unit estimates, May 14, 2026 (read Nov. 17, 2026). Read it online. ↩
- U.S. Census Bureau, County Population Totals and Components of Change, Vintage 2025 dataset co-est2025-alldata (ESTIMATESBASE2020, POPESTIMATE2020 to POPESTIMATE2025, BIRTHS2025, DEATHS2025, DOMESTICMIG2025, INTERNATIONALMIG2025), Idaho, Twin Falls County and Gooding County (read Nov. 17, 2026). Read it online. ↩
- U.S. Census Bureau, Annual Estimates of the Resident Population for Incorporated Places, Vintage 2020, Idaho file SUB-EST2020_16 (columns CENSUS2010POP and POPESTIMATE2010 to POPESTIMATE2020), Kimberly city (read Nov. 17, 2026). Read it online. ↩
- U.S. Bureau of Economic Analysis, Regional Economic Accounts, table CAINC1, "Personal Income Summary: Personal Income, Population, Per Capita Personal Income," counties, 1969 to 2024 (CAINC1.zip), United States, Idaho, Twin Falls County and Gooding County, line 3 (read Nov. 17, 2026). Read it online. ↩
- U.S. Census Bureau, Annual Estimates of Housing Units for Counties in Idaho: April 1, 2020 to July 1, 2025 (CO-EST2025-HU-16), Vintage 2025 (read Nov. 17, 2026). Read it online. ↩
- U.S. Census Bureau, Annual Estimates of Housing Units for the United States, Regions, States, and the District of Columbia: April 1, 2020 to July 1, 2025 (NST-EST2025-HU), Vintage 2025 (read Nov. 17, 2026). Read it online. ↩
- U.S. Census Bureau, Building Permits Survey, "About the Surveys" (universe of about 20,000 permit-issuing places; imputation for places that do not report; over 98 percent of privately owned residential buildings are in permit-issuing places) (read Nov. 17, 2026). Read it online. ↩
- Federal Reserve Bank of St. Louis, FRED, series BPPRIV016083, "New Private Housing Structures Authorized by Building Permits for Twin Falls County, ID," annual, units, not seasonally adjusted, source U.S. Census Bureau; 2025 value 527 (read Nov. 17, 2026). Read it online. ↩
- U.S. Census Bureau, Building Permits Survey, annual county files co2020a.txt to co2025a.txt, Twin Falls County (16083), units authorized by building size, estimates with imputation (read Nov. 17, 2026). Read it online. ↩
- U.S. Census Bureau, "Boundary and Annexation Survey (BAS)" (conducted annually to update the legal boundaries and names of governments) (read Nov. 17, 2026). Read it online. ↩
- U.S. Census Bureau, 2020 Gazetteer Files, places, Idaho (2020_gaz_place_16.txt): Kimberly city land area 4,899,969 square meters (1.892 square miles); Gooding city 1.518 square miles (read Nov. 17, 2026). Read it online. ↩
- U.S. Census Bureau, 2025 Gazetteer Files, places, Idaho (2025_gaz_place_16.txt): Kimberly city land area 5,277,843 square meters (2.038 square miles); Gooding city 1.519 square miles (read Nov. 17, 2026). Read it online. ↩
- Idaho Code section 50-222, "Annexation by cities" (notice to landowners and the county with a legal description and a simple map; written landowner consent, required for most annexations, recorded with the county recorder) (read Nov. 17, 2026). Read it online. ↩
- Idaho Code section 63-215, "Legal description and map of boundaries to be recorded and filed" (a taxing district that changes its boundaries files a legal description and map with the county recorder, county assessor and Idaho State Tax Commission within 30 days and no later than Jan. 10 of the following year) (read Nov. 17, 2026). Read it online. ↩
- U.S. Census Bureau, Center for Economic Studies, "2023 LODES Data Released, OnTheMap Updated," Dec. 18, 2025 (LODES version 8.4; OnTheMap covers 2002 to 2023) (read Nov. 17, 2026). Read it online. ↩
- U.S. Census Bureau, LEHD Origin-Destination Employment Statistics (LODES) Dataset Structure, Format Version 8.5 (file dated Oct. 28, 2026; OD, RAC and WAC data for 2002 to 2024; main files cover jobs where worker and workplace are both in the state, auxiliary files cover workers who live out of state) (read Nov. 17, 2026). Read it online. ↩
- U.S. Census Bureau, Understanding and Using American Community Survey Data: What All Data Users Need to Know (2018), chapter 7, "Understanding Error and Determining Statistical Significance" (margins of error at 90 percent confidence; test for a difference; overlapping periods) (read Nov. 17, 2026). Read it online. ↩
- U.S. Census Bureau, press release announcing release dates for the 2025 ACS 1-year estimates, Oct. 13, 2026 (release Oct. 29, 2026; 1-year estimates for areas of 65,000 or more) (read Nov. 17, 2026). Read it online. ↩
- Novogradac (housing finance accounting firm; industry source), news item on the delayed 2025 ACS release, Sept. 8, 2026 (read Nov. 17, 2026). Read it online. ↩
- U.S. Census Bureau, Understanding and Using American Community Survey Data (2018), chapter 8, "Calculating Measures of Error for Derived Estimates" (standard error equals MOE divided by 1.645; sums, proportions and ratios) (read Nov. 17, 2026). Read it online. ↩
- U.S. Department of Housing and Urban Development, Office of Policy Development and Research, FY2026 Fair Market Rents, county file FY26_FMRs.xlsx (Twin Falls County, ID HUD Metro FMR Area: two-bedroom $1,284; Jerome County $1,186; Gooding County nonmetro $1,026) (read Nov. 17, 2026). Read it online. ↩
- Federal Housing Finance Agency, House Price Index, all-transactions index, metropolitan statistical areas (hpi_at_metro.csv), Twin Falls, ID (CBSA 46300), quarterly, not seasonally adjusted, through 2026 Q2 (read Nov. 17, 2026). Read it online. ↩
- Federal Housing Finance Agency, House Price Index, all-transactions index, states (hpi_at_state.csv), Idaho, quarterly, through 2026 Q2 (read Nov. 17, 2026). Read it online. ↩
- Federal Housing Finance Agency, House Price Index, all-transactions index, United States and census divisions (hpi_at_us_and_census.csv), USA, quarterly, through 2026 Q2 (read Nov. 17, 2026). Read it online. ↩
- U.S. Department of Housing and Urban Development, "Fair Market Rents for the Housing Choice Voucher Program, Moderate Rehabilitation Single Room Occupancy Program, and Other Programs Fiscal Year 2026," Federal Register 90, no. 161 (Aug. 22, 2025) (effective Oct. 1, 2025; estimate of the 40th percentile gross rent paid by recent movers into standard quality units; base rents from ACS 2019 to 2023 5-year; OMB metro definitions of July 21, 2023) (read Nov. 17, 2026). Read it online. ↩
- U.S. Department of Housing and Urban Development, FY2020 Fair Market Rents, file FY20_4050_FMRs_rev.xlsx (Twin Falls County, ID nonmetro two-bedroom $801; Gooding County $714; Jerome County, ID nonmetro $787) (read Nov. 17, 2026). Read it online. ↩
- U.S. Department of Housing and Urban Development, FY2025 Fair Market Rents, county file FY25_FMRs.xlsx (Twin Falls County two-bedroom $1,285; Gooding County $939; Jerome County, ID HUD Metro FMR Area $1,127) (read Nov. 17, 2026). Read it online. ↩
- U.S. Department of Agriculture, National Agricultural Statistics Service, 2022 Census of Agriculture, Volume 1, Chapter 2, Idaho County Level Data, Table 1, "County Summary Highlights: 2022" (Twin Falls County: 1,169 farms and 459,167 acres in farms) (read Nov. 17, 2026). Read it online. ↩
- U.S. Department of Agriculture, NASS, 2022 Census of Agriculture County Profile: Twin Falls County, Idaho (land in farms 459,167 acres, down 2 percent from 2017; farms 1,169, down 3 percent; market value of products sold up 67 percent) (read Nov. 17, 2026). Read it online. ↩
- U.S. Department of Agriculture, NASS, 2022 Census of Agriculture, Idaho, Table 8, "Farms, Land in Farms, Value of Land and Buildings, and Land Use: 2022 and 2017" (state: 11,547,963 acres in 2022 and 11,691,912 in 2017; 22,877 and 24,996 farms) (read Nov. 17, 2026). Read it online. ↩
- U.S. Bureau of Labor Statistics, CPI-U, U.S. city average, all items, not seasonally adjusted (BLS series CUUR0000SA0), read as FRED series CPIAUCNS, monthly values 1979 to October 2026; annual averages computed from the monthly values match the BLS annual averages (1979: 72.575; 2000: 172.2; 2010: 218.056) (read Nov. 17, 2026). Read it online. ↩
- U.S. Census Bureau, "Census Bureau Releases OnTheMap Update with More LODES Employment Data," release CB26-TPS.65, Nov. 5, 2026 (LODES 8.5 adds 2024; OnTheMap and LODES cover 2002 through 2024 for most states; 2024 data for Alaska and Michigan not included), and the notice of the same date on the LEHD home page (OnTheMap geography updated to the TIGER 2025 vintage) (read Nov. 17, 2026). Read it online. ↩
- U.S. Census Bureau, American Community Survey user note, "Updates to 2025 ACS 1-Year Data Release Rules" (revised Oct. 28, 2026; review of ACS disclosure avoidance methods to comply with Department of Commerce administrative order DAO 216-26) (read Nov. 17, 2026). Read it online. ↩
- U.S. Bureau of Economic Analysis, Regional Economic Accounts, table SAINC1, "Personal Income Summary," states, 1929 to 2025 (SAINC.zip, 2026 annual update released Sept. 30, 2026), line 3: Idaho 2020 $49,715, 2024 $61,345, 2025 $64,200; United States 2020 $59,151, 2024 $73,634; the county file CAINC1.zip still covered 1969 to 2024 on Nov. 17, 2026 (read Nov. 17, 2026). Read it online. ↩
Check yourself
1. Kimberly's population was 4,625 at the April 2020 estimates base and 5,798 on July 1, 2025 (Census Vintage 2025). What is the percent change?
5,798 / 4,625 = 1.254, a 25.4 percent increase, from Census SUB-EST2025_16 (ESTIMATESBASE2020 and POPESTIMATE2025).
2. Why should you not compare the Vintage 2020 estimate of Kimberly for 2020 (4,161) with the Vintage 2025 estimate for 2025?
SUB-EST2020_16 estimated 4,161 for July 2020, while the 2020 census counted 4,626. Mixing vintages inflates growth from 25.4 percent to about 39 percent.
3. In the Census Building Permits Survey annual place file, how do you get total new housing units authorized for a town?
The place files (for example we2025a.txt) list buildings, units and value for each building size; total units is the sum of the four Units columns.
4. Where do homes built under a county permit just outside Kimberly's city limits appear in Census permit data?
BPS counts permits by the issuing government; county-issued permits appear in the county unincorporated area line, as Gooding County's does in the 2025 West Region place file.
5. Kimberly's ACS 2020 to 2024 median household income is $97,799 plus or minus $34,495. What is its approximate coefficient of variation?
Standard error = 34,495 / 1.645 = 20,970; CV = 20,970 / 97,799 = 21.4 percent, using the formulas in the Census ACS handbook, chapters 7 and 8.
6. Using the ACS handbook test, is the gap between Kimberly's ($97,799, SE 20,970) and Twin Falls County's ($67,409, SE 2,250) median household income statistically significant at 90 percent?
Z = 30,390 / square root of (20,970 squared + 2,250 squared) = 1.44, below the 1.645 critical value (ACS handbook, chapter 7).
7. Which CPI-U annual average does this module use for 2025, and why is it unusual?
BLS averaged the 11 published 2025 months after the shutdown stopped October collection; the Idaho Department of Labor CPI table lists 321.943 with October not available.
8. From 2020 Q2 to 2025 Q2, the FHFA all-transactions index for the Twin Falls metro rose from 255.82 to 435.41. What is the real change in 2025 dollars?
(435.41 / 255.82) x (258.811 / 321.943) minus 1 = +36.8 percent, using FHFA hpi_at_metro.csv and CPI-U annual averages for 2020 and 2025.
9. In 2024, how many jobs were located in Kimberly per Kimberly resident holding an Idaho job, by our tabulation of LODES files?
1,277 jobs located in Kimberly divided by 2,211 residents with Idaho jobs = 0.58, from LODES 8 Idaho main and auxiliary OD files for 2024. Gooding's ratio was 1.13.
10. What does the 93-acre increase in Kimberly's Census Gazetteer land area from 2020 to 2025 measure?
Gazetteer land area (1.892 square miles in 2020, 2.038 in 2025) follows Census boundary files updated through the Boundary and Annexation Survey; it shows annexation, not construction.
Terms in this lesson
- Growth card
- A one-page summary of a place's population, housing, permits, commuting, prices, incomes and land, each figure with its year, source and comparisons to the county, Idaho and the United States.
- Vintage
- One annual release of Census population or housing unit estimates. Each vintage revises every year back to the last census, so a series must come from a single vintage.
- Estimates base
- The April 1, 2020 starting population the Census Bureau uses for Vintage 2021 and later estimates, built from the 2020 census with adjustments; column ESTIMATESBASE2020.
- Permit-issuing place
- A city, county or other government that issues building permits and reports them to the Census Building Permits Survey; homes in areas without permits are not counted.
- Unincorporated area
- Land outside any city's limits, governed by the county. In Census permit files its permits appear on a county line with place code 99990.
- LODES
- LEHD Origin-Destination Employment Statistics: Census Bureau files linking each job's work block to the worker's home block, the data behind OnTheMap.
- Inflow and outflow
- In OnTheMap, the counts of workers who come into an area for work, residents who leave it for work, and people who live and work in it.
- Coefficient of variation (CV)
- An ACS estimate's standard error divided by the estimate, as a percent. Standard error is the 90 percent margin of error divided by 1.645. Higher CVs mean less reliable estimates.
- Statistical significance test (Z)
- The difference between two estimates divided by the square root of the sum of their squared standard errors; above 1.645 means significant at the 90 percent level in ACS practice.
- Fair Market Rent (FMR)
- HUD's yearly estimate of rent plus utilities for modest units in an area, about the 40th percentile paid by recent movers, used for housing vouchers.
- Per capita personal income
- BEA's total personal income of an area's residents (wages, proprietors' income, rent, interest, dividends and transfers) divided by population, published yearly by county.
- Gazetteer file
- A Census Bureau text file listing each geographic area's land and water area and coordinates, drawn from its boundary files for a given year.
- Index (house price)
- A number that tracks change relative to a base period; only percent changes between dates are meaningful, not the level itself.
- Bedroom community
- A town where many more residents work elsewhere than there are jobs in town; in this lesson, measured as jobs located in town per resident worker.
Sources
- Census Bureau, Vintage 2025 incorporated place population estimates, Idaho (SUB-EST2025_16) (2026-05-14) checked 2026-11
- Census Bureau, Vintage 2025 county housing unit estimates, Idaho (CO-EST2025-HU-16) (2026-05-14) checked 2026-11
- Census Bureau, 2020 Census Redistricting Data (P.L. 94-171), Idaho (2021-08-12) checked 2026-11
- Census Bureau, Building Permits Survey annual place files, West Region (2026-11-17) checked 2026-11
- Census Bureau, LODES 8 Idaho files and LODES Technical Document 8.5 (2026-10-14) checked 2026-11
- Census Bureau, ACS 2020 to 2024 5-year table-based summary files (2026-11-17) checked 2026-11
- Census Bureau, Understanding and Using American Community Survey Data, chapters 7 and 8 (2026-11-17) checked 2026-11
- FHFA, House Price Index datasets (all-transactions, metro, state, U.S.) (2026-11-17) checked 2026-11
- HUD, FY2026 Fair Market Rents (2025-08-22) checked 2026-11
- BEA, CAINC1 county personal income summary (2026-11-17) checked 2026-11
- USDA NASS, 2022 Census of Agriculture, Idaho county data (2024-02-13) checked 2026-11
- Idaho Department of Labor, 2026 CPI table (CPI-U annual averages) (2026-11-17) checked 2026-11
- Census Bureau, 2020 and 2025 Gazetteer place files, Idaho (2026-11-17) checked 2026-11
- Census Bureau, OnTheMap update with 2024 LODES data (CB26-TPS.65) (2026-11-05) checked 2026-11