Lesson 8 of 13 · about 55 minutes · Updated November 17, 2026
Who Idahoans Are Now
You'll be able to
- Compare Idaho's age structure in 1980 and 2025 using census counts and population estimates, and explain what a population pyramid shows.
- Describe how the Hispanic share of Idaho and of Jerome, Minidoka, Gooding, Cassia, Canyon and Twin Falls counties changed from 1980 to 2025.
- Explain why the ACS and the population estimates can give different numbers for the same county, and choose the right one for a given use.
- Convert historical incomes to 2025 dollars with the CPI-U and compare Idaho with the nation.
- Calculate renter and owner housing cost burden from ACS tables B25070 and B25091.
- Find and cite the county demographic data a reporter, planner or advocate needs.
Start here: the short version
- Idaho has aged ten years since 1980. The 1980 Census put Idaho's median age at 27.5, two and a half years younger than the nation's 30.0. The American Community Survey (ACS) estimate for 2025 is 37.9 for Idaho and 39.5 for the United States.123
- The share of Idahoans 65 and over almost doubled. It was 9.9 percent in 1980 and 18.7 percent on July 1, 2025, by the Census Bureau's Vintage 2025 estimates. From 2020 to 2025 the 65-plus group grew by 69,556 people (22.5 percent) while the number of children under 18 grew by 9,853 (2.1 percent).14
- The Hispanic or Latino share of Idaho went from 3.9 percent to 14.8 percent. The 1980 Census counted 36,615 Hispanic Idahoans; the July 1, 2025 estimate is 299,881. Hispanic residents accounted for 31.7 percent of Idaho's population growth from 2020 to 2025.54
- In the Magic Valley the change is far larger. Jerome County went from 3.8 percent Hispanic in 1980 to 42.3 percent in the 2025 estimates; Minidoka County from 15.2 to 38.3 percent; Gooding County from 6.5 to 34.3 percent.67
- Idaho's real median household income closed most of its gap with the nation. In 2025 dollars, Idaho's 1979 median was $67,781 (90.8 percent of the U.S. median); the ACS 2025 estimate is $84,234 (99.4 percent of the U.S. figure of $84,780). Our calculation with the CPI-U.8910
- Housing costs bite renters hardest. In 2025, 48.8 percent of Idaho renter households paid 30 percent or more of income for rent and utilities, and 23.7 percent paid half or more. For owners, 21.8 percent paid 30 percent or more. All three are below the U.S. rates (51.8, 26.2 and 24.4 percent). Our calculations from ACS tables B25070 and B25091.11
- Fewer Idahoans were born here. In 1980, 50.3 percent of residents were born in Idaho; the ACS 2025 estimate is 44.5 percent, compared with 56.4 percent of all Americans living in their state of birth.1213
Data: 1980 Census of Population, Idaho (PC80-1-B14 and PC80-1-C14) and July 1, 1980 county intercensal estimates; 1990, 2000, 2010 and 2020 census and intercensal files; Census Vintage 2025 state and county population estimates by age, sex, race and Hispanic origin (released June 2026); ACS 2025 1-year estimates (released Oct. 29, 2026) for the U.S., Idaho and neighbor states; ACS 2020 to 2024 5-year estimates for counties; BLS CPI-U annual averages (2025 = 321.943). Checked Nov. 17, 2026. Agencies revise data; newer releases may differ.
Population numbers tell you how many people live in Idaho. This lesson is about who they are: how old, in what kind of households, of what background, born where, speaking what language at home, with how much schooling and income, and how many are stretched by housing costs. It covers the state, the nation, the Mountain West neighbors (Utah, Montana, Washington, Oregon, Nevada and Wyoming) and the Magic Valley counties, Jerome, Twin Falls, Gooding, Minidoka, Cassia and Lincoln, with Ada and Canyon counties for comparison. The time frame is 1980, the first census after the period this module starts, to the newest data released in 2026.
Two kinds of numbers carry most of this lesson, and they behave differently. The decennial census is a count of everyone, taken every ten years on April 1. The population estimates (the Census Bureau's annual numbers for July 1 of each year, called a "vintage" after the year they end in) start from the last census and add births, subtract deaths, and add or subtract migration. The American Community Survey (ACS) is a continuous monthly survey of a sample of addresses. It produces estimates with a margin of error, and the Census Bureau publishes 1-year estimates only for places of 65,000 people or more.14 Where a number is a count, this lesson says so; where it is an estimate, it says that too.
The lesson does not repeat what other lessons cover. Where new residents come from (migration flows, IRS data, state of birth in detail) is in Who Is Moving In and From Where. Where people work and commute is in Where People Work. Home prices and rents against inflation are in Prices and Rents vs. Inflation. The side-by-side comparison of Idaho and the nation across every trend is in Idaho vs. the United States. The six Magic Valley towns, one by one, are in The Magic Valley Case Study. How to read estimates and margins of error is in How to Measure Growth Without Fooling Yourself and in the training course Uncertainty.

Age: from a young state to a middle-aged one
In 1980 Idaho was one of the younger states in the country. The 1980 Census summary table for Idaho shows 32.5 percent of residents under 18, 57.6 percent aged 18 to 64, and 9.9 percent 65 or older, with a median age of 27.5.1 The median is the middle value: half the population is younger, half older. The national median that year was 30.0.2 The Census Bureau's 20th-century trends report shows the same pattern with a different cut: 27.1 percent of Idahoans were under 15 in 1980, against 22.6 percent of all Americans.15
The same 1980 table shows why: Idaho had many children per adult and larger households. It reports 2.85 persons per household in Idaho, against 2.75 nationally, and a population that had grown 32.5 percent since 1970.116
Median age, 1980 to 2025
Every census since then shows Idaho getting older, at about the same pace as the nation, while staying younger than the nation.
| Year | United States | Idaho | Gap (years) | Source |
|---|---|---|---|---|
| 1980 (census) | 30.0 | 27.5 | 2.5 | 1980 Census21 |
| 2000 (census) | 35.3 | 33.2 | 2.1 | Census 2000 SF1, P01317 |
| 2010 (census) | 37.2 | 34.6 | 2.6 | 2010 Census SF1, P1318 |
| 2020 (census) | 38.8 | 36.8 | 2.0 | 2020 Census DHC, P1319 |
| 2025 (ACS 1-year estimate) | 39.5 | 37.9 | 1.6 | ACS 2025, DP053 |
From 1980 to 2025 Idaho's median age rose 10.4 years and the nation's 9.5. The gap shrank most after 2010, the years when Idaho's 65-plus population grew fastest (see the table below); who moved in, and at what ages, is traced in lesson 6. One caution on the last row: the 2025 figure is a survey estimate while the earlier rows are census counts, so a change of a few tenths between 2020 and 2025 is within the range the two methods can differ.
The shape of the population: two pyramids
A population pyramid stacks five-year age groups from youngest at the bottom to oldest at the top, with males on one side and females on the other. A wide base means many children. A column shape means each age group is about the same size.
The 1980 pyramid below uses the Census Bureau's intercensal county estimates for July 1, 1980, added up for all 44 Idaho counties, because those files give every five-year group by sex in machine-readable form. They total 948,582 people, close to the April 1, 1980 census count of 943,935.201 The 2025 pyramid uses the Vintage 2025 state estimates for July 1, 2025, which total 2,029,733.4 Each bar is that group's share of all residents, so the two years can be compared even though the state more than doubled.
Three things stand out.
- The base shrank. Children under 5 were 9.93 percent of Idahoans in 1980 (5.11 percent boys and 4.83 percent girls) and 5.74 percent in 2025 (2.94 and 2.81; the parts do not add exactly because of rounding).204 Idaho still has more children per person than the nation (5.41 percent under 5 nationally in 2025), but the gap is smaller than it was.
- The top widened. Women 85 and older went from 0.60 percent of the population to 1.09 percent; men 85 and older from 0.31 to 0.75 percent. People aged 60 to 74 make up the largest bulge in the 2025 Idaho pyramid above age 50.
- The 1980 young-adult bulge has aged into the 2025 retirement bulge. The wide bars at ages 15 to 29 in 1980 are the baby boom. In 2025 those same people are 60 to 74.
Children and older adults since 2020
The Vintage 2025 estimates break Idaho's growth since the 2020 Census into age groups. Our calculation from the single-year-of-age file:4
| Age group | April 1, 2020 (estimates base) | July 1, 2025 (estimate) | Change | Percent change | Share of Idaho's growth |
|---|---|---|---|---|---|
| Under 18 | 462,249 | 472,102 | +9,853 | +2.1% | 5.2% |
| 18 to 64 | 1,067,273 | 1,178,474 | +111,201 | +10.4% | 58.3% |
| 65 and over | 309,601 | 379,157 | +69,556 | +22.5% | 36.5% |
| (of which 85 and over) | 30,985 | 37,412 | +6,427 | +20.7% | 3.4% |
| All ages | 1,839,123 | 2,029,733 | +190,610 | +10.4% | 100% |
More than a third of Idaho's growth in five years was people 65 and over; about one in twenty new residents was a child. That matters for schools (lesson 10 covers enrollment), for health care and Medicaid long-term care (see Idaho Medicaid), and for housing: older households are smaller, and they own at higher rates. The national pattern is similar. The share of Americans 65 and over rose from 16.8 percent in the 2020 base to 18.9 percent in 2025, by the same estimates; Idaho's rose from 16.8 to 18.7 percent.4
Age in the neighbor states
Idaho sits in the middle of the Mountain West on age. Utah, which has the largest households of these states, is far younger; Montana, Oregon and Wyoming are older. ACS 2025 1-year estimates:3
| Area | Median age | Under 18 | 65 and over |
|---|---|---|---|
| United States | 39.5 | 21.0% | 19.0% |
| Idaho | 37.9 | 23.2% | 18.8% |
| Utah | 32.6 | 25.9% | 13.0% |
| Montana | 41.0 | 20.0% | 22.4% |
| Washington | 38.9 | 20.3% | 18.3% |
| Oregon | 41.3 | 18.9% | 20.9% |
| Nevada | 39.6 | 20.6% | 18.3% |
| Wyoming | 41.5 | 20.7% | 21.4% |
Note that the ACS shows 18.8 percent of Idahoans 65 and over while the population estimates show 18.7 percent for the same year. The ACS weights its sample to match the estimates for broad age, sex, race and Hispanic groups, but its published age shares come from the survey responses and can differ slightly.21 Pick one source per comparison and say which.
Age in the counties
Inside Idaho the spread is wide. Ada County's median age in the Vintage 2025 estimates is 39.1; Canyon County's is 35.2. In the Magic Valley, Cassia County (33.1) and Jerome County (34.2) are among the youngest counties in the state, and Gooding County (38.0) is older.22 At the extremes, Madison County, home of Brigham Young University-Idaho, has a median age of 22.5, and Boise County, the rural mountain county northeast of the city of Boise, 54.3.22 In 1980 every Magic Valley county except Gooding had a median age under 31; Minidoka (25.9) and Cassia (25.3) were under 26.6
| County | Median age, 1980 (census) | Median age, July 1, 2025 (estimate) | Under 18, 1980 | Under 18, 2025 | 65+, 1980 | 65+, 2025 |
|---|---|---|---|---|---|---|
| Ada | 28.0 | 39.1 | 30.2% | 21.0% | 8.6% | 18.1% |
| Canyon | 28.3 | 35.2 | 32.3% | 25.8% | 11.8% | 15.7% |
| Twin Falls | 29.7 | 36.9 | 30.9% | 25.2% | 13.0% | 17.9% |
| Jerome | 28.5 | 34.2 | 33.4% | 29.1% | 10.8% | 14.7% |
| Gooding | 32.0 | 38.0 | 30.9% | 24.6% | 15.2% | 19.3% |
| Minidoka | 25.9 | 35.5 | 36.8% | 27.1% | 8.5% | 17.8% |
| Cassia | 25.3 | 33.1 | 38.4% | 29.5% | 9.6% | 15.9% |
| Lincoln | 30.0 | 35.8 | 32.4% | 26.2% | 12.7% | 17.1% |
| Idaho | 27.5 | 37.9 (ACS) | 32.5% | 23.3% | 9.9% | 18.7% |
Sources: 1980 Census PC80-1-B14 Table 14; Vintage 2025 county estimates (median age as published; under-18 and 65-plus shares are our calculations from the age-group counts); Idaho 2025 median from ACS 2025, shares from the state estimates.62234
Jerome and Cassia counties still have nearly three in ten residents under 18, far above Ada County's 21.0 percent. That is the clearest sign in the age data of where young families are settling and where school enrollment pressure is highest per resident.
Households: who lives together
A household is everyone who lives in one housing unit, related or not. A housing unit is a house, apartment, mobile home or room meant as separate living quarters. People in dorms, nursing homes, prisons and barracks live in group quarters and are not in households. The number of households is the number of occupied housing units, which is why household size matters so much for housing: if the same number of people split into smaller households, the state needs more homes even with no population growth.
Household size, 1980 to 2025
| Year | United States, persons per household | Idaho, persons per household | Source |
|---|---|---|---|
| 1980 (census) | 2.75 | 2.85 | CENSR-4; PC80-1-B14 Table 14161 |
| 2000 (census) | 2.59 | 2.69 | Census 2000 SF1, P01717 |
| 2010 (census) | 2.58 | 2.66 | 2010 Census SF1, P1718 |
| 2020 to 2024 (ACS 5-year) | 2.53 | 2.64 | ACS 5-year, DP0223 |
| 2025 (ACS 1-year) | 2.49 (margin of error plus or minus 0.01) | 2.59 (plus or minus 0.02) | ACS 2025, DP0213 |
Idaho households have shrunk from 2.85 people to about 2.59, and they remain about a tenth of a person larger than the national average. That sounds small, but it adds up. At 2025's household population of 1,979,475 people (ACS), the difference between 2.85 and 2.59 people per household is roughly 70,000 additional households, our arithmetic (1,979,475 divided by 2.59, minus 1,979,475 divided by 2.85).13 In other words, part of the housing Idaho built since 1980 went to house the same people in smaller groups, not new residents. Lesson 3 and lesson 11 compare permits with population growth.
The Mountain West spread is wide. ACS 2025 persons per household: Utah 2.88, Nevada 2.61, Idaho 2.59, Washington 2.47, Oregon 2.39, Montana 2.32, Wyoming 2.24.13
Living alone, married couples and children at home
In 1980, 19.9 percent of Idaho households were one person living alone, compared with 22.7 percent nationally. By 2000 the Idaho share was 22.4 percent (U.S. 25.8 percent).15 In the ACS 2025 estimates, 24.8 percent of Idaho households are one person living alone (our sum of the male and female householders living alone, 189,854 of 765,200 households) against 29.2 percent nationally.13
Idaho is still more likely than the nation to live in married-couple households: 55.8 percent of Idaho households in 2025 against 46.6 percent nationally, and 21.8 percent of Idaho households are married couples with their own children under 18, against 16.9 percent nationally. About 30.7 percent of Idaho households include at least one person under 18 and 33.8 percent include someone 65 or over.13
In the counties, the 2020 to 2024 ACS shows the largest households in Jerome County (3.02 persons per household) and Cassia County (2.95), and the smallest among the comparison counties in Ada County (2.49).23 In 1980, Minidoka (3.12) and Cassia (3.16) had the largest households in the Magic Valley; Twin Falls County had 2.74.6 Jerome County is the one Magic Valley county where average household size went up since 1980 (2.90 to 3.02), which fits its younger age profile and its growth in Hispanic families. The ACS margin of error for a small county is large enough that the difference between 2.90 and 3.02 should be read as "about the same or slightly larger," not as a precise measurement.

Race and Hispanic origin
Federal statistics ask two separate questions: whether a person is of Hispanic, Latino or Spanish origin, and what race or races the person is. Hispanic people may be of any race. In 1980 the census called the first group "Spanish origin." Since 2000, people have been able to report more than one race, which makes race totals before and after 2000 hard to compare.
The rules are changing again. On March 28, 2024, the Office of Management and Budget revised Statistical Policy Directive No. 15. The new standard requires a single combined race and ethnicity question, adds Middle Eastern or North African as a minimum category (seven categories in all), and gives agencies until March 28, 2029 to comply.24 Expect a break in the race and Hispanic series when the census and ACS switch to the combined question; numbers before and after will not line up exactly.
Hispanic Idaho, 1980 to 2025
| Year | U.S. Hispanic share | Idaho Hispanic residents | Idaho Hispanic share | Source |
|---|---|---|---|---|
| 1980 (census) | 6.4% | 36,615 | 3.9% | Working Paper 565 |
| 1990 (census) | 9.0% | 52,927 | 5.3% | Working Paper 56; CENSR-4515 |
| 2000 (census) | 12.5% | 101,690 | 7.9% | CENSR-415 |
| 2010 (census) | 16.3% | 175,901 | 11.2% | 2010 Census SF1, P425 |
| 2020 (April 1 estimates base) | 18.7% | 239,372 | 13.0% | Vintage 20254 |
| 2025 (July 1 estimate) | 20.5% | 299,881 | 14.8% | Vintage 20254 |
The number of Hispanic Idahoans grew about eightfold in 45 years (36,615 to 299,881), while Idaho's total population a little more than doubled. The national Hispanic share also tripled over the period, so Idaho has followed the national trend at a lower level: Idaho's share has run at roughly 60 to 72 percent of the national share in every year in the table (3.9 against 6.4 in 1980; 14.8 against 20.5 in 2025).
From the 2020 base to July 1, 2025, Idaho added 190,610 residents in the estimates. Of that growth, 60,509 (31.7 percent) were Hispanic residents, 103,676 (54.4 percent) were non-Hispanic white residents, and 26,425 (13.9 percent) were non-Hispanic residents of other races or more than one race. Our calculation from the Vintage 2025 state file.4 The Hispanic population grew 25.3 percent in five years; the non-Hispanic white population grew 7.0 percent.
The Magic Valley and Canyon County
The statewide numbers hide a sharp geographic pattern. Hispanic residents are concentrated in the irrigated farm and food-processing counties of southern Idaho: the Magic Valley, the Mini-Cassia area, Canyon County and Owyhee County. The table uses 1980 census counts and Census Bureau estimates for later years. 1990 is the July 1, 1990 county estimate; 2000 is the April 1, 2000 estimates base; 2010 is the 2010 Census count; 2020 is the April 1, 2020 estimates base.
| County | 1980 | 1990 | 2000 | 2010 | 2020 | 2025 | Hispanic residents, 2025 |
|---|---|---|---|---|---|---|---|
| Jerome | 3.8% | 6.6% | 17.1% | 31.0% | 38.0% | 42.3% | 11,148 |
| Minidoka | 15.2% | 19.4% | 25.5% | 32.4% | 36.5% | 38.3% | 8,771 |
| Gooding | 6.5% | 9.0% | 17.1% | 28.1% | 31.1% | 34.3% | 5,640 |
| Lincoln | 6.9% | 5.8% | 13.4% | 28.3% | 31.8% | 33.5% | 1,877 |
| Cassia | 9.2% | 13.4% | 18.7% | 24.9% | 29.1% | 32.3% | 8,523 |
| Canyon | 9.7% | 13.3% | 18.6% | 23.9% | 25.6% | 27.0% | 74,281 |
| Twin Falls | 4.4% | 5.9% | 9.4% | 13.7% | 16.9% | 19.6% | 19,160 |
| Ada | 2.2% | 2.7% | 4.5% | 7.1% | 9.1% | 10.9% | 59,426 |
| Idaho | 3.9% | 5.3% | 7.9% | 11.2% | 13.0% | 14.8% | 299,881 |
Sources: 1980 Census PC80-1-B14 Table 14 (Spanish origin percent); CO-99-10 county estimates for July 1, 1990; CO-EST00INT-ALLDATA-16 for the 2000 base and 2010 Census; CC-EST2025-ALLDATA-16 for 2020 and 2025. Shares after 1980 are our calculations from the published counts.626277
One row needs a warning. Lincoln County's dip from 6.9 percent in 1980 to 5.8 percent in 1990 compares an April census count with a July estimate for a county of about 3,400 people, where a few dozen people change the share by a point. Treat it as uncertain, and compare years within one file series where you can. Ada County's share rose in every period, from 2.2 percent to 10.9 percent; because Ada grew so fast overall, its 59,426 Hispanic residents in 2025 are the second-largest Hispanic population of any Idaho county after Canyon County's 74,281.
Jerome County is the standout. It went from below the state average in 1980 to the highest Hispanic share in Idaho in the 2025 estimates, ahead of Minidoka, Power and Clark counties.7 The jump came between 1990 (6.6 percent) and 2010 (31.0 percent). Lesson 7 looks at whether that timing matches the growth of dairy and food-processing jobs around Jerome and Gooding, and lesson 4 covers each town.
Two numbers for Jerome County: 39.2 or 42.3 percent?
This module's planning notes listed Jerome County as "39.2 percent Hispanic." That figure is real: it is the ACS 2020 to 2024 5-year estimate.28 The Vintage 2025 population estimates put Jerome County at 42.3 percent on July 1, 2025 (11,148 of 26,362 residents).7 Both are Census Bureau numbers. They differ because they measure different things:
- The ACS 5-year figure is an average over survey responses collected from 2020 through 2024, centered on about mid-2022.
- The population estimate is for one date, July 1, 2025, built from the 2020 Census plus births, deaths and migration by Hispanic origin.
For a single date, use the estimate. For a share that you will set beside other ACS numbers such as income, language or poverty for the same county, use the ACS figure so that all the numbers come from the same survey. Either way, say which one you used. The ACS marks the county Hispanic percentage with a special code (-555555555) that means the estimate is controlled to the population estimates and "may be treated as" having no sampling error.21
Race groups in Idaho
Idaho remains much less racially diverse than the nation, but every minority group has grown faster than the total since 1980. The 1980 numbers are single-race census counts; the 2025 numbers are ACS "alone or in combination" estimates, which count anyone who reported the race, alone or with another race, so they are not strictly comparable and the 2025 shares are upper bounds.
| Group | Idaho 1980 (census) | Idaho 2025 (ACS, alone or in combination) | U.S. 2025 (ACS, alone or in combination) |
|---|---|---|---|
| American Indian and Alaska Native | 10,521 (1.1%) | 80,102 (3.9%) | 3.2% |
| Asian and Pacific Islander (1980); Asian (2025) | 5,948 (0.6%) | 65,137 (3.2%) | 8.1% |
| Black or African American | 2,716 (0.3%) | 37,392 (1.8%) | 14.5% |
| Native Hawaiian and Other Pacific Islander | (in Asian and Pacific Islander) | 12,185 (0.6%) | 0.5% |
| Two or more races | (not asked) | 228,924 (11.3%) | 13.7% |
| Non-Hispanic white (alone, 2025) | 886,187 (93.9%) | 1,543,463 (76.0%) | 55.0% |
Sources: Working Paper 56 and CENSR-4 for 1980 and 1990; ACS 2025 1-year DP05.5153 In 1980, 907,320 Idahoans (96.1 percent) were not of Hispanic origin, and 886,187 (93.9 percent) were non-Hispanic white.15
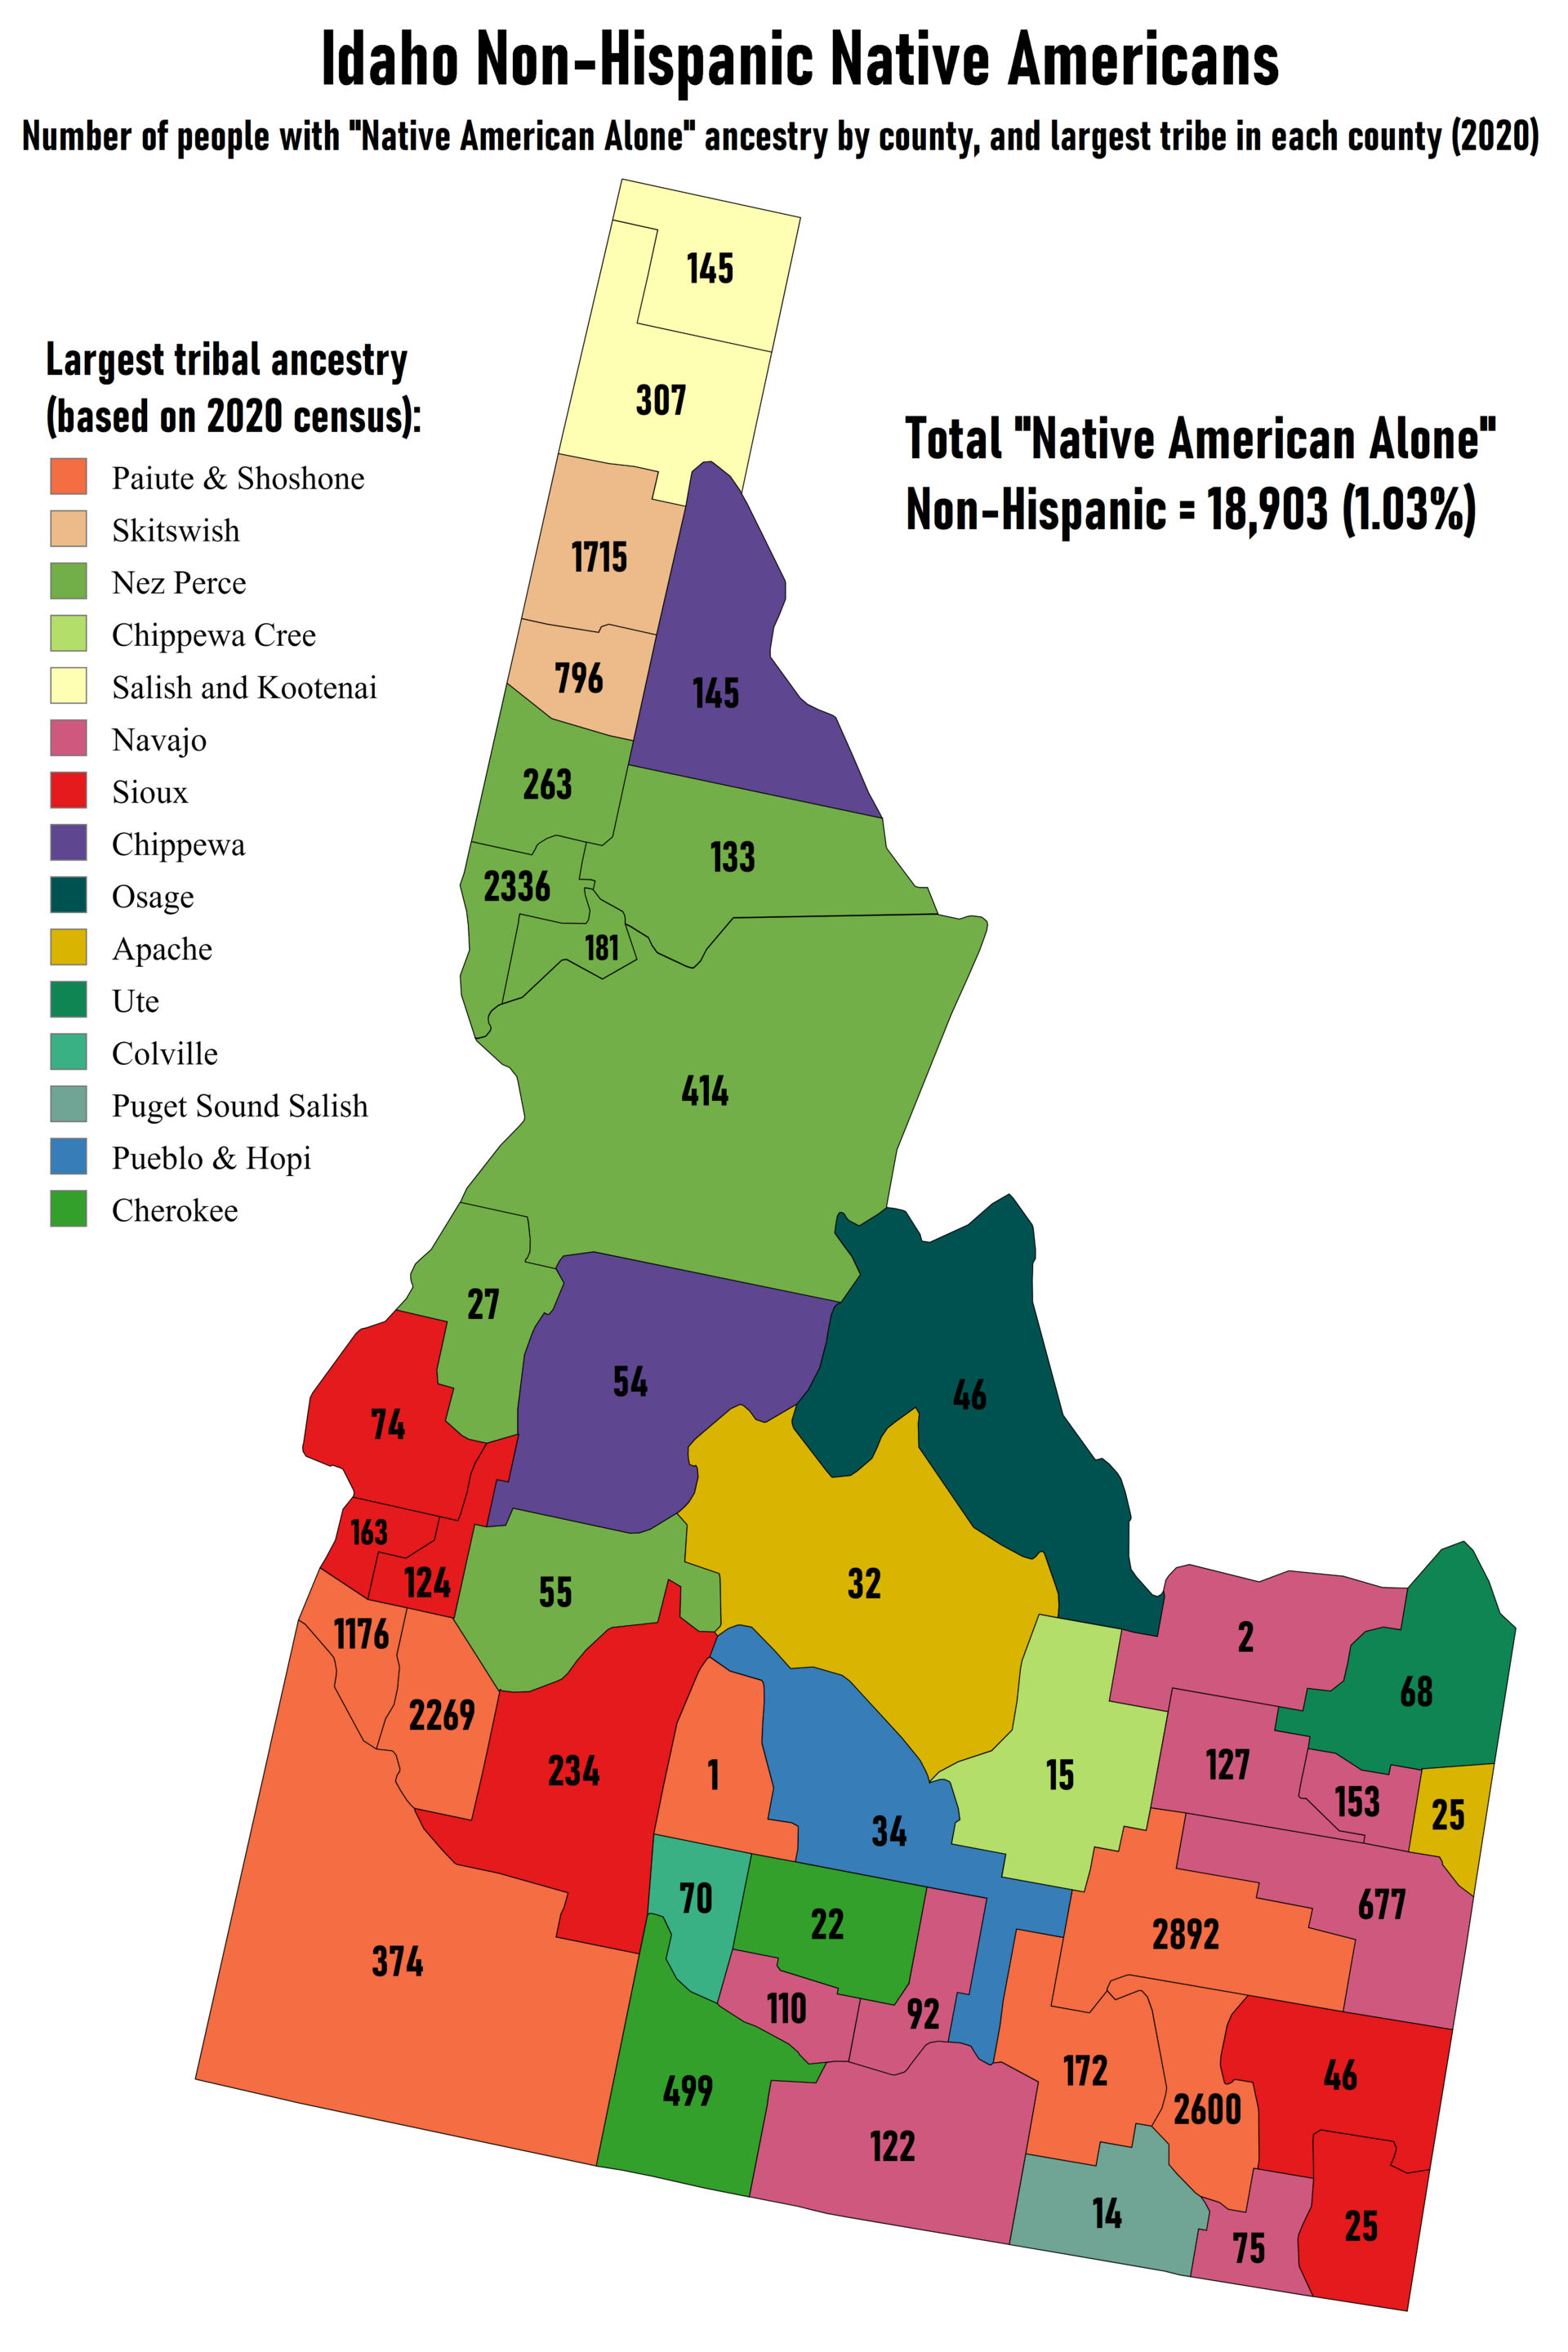
The "two or more races" line jumped nationally between 2010 and 2020, from about 9 million people to 33.8 million. The Census Bureau said it expected the change was "largely due to the improvements to the design of the two separate questions" and to updated processing and coding, so much of that jump is a change in measurement.29 Idaho's American Indian and Alaska Native share is above the national share. Five tribes have governments in Idaho: the Coeur d'Alene Tribe, the Kootenai Tribe of Idaho, the Nez Perce Tribe, the Shoshone-Bannock Tribes and the Shoshone-Paiute Tribes.30 The map below shows the largest Native American ancestry group reported by county.

The Mountain West comparison
ACS 2025 1-year estimates for Hispanic or Latino share: Nevada 31.2 percent, Utah 17.6, Oregon 16.2, Washington 15.5, Idaho 14.6, Wyoming 11.5, Montana 5.2; the U.S. is 20.5 percent.3 (Idaho's ACS figure, 14.6 percent, is slightly below the 14.8 percent in the population estimates; the difference is the survey versus estimate gap described above.) Among people of Hispanic origin in Idaho, the ACS counts 234,625 of Mexican origin, 11.6 percent of all Idahoans, the same share as for the nation.3 Idaho's Hispanic community is overwhelmingly of Mexican origin, while nationally Puerto Rican, Cuban, Central American and South American origins make up a larger part of the Hispanic total.
Born where, and speaking what at home
Foreign-born Idahoans
A foreign-born person is anyone who was not a U.S. citizen at birth, including naturalized citizens, lawful permanent residents, temporary residents and people without legal status. The census and ACS do not ask legal status.
| Year | U.S. foreign-born share | Idaho foreign-born residents | Idaho foreign-born share | Source |
|---|---|---|---|---|
| 1970 (census) | 4.7% | 12,572 | 1.8% | Working Paper 81, Table 1431 |
| 1980 (census) | 6.2% | 23,404 | 2.5% | Working Paper 81; PC80-1-C143112 |
| 1990 (census) | 7.9% | 28,905 | 2.9% | Working Paper 8131 |
| 2000 (census) | 11.1% | 64,080 | 5.0% | Working Paper 8131 |
| 2020 to 2024 (ACS 5-year) | 14.1% | 114,849 | 5.9% | ACS 5-year, DP0223 |
| 2025 (ACS 1-year) | 14.7% | 122,134 | 6.0% | ACS 2025, DP0213 |
Idaho's foreign-born share more than doubled from 1980 to 2000 and has grown slowly since. In 2025 about half of Idaho's foreign-born residents (50.1 percent, about 61,200 people) were naturalized U.S. citizens, near the national rate of 53.9 percent.13 Most of Idaho's Hispanic residents were born in the United States: the ACS counts 296,546 Hispanic Idahoans and 122,134 foreign-born Idahoans of all origins, so even if every foreign-born Idahoan were Hispanic (they are not), most Hispanic residents would be U.S.-born.313
In the counties, the 2020 to 2024 ACS estimates the foreign-born share at 17.9 percent in Jerome County (margin of error plus or minus 1.9 points), 15.7 percent in Lincoln, 14.0 in Gooding, 11.8 in Minidoka, 10.3 in Cassia, 8.7 in Canyon, 8.5 in Twin Falls and 6.2 in Ada.23 Which countries those residents were born in is in ACS table B05006 (place of birth for the foreign-born population); for small counties, use the 5-year table and expect wide margins.
Language spoken at home
In 1980, 5.6 percent of Idahoans aged 5 and over spoke a language other than English at home.12 The ACS 2025 estimate is 10.9 percent (plus or minus 0.6), with Spanish spoken at home by 7.9 percent. Only 3.0 percent of Idahoans 5 and over report speaking English less than "very well," against 8.5 percent nationally.13 In the Magic Valley the 2020 to 2024 ACS estimates are much higher: 34.7 percent of Jerome County residents 5 and over speak a language other than English at home (33.7 percent Spanish), 27.8 percent in Lincoln, 27.5 percent in Gooding, 25.7 percent in Minidoka, 22.3 percent in Cassia, 19.2 percent in Canyon and 14.9 percent in Twin Falls County.23 For school districts, courts, clinics and county offices, those are the numbers that drive interpreter and bilingual staffing.
Born in Idaho
The 1980 Census found 50.3 percent of Idahoans born in Idaho.12 The ACS 2025 estimate is 44.5 percent (plus or minus 1.0), while 48.5 percent were born in another state. Nationally 56.4 percent live in the state they were born in. Among the six neighbor states, only Nevada (29.0 percent) and Wyoming (39.7 percent) have smaller born-here shares than Idaho; Utah's is 59.0 percent.13 Lesson 6 covers where the other half came from.
Schooling: high school and college
Educational attainment is measured for people 25 and over, so it changes slowly; it reflects schooling finished years or decades earlier, much of it in other states.
| Year | U.S., high school graduate or higher | Idaho, high school graduate or higher | U.S., bachelor's degree or higher | Idaho, bachelor's degree or higher |
|---|---|---|---|---|
| 1980 (census) | 66.5% | 73.7% | 16.2% | 15.8% |
| 1990 (census) | 75.2% | 79.7% | 20.3% | 17.7% |
| 2000 (census) | 80.4% | 84.7% | 24.4% | 21.7% |
| 2020 to 2024 (ACS 5-year) | 89.6% | 91.9% | 35.7% | 31.8% |
| 2025 (ACS 1-year) | 90.6% | 92.6% | 37.4% | 33.2% |
Sources: A Half-Century of Learning (PHC-T-41) Tables 5a and 6a for 1980 to 2000; ACS 2020 to 2024 5-year and ACS 2025 1-year DP02. The 1980 Idaho figures match the 1980 Census Idaho summary table (73.7 percent high school graduates; 15.8 percent with four or more years of college).32122313
Idaho has led the nation on high school completion for adults in every year shown and trailed it on bachelor's degrees in every year shown. The bachelor's gap was 0.4 points in 1980 and 4.2 points in 2025. Among the Mountain West states in 2025, Washington (41.4 percent), Utah (39.1), Oregon (36.6) and Montana (36.2) all have higher bachelor's shares than Idaho (33.2); Wyoming (33.7) is about the same and Nevada (29.0) is lower.13
Inside Idaho the county differences are large. The ACS 2020 to 2024 estimates show 44.6 percent of Ada County adults 25 and over with a bachelor's degree, 23.5 percent in Twin Falls County, 23.2 percent in Canyon, 21.3 percent in Cassia, 16.2 percent in Gooding, 15.7 percent in Minidoka, 14.0 percent in Jerome (plus or minus 2.2 points) and 11.1 percent in Lincoln.23 The gap between Ada County and Jerome County, about 30 points, is nearly eight times the 3.9-point gap between Idaho and the nation in the same survey, and it matters for local wages and for who can fill the jobs that economic development incentives bring (see lesson 12).
Income: catching up with the nation
Two income measures are used here. Median household income is the middle household's income from all sources in the year before the survey. Per capita income is total income divided by all residents, including children, so it is lower in places with large families. Both come from the census and ACS. The Bureau of Economic Analysis publishes a different per capita personal income series (it includes things like employer health contributions and imputed rent); lesson 9 uses that series, and the two should never be mixed in one table.
How we figured it: real dollars
Dollars from different years buy different amounts. To compare them we convert every figure to 2025 dollars with one deflator for the whole module, the Bureau of Labor Statistics Consumer Price Index for All Urban Consumers (CPI-U), U.S. city average, all items, annual average (series CUUR0000SA0).10
real = nominal x (CPI 2025 / CPI year)
- CPI-U annual averages used: 1979 = 72.6; 1999 = 166.6; 2025 = 321.943. BLS did not collect October 2025 prices during the lapse in federal appropriations, and its 2025 annual average (321.943) is the value it published for the year.1033
- Idaho's 1979 median household income was $15,285 in 1979 dollars. 15,285 x (321.943 / 72.6) = $67,781 in 2025 dollars.
- The ACS already reports 2025 income "in 2025 inflation-adjusted dollars," so the 2025 ACS figures are not converted again. ACS 5-year figures for 2020 to 2024 are in 2024 dollars; we leave them as published and do not mix them with 2025-dollar figures in a single comparison.
- Income questions differ: the 1980 Census asked about calendar-year 1979 income; the ACS asks about the 12 months before the interview. The comparison is close, not exact.
Median household income, 1979, 1999 and 2025
| Measure | 1979 (census) | 1999 (census) | 2025 (ACS 1-year) |
|---|---|---|---|
| U.S. median household income, as published | $16,841 | $41,994 | $84,780 (plus or minus $215) |
| Idaho median household income, as published | $15,285 | $37,572 | $84,234 (plus or minus $1,941) |
| U.S., in 2025 dollars (our calculation) | $74,681 | $81,151 | $84,780 |
| Idaho, in 2025 dollars (our calculation) | $67,781 | $72,605 | $84,234 |
| Idaho as a percent of U.S. | 90.8% | 89.5% | 99.4% |
| U.S. per capita income, as published | $7,298 | $21,587 | $47,171 |
| Idaho per capita income, as published | $6,248 | $17,841 | $41,816 |
| Idaho per capita, in 2025 dollars (our calculation) | $27,707 | $34,477 | $41,816 |
| Idaho per capita as a percent of U.S. | 85.6% | 82.6% | 88.6% |
Sources: Census Bureau historical income tables S1 and S3 (decennial census); 1980 Census PC80-1-C14 Table 57; ACS 2025 1-year DP03; CPI-U as in the methods box.834910
In real terms Idaho's median household income rose 24 percent from 1979 to 2025; the nation's rose 14 percent. Almost all of Idaho's gain relative to the nation came after 1999: Idaho was at 89.5 percent of the U.S. median in 1999 and at 99.4 percent in 2025. The ACS margin of error for Idaho (plus or minus $1,941) is wider than the $546 difference between Idaho and the U.S., so the honest statement is that Idaho's median household income in 2025 is statistically indistinguishable from the national median.
Per capita income tells a slightly different story. Idaho still trails the nation by more than 11 percent per person, because Idaho households are larger and contain more children who have no income. Both measures are true at once.
The income gains are not evenly spread. In the ACS 2020 to 2024 estimates (in 2024 dollars), median household income is $91,502 in Ada County, $76,488 in Canyon, $71,724 in Jerome (plus or minus $3,145), $71,453 in Lincoln, $70,830 in Cassia, $70,377 in Minidoka, $67,409 in Twin Falls (plus or minus $3,701) and $63,559 in Gooding (plus or minus $6,340); Idaho's is $77,800 and the nation's $80,734.35 The ACS 2025 1-year estimates, in 2025 dollars, put Ada County at $100,464 (plus or minus $3,165), Twin Falls County at $85,895 (plus or minus $6,442) and Canyon County at $84,366 (plus or minus $3,521).36 Per capita income in Jerome County ($29,353) is 75 percent of the Idaho figure ($38,952) in the same survey, partly because Jerome County households average 3.02 people.3523 Note that these 5-year county figures are in 2024 dollars and centered on about 2022; they are not comparable with the 2025 state figures above without adjustment.
The income data cannot answer the question many readers bring to it: did newcomers raise Idaho's median, or did existing residents' incomes rise? The census and ACS do not follow the same households over time. IRS migration data, which compares the incomes of households that moved in with those that moved out, is the better tool, and it is covered in lesson 6.
Poverty
The official poverty rate compares a family's income before taxes with a dollar threshold that varies by family size and is the same everywhere in the country; it does not adjust for Idaho's housing costs. The census and ACS rates are for people whose poverty status can be determined, which excludes people in institutions, military barracks and college dorms and unrelated children under 15.
| Area | 1979 (1980 Census) | 1999 (2000 Census) | 2020 to 2024 (ACS 5-year) | 2025 (ACS 1-year) |
|---|---|---|---|---|
| United States | 12.4% | 12.4% | 12.5% | 11.8% |
| Idaho | 12.6% | 11.8% | 10.6% | 9.7% (plus or minus 0.7) |
| Ada County | 8.5% | 7.7% | 8.3% | 7.7% (plus or minus 1.0) |
| Canyon County | 15.0% | 12.0% | 10.5% | 10.8% (plus or minus 2.3) |
| Twin Falls County | 12.0% | 12.7% | 11.5% | 7.7% (plus or minus 2.0) |
| Jerome County | 12.9% | 13.9% | 12.6% (plus or minus 2.7) | (not published, under 65,000) |
| Gooding County | 17.8% | 13.8% | 13.0% (plus or minus 3.5) | (not published) |
| Minidoka County | 14.4% | 14.8% | 14.5% (plus or minus 2.9) | (not published) |
| Cassia County | 14.6% | 13.6% | 12.4% (plus or minus 3.6) | (not published) |
| Lincoln County | 18.3% | 13.1% | 10.5% (plus or minus 2.7) | (not published) |
Sources: Census Bureau, Population by Poverty Status in 1979 and in 1999, by county (decennial census); ACS 2020 to 2024 5-year and 2025 1-year DP03 (the 1-year figures exist only for counties of 65,000 or more). 1979 and 1999 county rates are rounded from the published percentages.373835936
Idaho's poverty rate was slightly above the nation's in 1979 and is below it now. In 2025, 11.0 percent of Idaho children under 18 lived below the poverty line, against 14.8 percent nationally; for people 65 and over the rates were 9.1 and 11.2 percent.9 In the Magic Valley, Minidoka County's poverty rate has stayed near 14 to 15 percent in every period, while Gooding and Lincoln counties' rates fell sharply from 1979. The county margins of error (2.7 to 3.6 points) are large, so small changes between the 1999 and 2020 to 2024 columns should not be described as trends. The same caution applies to Twin Falls County's 2025 1-year rate of 7.7 percent: it is 3.8 points below the 5-year figure, but its margin of error is plus or minus 2.0 points, and a single-year estimate for a county of about 97,500 people moves around. Wait for a second year before calling it a change.
Housing cost burden: who is stretched
A household is cost-burdened when it pays 30 percent or more of its income for housing, and severely cost-burdened at 50 percent or more. For renters, housing cost is gross rent (rent plus utilities and fuel). For owners, it is selected monthly owner costs: mortgage payments, property taxes, insurance, utilities and fees such as HOA dues. These cutoffs are a convention used by HUD and others, not a law.
How we figured it: cost-burden shares
The ACS publishes the counts, not the shares we use. For renters we used table B25070 (gross rent as a percentage of household income): burdened = the 30.0 to 34.9, 35.0 to 39.9, 40.0 to 49.9 and 50 percent or more groups; the base is all renter households minus those "not computed" (households with no income or no cash rent). For owners we used table B25091 (mortgage status by selected monthly owner costs as a percentage of household income), adding households with and without a mortgage, with the same rule for "not computed." Example, Idaho renters, ACS 2025: 101,068 burdened of 207,078 computed = 48.8 percent.11
| Measure | U.S. 2010 | Idaho 2010 | U.S. 2019 | Idaho 2019 | U.S. 2025 | Idaho 2025 |
|---|---|---|---|---|---|---|
| Renters paying 30%+ of income | 53.0% | 50.9% | 48.4% | 45.7% | 51.8% | 48.8% |
| Renters paying 50%+ | 27.4% | 25.1% | 23.7% | 19.6% | 26.2% | 23.7% |
| Owners with a mortgage paying 30%+ | 38.0% | 36.8% | 26.6% | 23.6% | 30.7% | 28.2% |
| Owners without a mortgage paying 30%+ | 15.5% | 12.1% | 12.5% | 9.2% | 15.4% | 11.8% |
| All owners paying 30%+ | 30.7% | 29.1% | 21.3% | 18.5% | 24.4% | 21.8% |
| All owners paying 50%+ | 12.3% | 10.7% | 8.5% | 6.6% | 10.7% | 9.0% |
| Renter households (computed) | 36,656,468 | 161,329 | 41,048,717 | 174,095 | 43,437,030 | 207,078 |
Sources: our calculations from ACS 1-year tables B25070 and B25091, 2010, 2019 and 2025.394011
Three patterns stand out. First, Idaho households are less burdened than the nation on every line in every year. Second, burdens fell from 2010 (just after the housing crash, when incomes were depressed and many owners had high payments) to 2019, then rose again by 2025 after the price and rent jumps of 2020 to 2022 (lesson 9). Third, the number of Idaho renter households with computed burdens grew from 161,329 in 2010 to 207,078 in 2025, so even a steady percentage means more burdened households: 49,071 Idaho renter households paid half or more of their income for housing in 2025, against 40,450 in 2010.3911
The Mountain West in 2025: renters paying 30 percent or more were 53.1 percent in Oregon and Nevada, 50.6 percent in Washington, 50.3 percent in Utah, 48.8 percent in Idaho, 48.7 percent in Montana and 41.8 percent in Wyoming.11
For counties, the ACS 2020 to 2024 5-year tables give these shares (our calculation, same method): renters paying 30 percent or more were 51.8 percent in Twin Falls County, 49.0 percent in Ada, 48.6 percent in Canyon, 43.6 percent in Gooding, 36.1 percent in Minidoka and 34.8 percent in Jerome; owners paying 30 percent or more were 22.1 percent in Jerome, 22.0 in Canyon, 21.7 in Twin Falls, 19.5 in Ada, 19.1 in Gooding and 18.7 in Minidoka.41 Jerome County's renter figure rests on about 1,700 renter households with computed burdens, and the margin of error on its 50-percent-plus count (271 households, plus or minus 114) is large. The low Jerome and Minidoka renter shares may reflect larger renter households with several earners, or housing provided by farm employers; the table cannot tell which.
Part D of this series, coming later, covers affordability programs, housing authorities and income limits. For the price and rent side of the ratio, see lesson 9.
Veterans, disability and health insurance
Idaho has a larger share of veterans than the nation: 7.4 percent of civilians 18 and over in the ACS 2025 estimates (115,297 people), against 5.9 percent nationally. Montana (8.6), Wyoming (8.2) and Nevada (7.2) are similar; Utah (4.4) is far lower.13 The ACS 2020 to 2024 estimates show 8.4 percent veterans in Canyon and Gooding counties, 7.8 percent in Ada, 7.4 percent in Twin Falls and 6.2 percent in Jerome.23 Because the veteran population skews older, the share will fall as Vietnam-era veterans age.
About 14.6 percent of Idaho's civilian noninstitutionalized population reported a disability in the ACS 2025 estimates (13.7 percent nationally), including 33.2 percent of Idahoans 65 and over.13 With the 65-plus population growing by 22.5 percent in five years, the count of older Idahoans with a disability is growing faster than the population as a whole.
Idaho's uninsured rate in 2025 was 9.5 percent, above the national 8.4 percent; for children under 19 it was 8.1 percent against 6.1 percent nationally.9 Coverage rules and Medicaid expansion are covered in the Idaho Medicaid module.
Pictures, Numbers and Infographics
The key numbers from this lesson in one table. "Then" is the 1980 Census unless marked; "now" is the newest release named in the row.
| Measure | United States | Idaho | Jerome County | Year | Source |
|---|---|---|---|---|---|
| Median age, then | 30.0 | 27.5 | 28.5 | 1980 | 1980 Census216 |
| Median age, now | 39.5 (ACS) | 37.9 (ACS) | 34.2 (estimate) | 2025 | ACS 2025 DP05; Vintage 2025322 |
| Share 65 and over, then | 11.3% | 9.9% | 10.8% | 1980 | CENSR-4; 1980 Census1516 |
| Share 65 and over, now | 18.9% | 18.7% | 14.7% | July 1, 2025 | Vintage 2025 (our calculation)422 |
| Persons per household, then | 2.75 | 2.85 | 2.90 | 1980 | CENSR-4; 1980 Census1616 |
| Persons per household, now | 2.53 | 2.64 | 3.02 | 2020 to 2024 | ACS 5-year DP0223 |
| Hispanic or Latino share, then | 6.4% | 3.9% | 3.8% | 1980 | Working Paper 56; 1980 Census56 |
| Hispanic or Latino share, now | 20.5% | 14.8% | 42.3% | July 1, 2025 | Vintage 2025 (our calculation)47 |
| Foreign-born share, then | 6.2% | 2.5% | not checked | 1980 | Working Paper 8131 |
| Foreign-born share, now | 14.1% | 5.9% | 17.9% (plus or minus 1.9) | 2020 to 2024 | ACS 5-year DP0223 |
| Language other than English at home, now | 22.3% | 11.0% | 34.7% (plus or minus 1.8) | 2020 to 2024 | ACS 5-year DP0223 |
| Bachelor's degree or higher (25+), then | 16.2% | 15.8% | not checked | 1980 | PHC-T-4132 |
| Bachelor's degree or higher (25+), now | 35.7% | 31.8% | 14.0% (plus or minus 2.2) | 2020 to 2024 | ACS 5-year DP0223 |
| Median household income, then (2025 dollars) | $74,681 | $67,781 | not checked | 1979 | Census S1, CPI-U (our calculation)810 |
| Median household income, now | $80,734 | $77,800 | $71,724 (plus or minus $3,145) | 2020 to 2024 (2024 dollars) | ACS 5-year DP0335 |
| Poverty rate, then | 12.4% | 12.6% | 12.9% | 1979 | 1980 Census poverty by county37 |
| Poverty rate, now | 12.5% | 10.6% | 12.6% (plus or minus 2.7) | 2020 to 2024 | ACS 5-year DP0335 |
| Renters paying 30%+ of income | 51.1% | 46.9% | 34.8% | 2020 to 2024 | ACS 5-year B25070 (our calculation)41 |
| Owners paying 30%+ of income | 22.7% | 20.8% | 22.1% | 2020 to 2024 | ACS 5-year B25091 (our calculation)41 |
The county cards below put the six Magic Valley counties side by side on four measures, then and now. Lesson 4 adds the town-level numbers.

Common mistakes
- Comparing an ACS estimate with a census count or a population estimate and calling the difference a change. Jerome County is "39.2 percent Hispanic" in the ACS 2020 to 2024 5-year data and "42.3 percent" in the Vintage 2025 estimates. Writing that the share "rose three points" compares two different instruments covering different dates. This module's own planning notes listed the 39.2 percent figure; it is correct for what it is.287
- Comparing ACS 1-year with ACS 5-year numbers. Twin Falls County's poverty rate is 7.7 percent in the 2025 1-year estimate and 11.5 percent in the 2020 to 2024 5-year estimate. The 1-year figure is one year's sample with a margin of plus or minus 2.0 points; the 5-year figure averages five years. Neither proves poverty fell. The Census Bureau's guidance is blunt: "Only compare 1-year estimates with 1-year estimates, and 5-year estimates with 5-year estimates," and do not compare overlapping 5-year periods.363542
- Comparing nominal dollars across decades. Idaho's median household income went from $15,285 (1979) to $84,234 (2025). That is a 451 percent increase in nominal dollars and a 24 percent increase in real dollars. Only the second number says anything about living standards.8910
- Mixing ACS per capita income with BEA per capita personal income. The ACS put Idaho's per capita income at $41,816 in 2025; BEA's per capita personal income for Idaho is a different and larger measure. Both are legitimate. A table that puts one beside the other for different places is wrong. Lesson 9 uses BEA.
- Reading race trends across 2000 and 2020 without the definition changes. Multiple-race reporting began in 2000; the 2020 Census changed question design and coding enough that the national "two or more races" count went from about 9 million to 33.8 million. A rise in Idaho's multiracial share is partly a measurement change.29
- Treating "Hispanic" as "foreign-born" or "immigrant." Idaho had 296,546 Hispanic residents and 122,134 foreign-born residents of all origins in the ACS 2025 estimates. Most Hispanic Idahoans were born in the United States.313
- Using percentages without counts for small counties. Lincoln County's Hispanic share "fell" from 6.9 percent in 1980 to 5.8 percent in 1990, a change of a few dozen people in a county of about 3,400, comparing a census count with an estimate. Always give the count beside the share when the base is small.
- Calling a cost-burden share "the number of struggling families." Cost burden counts households paying 30 percent or more, regardless of income. A high-income household that chose an expensive home counts the same as a low-income renter. HUD's CHAS data, which cross cost burden with income, are the right source for "lower-income households with severe burdens."
What we know, what we don't, and what the data can show
What we know
- Idaho's median age rose from 27.5 (1980 Census) to 37.9 (ACS 2025), and its 65-plus share from 9.9 percent to 18.7 percent (Vintage 2025). People 65 and over were 36.5 percent of Idaho's growth from 2020 to 2025.
- Idaho's Hispanic population grew from 36,615 (3.9 percent) in 1980 to an estimated 299,881 (14.8 percent) in 2025, and accounted for 31.7 percent of growth from 2020 to 2025.
- Jerome, Minidoka, Gooding, Lincoln and Cassia counties are each roughly one-third or more Hispanic in the 2025 estimates; in 1980 none was above 15.2 percent.
- Idaho's real median household income rose from 90.8 percent of the U.S. figure (1979) to 99.4 percent (2025); per capita income still trails the nation by about 11 percent.
- Idaho renters and owners are less cost-burdened than the national average, but 49,071 Idaho renter households paid half or more of their income for housing in 2025.
What we don't know
- How much of Idaho's aging is people aging in place and how much is older people moving in. The census does not follow people; IRS and ACS migration data (lesson 6) give partial answers.
- Reliable year-to-year demographics for the small towns of Jerome, Kimberly, Gooding, Buhl and Hagerman. ACS 5-year estimates for places under 10,000 people carry margins too wide for most trend claims.
- How the 2025 lapse in federal appropriations affected 2025 data collection beyond the missing October CPI. The Census Bureau's ACS documentation for 2025 lists table changes but did not, in what we read, describe collection gaps; watch the 2021 to 2025 5-year release notes.
- How the revised federal race and ethnicity standard (one combined question, a new Middle Eastern or North African category) will change Idaho's published shares after 2029.
- The 1980 foreign-born, education and income figures for Jerome County and the other Magic Valley counties; they are in the scanned 1980 Census county tables (PC80-1-C14) and were not checked for this lesson.
What the data can show
- Whether a county's school-age population is growing or shrinking, year by year: Census Vintage population estimates by age (CC-EST2025-AGESEX), checked against Idaho State Department of Education enrollment files (lesson 10).
- Which counties are aging fastest and how many residents will be 75 and over in five years: CC-EST2025-ALLDATA single age groups, aged forward as a rough check.
- Whether housing cost burden is rising faster for renters than owners, and in which counties: ACS tables B25070 and B25091, 5-year for small counties, compared across non-overlapping periods (2015 to 2019 against 2020 to 2024), as the Census Bureau advises.42
- Whether incomes are converging across Idaho counties: ACS DP03 median household income in the same dollar year, or BEA CAINC1 per capita personal income, deflated with CPI-U.
- Where language access needs are greatest: ACS table C16001 (language spoken at home by ability to speak English) for school districts and counties.
Questions people ask
Is Idaho an old state or a young state now?
Both, depending on where you look. With a median age of 37.9 in the ACS 2025 estimates, Idaho is younger than the U.S. (39.5) and most of its neighbors, older than Utah (32.6), and much older than it was in 1980 (27.5). Inside Idaho, Madison County's median age is 22.5 and Boise County's (a rural county, not the city) 54.3 (Vintage 2025).322
How many Hispanic Idahoans are there?
About 300,000: the Vintage 2025 estimate for July 1, 2025 is 299,881, or 14.8 percent of Idahoans. The ACS 2025 1-year estimate is 296,546, or 14.6 percent.43 Canyon County has the most (74,281), followed by Ada (59,426) and Twin Falls (19,160).7
Are Idahoans richer than they were?
Yes, in real terms. Median household income in 2025 dollars rose from $67,781 in 1979 to $84,234 in 2025 (our calculation using the CPI-U). Whether a particular family is better off also depends on housing costs, which rose faster than incomes after 2020 (lesson 9).8910
Why does household size matter for housing?
Because each household needs a housing unit. If Idaho's 2025 household population lived in households the size of 1980's (2.85 people instead of 2.59), Idaho would need about 70,000 fewer homes (our arithmetic). Smaller households, from aging, fewer children and more people living alone, drive housing demand even without population growth.131
Where can I get these numbers for my town?
For towns and cities, use the ACS 5-year data profiles (DP02, DP03, DP04, DP05) on data.census.gov, with the margins of error. For annual population and age for counties, use the Census Bureau's county population estimates by characteristics; the Bureau does not publish age or Hispanic origin estimates for cities. Lesson 13 walks through each step.
Are most Idahoans born in Idaho?
No longer. About 44.5 percent were born in Idaho in the ACS 2025 estimates, down from 50.3 percent in 1980; 48.5 percent were born in another state and 6.0 percent abroad (some of the remainder were born in U.S. territories or abroad to American parents).1312
Hard questions
Should Idaho plan for retirees or for young families?
The case for planning around older residents: they are the fastest-growing group (up 22.5 percent from 2020 to 2025), they bring Social Security, pensions and savings into local economies, they use less school capacity, and they need smaller, accessible homes, health care and transit. The case for planning around families: Idaho still has more children per person than the nation, Jerome and Cassia counties are nearly 30 percent under 18, and the workers who staff hospitals, farms and plants need homes they can afford near work. What the evidence shows: both groups are growing in absolute numbers, but in different places. County-level age estimates show where each is concentrated, and a county plan that uses the statewide average will fit neither Ada County nor Jerome County.422
Who should pay for language access?
One view: counties, courts and schools serving places where a third of residents speak Spanish at home should plan and budget for bilingual staff as a basic cost of serving the public. Another view: most bilingual residents speak English well (in Idaho, 3.0 percent of people 5 and over speak English less than "very well"), and services should target that smaller group rather than whole populations. What the evidence shows: the need is local. Statewide numbers understate it in Jerome, Gooding, Lincoln and Minidoka counties, and the right measure is "speaks English less than very well," not "speaks another language at home."1323
Did growth make Idaho richer, or did richer people move in?
One view: new jobs in technology, health care and construction raised wages for people already here. Another view: the median rose because higher-income households moved in, while long-time residents' incomes stagnated and their housing costs rose. What the evidence shows: the census and ACS show the outcome (Idaho's real median at 99.4 percent of the nation's in 2025), not the cause. IRS migration data (lesson 6) can show whether arriving households had higher incomes than departing ones, and wage data (lesson 7) can show whether local wages rose. Answering the question needs both.
Are Hispanic and immigrant residents undercounted?
One view: census counts and surveys miss some residents in farm-worker housing, mobile home parks and mixed-status households, which can understate the population of the dairy counties and the services they need. Another view: the population estimates use administrative records and the 2020 Census base, and any error is small at the county level. What the evidence shows: the Census Bureau's 2020 Post-Enumeration Survey found statistically significant net coverage errors in 14 states (undercounts in six, including Texas and Florida; overcounts in eight, including Utah); Idaho was not among them. The Bureau did not publish county or city coverage estimates, citing sample size, so no published number says how well Jerome or Canyon County was counted.43 Local claims of an undercount can be tested against school enrollment and other administrative counts.
For reporters and advocates
Most of this lesson's numbers can be checked and updated by anyone, free.
- County age, sex, race and Hispanic origin, every year. The Census Bureau's county characteristics files (CC-EST2025-ALLDATA-16 for Idaho) give every county's population by five-year age group and origin from 2020 through July 1, 2025. The next vintage usually appears each June.7
- ACS data profiles. On data.census.gov, search "DP05 Jerome County, Idaho" (or any county or city) and choose the 5-year product for places under 65,000 people. Report the margin of error with every small-area figure.14
- 1980 baselines. The 1980 Census volumes for Idaho (PC80-1-B14 and C14) are scanned on census.gov. Table 14 (B14) and Tables 56 and 57 (C14) give county summaries; they are images, so numbers must be read and typed by hand. Double-check each one.612
- School districts. Enrollment, English learner counts and free-lunch eligibility are public at the Idaho State Department of Education and are a useful cross-check on census estimates for children (lesson 10). Districts that receive state money for English learners report counts that can be requested under the Idaho Public Records Act (Idaho Code Title 74, chapter 1); see Idaho Public Records Requests.
- Questions for officials. Ask a county or city: Which population source does your adopted long-range land use plan use, and which year? Does it use age projections, and from whom? How many residents need language assistance for county services, and what does the county spend on interpreters? What share of new housing is sized for older residents or for large families? See Idaho Planning and Zoning and Local Government for how plans are adopted.
- The Magic Valley angle. Jerome County's shift from 3.8 to 42.3 percent Hispanic in 45 years, its households averaging more than three people, and its low share of college graduates are the core of the region's demographic story. The pair to report together: the people who moved in to work, and whether housing, schools and language services kept pace. Lessons 4, 7 and 10 give the jobs, town and school data.
Where to go next
- data.census.gov: The Census Bureau's free data site. Search a table ID (DP05, DP02, DP03, B25070) and a place name; use 5-year data for places under 65,000 people and always download the margins of error. For residents, reporters, planners and officials; free.
- Census Bureau County Population by Characteristics: 2020 to 2025: Free annual county estimates by age, sex, race and Hispanic origin, updated each June. Download the Idaho file and filter by county; the file layout PDF explains the YEAR and AGEGRP codes.
- Census Bureau: Comparing ACS Data: Free guidance on which ACS years and products can be compared and how to test whether a difference is statistically significant. Read before writing any trend story.
- Idaho Department of Labor, Labor Market Information: Free state agency site with county profiles and population summaries for Idaho; useful for local context and contacts. Cross-check its population figures against the Census Bureau vintage it cites.
- BLS CPI Inflation Calculator: Free BLS tool that converts dollars between years with the CPI-U. It uses monthly values; for annual comparisons like this lesson's, use annual averages from series CUUR0000SA0.
- Data and Statistics training course (this site): Free nine-lesson course on finding data, spreadsheets, uncertainty, honest charts and checking numbers, written for reporters and residents.
Still being checked (5 items)
These points could not be fully confirmed against a primary source when this lesson was written and fact checked in November 2026. The text above states each one as uncertain.
- 1980 county figures (Spanish origin percent, median age, persons per household) and the 1980 state social and economic summary figures were read by eye from scanned page images of the 1980 Census Idaho volumes (PC80-1-B14 Table 14; PC80-1-C14 Tables 56 and 57). State figures were cross-checked against Working Papers 56 and 81, CENSR-4 and the historical income table and match; county figures have no second source and should be re-read by the checker.
- The 1999 CPI-U annual average (166.6) was computed from the 12 monthly values on FRED (average 166.575) because the BLS API daily limit was reached; it matches the published BLS annual average as we understand it but was not read from a BLS annual table.
- 1980 foreign-born, education and income figures for Jerome County and the other Magic Valley counties were not checked (they are in scanned PC80-1-C14 county tables).
- Whether the 2025 lapse in federal appropriations affected ACS 2025 data collection in Idaho is not documented in the Census Bureau pages we read.
- Lincoln County's 1980 to 1990 Hispanic share change (6.9 to 5.8 percent) compares a census count with an estimate for a small county and may be an artifact.
Last verified November 17, 2026. General education, not legal, financial or real estate advice; every figure names its source and year in the Notes and Sources below. Data is revised: check the newest release before relying on any number.
Notes
- U.S. Census Bureau, 1980 Census of Population, Vol. 1, Characteristics of the Population, Chapter B, General Population Characteristics, Part 14, Idaho (PC80-1-B14, issued May 1982), Table 14, Summary of General Characteristics: 1980, The State (page 14-7): total 943,935; Spanish origin 3.9%; under 18 32.5%; 65 and over 9.9%; median age 27.5; 324,107 households; 2.85 persons per household. Scanned volume, figures read from the page image (read Nov. 17, 2026). Read it online. ↩
- U.S. Census Bureau, Frank Hobbs and Nicole Stoops, Demographic Trends in the 20th Century (CENSR-4, November 2002), Figure 2-5, Median Age: 1900 to 2000 (U.S.: 30.0 in 1980, 32.9 in 1990, 35.3 in 2000) (read Nov. 17, 2026). Read it online. ↩
- U.S. Census Bureau, American Community Survey 2025 1-year estimates (released Oct. 29, 2026), Table DP05, Demographic and Housing Estimates, United States, Idaho, Utah, Montana, Washington, Oregon, Nevada and Wyoming (read Nov. 17, 2026). Read it online. ↩
- U.S. Census Bureau, Vintage 2025 Population Estimates, Annual State Resident Population Estimates for 6 Race Groups by Age, Sex and Hispanic Origin: April 1, 2020 to July 1, 2025 (file SC-EST2025-ALLDATA6, released June 2026). Age-group, Hispanic and U.S. totals are our sums of the published single-year counts (U.S. = 50 states and D.C.) (read Nov. 17, 2026). Read it online. ↩
- Campbell Gibson and Kay Jung, U.S. Census Bureau, Historical Census Statistics on Population Totals by Race, 1790 to 1990, and by Hispanic Origin, 1970 to 1990, for the United States, Regions, Divisions, and States, Working Paper No. 56 (September 2002), Table 27 (Idaho) and summary tables: Idaho Hispanic origin 36,615 (3.9%) in 1980 and 52,927 in 1990; U.S. 14,608,673 (6.4%) in 1980 and 22,354,059 (9.0%) in 1990; Idaho 1980 American Indian, Eskimo and Aleut 10,521, Asian and Pacific Islander 5,948, Black 2,716 (read Nov. 17, 2026). Read it online. ↩
- U.S. Census Bureau, 1980 Census of Population, PC80-1-B14 (Idaho), Table 14, Summary of General Characteristics: 1980, continued, Counties (page 14-8): percent Spanish origin, under 18, 65 and over, median age and persons per household for each county. Figures read from the scanned page image (read Nov. 17, 2026). Read it online. ↩
- U.S. Census Bureau, Vintage 2025 Population Estimates, Annual County Resident Population Estimates by Age, Sex, Race and Hispanic Origin: April 1, 2020 to July 1, 2025, Idaho (file CC-EST2025-ALLDATA-16, released June 2026), YEAR 1 (April 1, 2020 base) and YEAR 7 (July 1, 2025), AGEGRP 0. Hispanic shares are our calculation (H_MALE plus H_FEMALE divided by TOT_POP) (read Nov. 17, 2026). Read it online. ↩
- U.S. Census Bureau, decennial census historical income tables: Table S1, Median Household Income by State: 1969, 1979, 1989 and 1999 (Idaho $15,285 in 1979 and $37,572 in 1999; U.S. $16,841 and $41,994), and Table S3, Per Capita Income by State (Idaho $6,248 in 1979 and $17,841 in 1999; U.S. $7,298 and $21,587), current dollars (read Nov. 17, 2026). Read it online. ↩
- U.S. Census Bureau, ACS 2025 1-year estimates, Table DP03, Selected Economic Characteristics (income in 2025 inflation-adjusted dollars), United States, Idaho and neighbor states (read Nov. 17, 2026). Read it online. ↩
- U.S. Bureau of Labor Statistics, Consumer Price Index for All Urban Consumers (CPI-U), U.S. city average, all items, not seasonally adjusted, series CUUR0000SA0, annual averages (1979 = 72.6; 2024 = 313.689; 2025 = 321.943; October 2025 flagged "Data unavailable due to the 2025 lapse in appropriations"), read through the BLS Public Data API (read Nov. 17, 2026). Read it online. ↩
- U.S. Census Bureau, ACS 2025 1-year estimates, Tables B25070 (Gross Rent as a Percentage of Household Income in the Past 12 Months) and B25091 (Mortgage Status by Selected Monthly Owner Costs as a Percentage of Household Income), U.S., Idaho and neighbor states. Shares are our calculation, excluding "not computed" households (read Nov. 17, 2026). Read it online. ↩
- U.S. Census Bureau, 1980 Census of Population, Chapter C, General Social and Economic Characteristics, Idaho (PC80-1-C14), Table 56, Summary of Social Characteristics: 1980, The State: foreign born 2.5%; native persons born in state of residence 50.3%; persons 5 and over who speak a language other than English at home 5.6%; persons 25 and over, high school graduates 73.7%, completed 4 or more years of college 15.8%. Sample data; read from the scanned page image (read Nov. 17, 2026). Read it online. ↩
- U.S. Census Bureau, ACS 2025 1-year estimates, Table DP02, Selected Social Characteristics, United States, Idaho and neighbor states (households, household size, education, veterans, disability, place of birth, nativity, citizenship, language) (read Nov. 17, 2026). Read it online. ↩
- U.S. Census Bureau, ACS User Note 2026-06, Updates to 2025 ACS 1-Year Data Release Rules (the 65,000 population threshold for 1-year data and 20,000 for supplemental estimates remain) (read Nov. 17, 2026). Read it online. ↩
- U.S. Census Bureau, Demographic Trends in the 20th Century (CENSR-4, 2002), appendix tables for the United States and states: percent under 15 and 65 and over (Idaho 1980 27.1% and 9.9%; U.S. 22.6% and 11.3%), Hispanic origin 1980 to 2000 (Idaho 36,615, 52,927 and 101,690; non-Hispanic 907,320 in 1980; non-Hispanic white 886,187 in 1980; U.S. 2000 share 12.5%), Table 14 percent one-person households (Idaho 19.9% in 1980, 22.4% in 1990 and 2000; U.S. 22.7%, 24.6%, 25.8%) (read Nov. 17, 2026). Read it online. ↩
- U.S. Census Bureau, Demographic Trends in the 20th Century (CENSR-4, 2002), Figure 5-3, Average Household Size: 1900 and 1930 to 2000 (U.S. 2.75 in 1980, 2.63 in 1990, 2.59 in 2000) (read Nov. 17, 2026). Read it online. ↩
- U.S. Census Bureau, Census 2000 Summary File 1, Tables P013 (Median Age by Sex: U.S. 35.3, Idaho 33.2) and P017 (Average Household Size: U.S. 2.59, Idaho 2.69) (read Nov. 17, 2026). Read it online. ↩
- U.S. Census Bureau, 2010 Census Summary File 1, Tables P13 (Median Age by Sex: U.S. 37.2, Idaho 34.6) and P17 (Average Household Size: U.S. 2.58, Idaho 2.66) (read Nov. 17, 2026). Read it online. ↩
- U.S. Census Bureau, 2020 Census Demographic and Housing Characteristics File (DHC), Table P13, Median Age by Sex (U.S. 38.8, Idaho 36.8) (read Nov. 17, 2026). Read it online. ↩
- U.S. Census Bureau, Intercensal Estimates of the Population of Counties by Age, Sex and Race: 1980 to 1989 (file pe-02, revised May 12, 2009), July 1, 1980 rows for Idaho counties (FIPS 16001 to 16087) and all U.S. counties, summed by us (Idaho 948,582; U.S. 227,225,826) (read Nov. 17, 2026). Read it online. ↩
- U.S. Census Bureau, Notes on ACS Estimate and Annotation Values (code -555555555: "A margin of error is not appropriate because the corresponding estimate is controlled to an independent population or housing estimate"; code -888888888: not applicable or not available) (read Nov. 17, 2026). Read it online. ↩
- U.S. Census Bureau, Vintage 2025 County Population Estimates by Age and Sex, Idaho (file CC-EST2025-AGESEX-16, released June 2026), YEAR 7 (July 1, 2025): MEDIAN_AGE_TOT, age-group totals. Under-18 and 65-plus shares are our calculation (read Nov. 17, 2026). Read it online. ↩
- U.S. Census Bureau, ACS 2020 to 2024 5-year estimates, Table DP02, Selected Social Characteristics, United States, Idaho, and Ada, Canyon, Twin Falls, Jerome, Minidoka, Gooding, Cassia and Lincoln counties, with margins of error (read Nov. 17, 2026). Read it online. ↩
- Office of Management and Budget, Revisions to OMB's Statistical Policy Directive No. 15: Standards for Maintaining, Collecting, and Presenting Federal Data on Race and Ethnicity, 89 Fed. Reg. (March 29, 2024), FR Doc. 2024-06469 (effective March 28, 2024; compliance by March 28, 2029) (read Nov. 17, 2026). Read it online. ↩
- U.S. Census Bureau, 2010 Census Summary File 1, Table P4, Hispanic or Latino Origin (U.S. 50,477,594 of 308,745,538; Idaho 175,901 of 1,567,582) (read Nov. 17, 2026). Read it online. ↩
- U.S. Census Bureau, Population Estimates for Counties: Race by Hispanic Origin Annual Time Series, July 1, 1990 to July 1, 1999 (file CO-99-10, released Aug. 30, 2000), 1990 rows for Idaho counties; shares are our calculation (read Nov. 17, 2026). Read it online. ↩
- U.S. Census Bureau, Intercensal Estimates of the Resident Population by Age, Sex, Race and Hispanic Origin for Counties: April 1, 2000 to July 1, 2010, Idaho (file CO-EST00INT-ALLDATA-16), YEAR 1 (April 1, 2000 estimates base) and YEAR 12 (April 1, 2010 Census), AGEGRP 99 (total); shares are our calculation (read Nov. 17, 2026). Read it online. ↩
- U.S. Census Bureau, ACS 2020 to 2024 5-year estimates, Table DP05, Demographic and Housing Estimates, Jerome County, Idaho (Hispanic or Latino of any race 39.2%; median age 34.0, plus or minus 0.4) and comparison areas (read Nov. 17, 2026). Read it online. ↩
- U.S. Census Bureau, "2020 Census Illuminates Racial and Ethnic Composition of the Country" (America Counts story, Aug. 12, 2021): Multiracial population about 9 million in 2010 and 33.8 million in 2020 (read Nov. 17, 2026). Read it online. ↩
- Idaho Supreme Court, Idaho Tribal-State Court Forum, Tribal Government page (Coeur d'Alene Tribe, Kootenai Tribe of Idaho, Nez Perce Tribe, Shoshone-Bannock Tribes, Shoshone-Paiute Tribes) (read Nov. 17, 2026). Read it online. ↩
- Campbell Gibson and Kay Jung, U.S. Census Bureau, Historical Census Statistics on the Foreign-Born Population of the United States: 1850 to 2000, Working Paper No. 81 (2006), Table 14, Nativity of the Population for Regions, Divisions, and States (Idaho foreign born 12,572 in 1970, 23,404 in 1980, 28,905 in 1990, 64,080 in 2000) (read Nov. 17, 2026). Read it online. ↩
- U.S. Census Bureau, A Half-Century of Learning: Historical Statistics on Educational Attainment in the United States, 1940 to 2000 (PHC-T-41), Table 5a (high school diploma or higher) and Table 6a (bachelor's degree or higher), population 25 and over, U.S. and Idaho (read Nov. 17, 2026). Read it online. ↩
- Federal Reserve Bank of St. Louis, FRED, series CPIAUCNS (BLS CPI-U, U.S. city average, all items, not seasonally adjusted), monthly values for 1999 (164.3 to 168.3), which average 166.575, published by BLS as 166.6 (read Nov. 17, 2026). Read it online. ↩
- U.S. Census Bureau, 1980 Census of Population, PC80-1-C14 (Idaho), Table 57, Summary of Economic Characteristics: 1980, The State: median household income in 1979 $15,285; per capita income $6,248; 12.6% of persons below poverty level. Read from the scanned page image (read Nov. 17, 2026). Read it online. ↩
- U.S. Census Bureau, ACS 2020 to 2024 5-year estimates, Table DP03, Selected Economic Characteristics (income in 2024 inflation-adjusted dollars), United States, Idaho and eight Idaho counties, with margins of error (read Nov. 17, 2026). Read it online. ↩
- U.S. Census Bureau, ACS 2025 1-year estimates, Table DP03, Ada, Canyon and Twin Falls counties, Idaho (median household income and poverty rate with margins of error) (read Nov. 17, 2026). Read it online. ↩
- U.S. Census Bureau, 1980 Census, Population by Poverty Status in 1979, by county (file 1980-Census-by-County.xls): U.S. 12.4%, Idaho 12.61%, and each Idaho county (read Nov. 17, 2026). Read it online. ↩
- U.S. Census Bureau, Census 2000, Population by Poverty Status in 1999, by county (file 2000-Census-by-County.xls): U.S. 12.38%, Idaho 11.77%, and each Idaho county (read Nov. 17, 2026). Read it online. ↩
- U.S. Census Bureau, ACS 2010 1-year estimates, Tables B25070 and B25091, United States and Idaho; shares are our calculation (read Nov. 17, 2026). Read it online. ↩
- U.S. Census Bureau, ACS 2019 1-year estimates, Tables B25070 and B25091, United States and Idaho; shares are our calculation (read Nov. 17, 2026). Read it online. ↩
- U.S. Census Bureau, ACS 2020 to 2024 5-year estimates, Tables B25070 and B25091, United States, Idaho and Ada, Canyon, Twin Falls, Jerome, Minidoka and Gooding counties; shares are our calculation (read Nov. 17, 2026). Read it online. ↩
- U.S. Census Bureau, American Community Survey, Comparing ACS Data ("Only compare 1-year estimates with 1-year estimates, and 5-year estimates with 5-year estimates"; do not compare overlapping 5-year periods) (read Nov. 17, 2026). Read it online. ↩
- U.S. Census Bureau, press release, "Census Bureau Releases Estimates of Undercount and Overcount in the 2020 Census" (May 19, 2022): 14 states with statistically significant net coverage errors; no county or place estimates (read Nov. 17, 2026). Read it online. ↩
Check yourself
1. What was Idaho's median age in the 1980 Census, and what is the ACS 2025 estimate?
The 1980 Census Idaho summary (PC80-1-B14, Table 14) gives 27.5; ACS 2025 1-year table DP05 gives 37.9. The U.S. figures were 30.0 and 39.5.
2. From the April 2020 estimates base to July 1, 2025, what share of Idaho's population growth was people 65 and over?
Vintage 2025 state estimates (SC-EST2025-ALLDATA6): the 65-plus group grew by 69,556 of total growth of 190,610, or 36.5 percent. Children under 18 were 5.2 percent and ages 18 to 64 were 58.3 percent.
3. How many Hispanic residents did the 1980 Census count in Idaho?
Census Working Paper 56 gives 36,615 (3.9 percent) for 1980. 52,927 is 1990, 101,690 is 2000, and 299,881 is the July 1, 2025 estimate.
4. Which Idaho county had the highest Hispanic share in the Vintage 2025 estimates?
CC-EST2025-ALLDATA-16: Jerome County 42.3 percent (11,148 of 26,362), ahead of Minidoka 38.3 percent. Canyon County has the largest number of Hispanic residents (74,281) but a 27.0 percent share.
5. Jerome County is 39.2 percent Hispanic in one Census Bureau source and 42.3 percent in another. Why?
ACS 5-year DP05 (2020 to 2024) gives 39.2 percent; the Vintage 2025 county estimate for July 1, 2025 gives 42.3 percent. Different instruments and dates; say which you use.
6. Idaho's 1979 median household income was $15,285. Using CPI-U annual averages of 72.6 (1979) and 321.943 (2025), what is that in 2025 dollars?
15,285 x (321.943 / 72.6) = $67,781 (our calculation from the census historical income table S1 and BLS CPI-U series CUUR0000SA0). $74,681 is the U.S. figure converted the same way.
7. In the ACS 2025 estimates, what share of Idaho renter households paid 30 percent or more of income for gross rent?
Our calculation from ACS 2025 table B25070: 101,068 of 207,078 computed renter households, 48.8 percent. 23.7 percent paid 50 percent or more; the U.S. rate was 51.8 percent.
8. Which comparison does the Census Bureau advise against?
The Census Bureau's Comparing ACS Data guidance says to compare 1-year with 1-year and 5-year with 5-year, and not to compare overlapping 5-year periods.
9. What share of Idahoans were born in Idaho in the 1980 Census and in the ACS 2025 estimates?
1980 Census PC80-1-C14 Table 56: 50.3 percent born in state of residence; ACS 2025 DP02: 44.5 percent. Nationally 56.4 percent live in their birth state.
10. Why did the national count of people reporting two or more races jump from about 9 million in 2010 to 33.8 million in 2020?
The Census Bureau's August 2021 story on 2020 race and ethnicity results said the changes were expected to be largely due to improvements to the design of the two questions and to processing and coding.
Terms in this lesson
- Median age
- The age that divides a population into two equal groups, half younger and half older.
- Population pyramid
- A chart of a population by age group and sex, youngest at the bottom, males on one side and females on the other.
- Vintage
- A year's set of Census Bureau population estimates, named for the last year it covers (Vintage 2025 runs from April 1, 2020 to July 1, 2025). Each vintage revises earlier years.
- Estimates base
- The April 1, 2020 starting population the Census Bureau builds its estimates on; close to, but not always identical to, the census count.
- Household
- All the people who live in one occupied housing unit, related or not. The number of households equals the number of occupied housing units.
- Group quarters
- Places such as dormitories, nursing homes, prisons and barracks where people live outside households.
- Hispanic or Latino origin
- A separate federal question from race; Hispanic people may be of any race. The 1980 Census called it Spanish origin.
- Alone or in combination
- A count of everyone who reported a race, either by itself or with other races; the groups overlap and can add to more than 100 percent.
- Foreign-born
- Anyone who was not a U.S. citizen at birth, including naturalized citizens; the census and ACS do not ask legal status.
- Per capita income
- Total income divided by all residents, including children; lower where households are larger.
- Cost-burdened household
- A household paying 30 percent or more of its income for housing; severely cost-burdened at 50 percent or more.
- Controlled estimate
- An ACS estimate forced to match the Census Bureau's population estimates, marked with code -555555555 and treated as having no sampling error.
- Official poverty rate
- The share of people whose family income before taxes is below a national threshold that depends on family size; it does not adjust for local housing costs.
Sources
- 1980 Census of Population, Idaho (PC80-1-A14, B14, C14, D14), scanned volume (1982-05-01) checked 2026-11
- Vintage 2025 State Population Estimates by Age, Sex, Race and Hispanic Origin (SC-EST2025-ALLDATA6) (2026-06-25) checked 2026-11
- Vintage 2025 County Population Estimates by Characteristics, Idaho (CC-EST2025-ALLDATA-16, AGESEX-16) (2026-06-25) checked 2026-11
- American Community Survey 2025 1-year estimates, DP02, DP03, DP04, DP05, B25070, B25091 (2026-10-29) checked 2026-11
- American Community Survey 2020 to 2024 5-year estimates, county data profiles (2026-11-17) checked 2026-11
- Gibson and Jung, Working Paper 56: Historical Census Statistics on Population Totals by Race and Hispanic Origin (2002-09-13) checked 2026-11
- Gibson and Jung, Working Paper 81: Historical Census Statistics on the Foreign-Born Population, 1850 to 2000 (2026-11-17) checked 2026-11
- Hobbs and Stoops, Demographic Trends in the 20th Century (CENSR-4) (2002-11-01) checked 2026-11
- Historical Income Tables: Median Household and Per Capita Income by State, decennial census (2026-11-17) checked 2026-11
- Census Poverty Tables by County, 1960 to 2000 (2026-11-17) checked 2026-11
- A Half-Century of Learning: Educational Attainment 1940 to 2000 (PHC-T-41) (2026-11-17) checked 2026-11
- BLS CPI-U, U.S. city average, all items (CUUR0000SA0) (2026-11-17) checked 2026-11
- OMB, Revisions to Statistical Policy Directive No. 15 (89 FR, March 29, 2024) (2024-03-29) checked 2026-11