Lesson 11 of 13 · about 55 minutes · Updated November 17, 2026
Idaho vs. the United States, 1979 to 2026
You'll be able to
- Compare Idaho's population growth with the nation's by census decade and since 2020, and explain why the ranking depends on the period.
- Separate Idaho's growth into natural increase, international migration and domestic migration, and contrast it with Utah's and the nation's.
- Measure housing growth three ways (housing units, permits per 1,000 residents and construction employment) and rank Idaho against other states.
- Convert home prices, rents and incomes to 2025 dollars with CPI-U and compute price-to-income and rent-to-income ratios for Idaho, the U.S. and the neighbors.
- Read homeownership, cost-burden and property tax figures with their margins of error and source differences in mind.
- Build and interpret a scorecard that marks a state above, below or in line with the national value.
Start here: the short version
- Idaho grew faster than the nation in four of the last five census decades. It ranked 7th of 50 states in the 1970s, 23rd in the 1980s farm and timber slump, then 5th, 4th and 2nd. From April 2020 to July 2025 it ranked 1st, up 10.4 percent against 3.1 percent for the U.S.12
- Idaho led every state in new housing per person. Its 113,061 units authorized by building permits from 2020 to 2025 equal 61.5 per 1,000 residents of 2020, the highest of any state; the U.S. figure was 28.1. Its housing stock grew 2.1 percent from July 2024 to July 2025, also first in the nation.34
- Most of the new people came from other states. Net domestic migration added 130,972 Idahoans from July 2020 to July 2025, about 73 percent of all growth; births minus deaths added 26,681 and international migration 24,088.2
- Home prices outran inflation far more in Idaho. After adjusting with the Consumer Price Index, the FHFA house price index rose 115 percent in Idaho from 2000 to 2025 and 59 percent for the U.S.56
- Incomes did not keep pace with prices. In 2025 Idaho's median home value was 5.43 times its median household income (ACS 1-year), up from 3.80 in 2010; the U.S. ratio was 4.38. Idaho's per capita personal income was 83.3 percent of the national figure in 2025, below the 86.7 percent of 1979.789
- Idaho still beats the nation on some household measures. Its homeownership rate (71.1 percent, ACS 2025) is higher, a smaller share of renters and owners pay 30 percent or more of income for housing, and state and local property taxes took 1.9 percent of personal income in fiscal 2023 against 2.9 percent nationally.101112
Data: U.S. Census Bureau 2020 Census apportionment file (population 1910 to 2020); Census Vintage 2025 state and county population estimates and components of change; Census Vintage 2025 housing unit estimates (released May 2026); Census Building Permits Survey annual state files, 1980 to 2025; American Community Survey (ACS) 1-year estimates for 2010, 2019 and 2025 and ACS 2020 to 2024 5-year estimates; Census Housing Vacancies and Homeownership (HVS) annual state rates through 2025; FHFA House Price Index, all-transactions, through 2026 Q2; BEA per capita personal income by state (as updated Sept. 30, 2026); BLS Current Employment Statistics annual averages, 2025; USDA 2022 Census of Agriculture; BLS CPI-U 2025 annual average (321.943). Checked Nov. 17, 2026. Agencies revise data; newer releases may differ.
Idaho residents hear two stories about growth. One says Idaho is the fastest-growing state in the country and the nation is moving here. The other says Idaho is ordinary, that every state in the Mountain West boomed after 2020, and that the cooling since 2022 shows the surge is over. Both stories have some truth in them, and both leave things out. This lesson puts Idaho beside the United States, and beside its six neighbors (Utah, Montana, Washington, Oregon, Nevada and Wyoming), on every major growth trend we can measure from 1979 to 2026, and ends with a scorecard that marks Idaho above, below or in line with the nation on each one.
It is the summary lesson of this course. Each section gives the national comparison and then points to the lesson that goes deeper on the same subject. How to read estimates, margins of error and inflation-adjusted dollars is in How to Measure Growth Without Fooling Yourself. The year-by-year Idaho story since 1979 is in Idaho Since 1979: The Long View. The cities are in The Big Cities Since 2020, and the six Magic Valley core towns (Jerome, Twin Falls, Kimberly, Gooding, Buhl and Hagerman) are in The Magic Valley Case Study. Farmland is in Farmland to Rooftops, migration in Who Is Moving In and From Where, commuting and jobs in Where People Work, demographics in Who Idahoans Are Now, prices and rents in Prices and Rents vs. Inflation, water, schools and roads in Water, Schools and Roads, economic development in Economic Development and Housing Pressure, and a step-by-step guide to building your own comparison in Build Your Own Growth Profile.
The series this lesson belongs to has five parts. This is Part A, the data course. Part B of this series, coming later, covers zoning, building and property tax; Part C covers owning, renting and homeowners associations; Part D covers affordable housing, housing authorities and ownership programs; and Part E covers building a home, from permits and inspectors to materials and quality.
How this comparison works
A comparison is only as good as its matching. A number for Idaho means little until it sits beside the same number, from the same table, for the same year, for the United States. Every figure in this lesson follows four rules.
- Same source, same year, same definition. Idaho's 2025 median home value is compared with the U.S. 2025 median home value from the same ACS 1-year table (B25077). We never compare an Idaho figure from one survey with a national figure from another.
- Three levels where data exist. The United States, Idaho, and a place inside Idaho. For most state-level measures the place is the Magic Valley, represented by Jerome County and Twin Falls County, because ACS 1-year estimates do not cover areas under 65,000 people and the smaller towns need 5-year estimates.13 Lesson 04 has the town-level numbers.
- Neighbors for context. Utah, Montana, Washington, Oregon, Nevada and Wyoming share Idaho's borders, its job markets and many of its movers. Comparing Idaho only with the national average hides whether Idaho's growth is unusual for the region.
- One deflator. Dollar figures from different years are converted to 2025 dollars with the Bureau of Labor Statistics Consumer Price Index for All Urban Consumers (CPI-U), U.S. city average, all items, annual average (series CUUR0000SA0).6
How we figured it: real dollars
Real dollars are dollars adjusted for inflation so that amounts from different years buy the same basket of goods. The formula used in this whole module is: real (2025 dollars) = nominal x (CPI 2025 / CPI year).
The CPI-U annual averages we use, as published by BLS, are: 1979, 72.6; 1980, 82.4; 1990, 130.7; 2000, 172.2; 2006, 201.6; 2010, 218.056; 2019, 255.657; 2020, 258.811; 2022, 292.655; 2024, 313.689; 2025, 321.943.6 BLS did not publish an October 2025 index because of the lapse in federal appropriations; it says the 2025 annual average for series missing October is the average of the 11 months that were published.14
Worked example: the ACS 2010 1-year estimate of Idaho's median home value was $165,100.15 In 2025 dollars that is $165,100 x (321.943 / 218.056) = $243,758. The 2025 estimate was $457,800, so the real median value rose 87.8 percent in 15 years.7 For 2026, only part-year data exist; this lesson labels them "2026 to date" and does not deflate them.
BEA also publishes "real" personal income that adjusts for differences in price levels between states (regional price parities), measured in chained 2017 dollars; Idaho's real per capita personal income on that basis was $52,816 in 2024.16 That series answers a different question (what income buys in Idaho compared with elsewhere), so we do not mix it with CPI-U figures here.
The scorecard at the end uses a simple rule: a state is "in line" with the nation when its value is within 5 percent of the U.S. value (above or below), "above" when it is more than 5 percent higher, and "below" when it is more than 5 percent lower. Above is a description, not a grade. A higher price-to-income ratio is above the nation and worse for buyers; a higher homeownership rate is above the nation and, for most families, better.


Population: Idaho's growth rank, decade by decade
The decennial census is a count: an attempt to enumerate every resident on April 1 of a year ending in zero. Population figures between censuses are estimates, built from births, deaths, tax-return addresses, Medicare enrollment and immigration data, and revised every year.17 The table below uses counts for 1980 to 2020 and the Vintage 2025 estimate for July 1, 2025. The percent changes for 1980 to 2020 are the Census Bureau's own; the ranks are our sort of those percent changes among the 50 states, with the District of Columbia and Puerto Rico left out.1
| Census year | U.S. population | U.S. growth over prior decade | Idaho population | Idaho growth | Idaho rank (of 50) |
|---|---|---|---|---|---|
| 1980 | 226,545,805 | 11.5% | 943,935 | 32.5% | 7th |
| 1990 | 248,709,873 | 9.8% | 1,006,749 | 6.7% | 23rd |
| 2000 | 281,421,906 | 13.2% | 1,293,953 | 28.5% | 5th |
| 2010 | 308,745,538 | 9.7% | 1,567,582 | 21.1% | 4th |
| 2020 | 331,449,281 | 7.4% | 1,839,106 | 17.3% | 2nd (Utah 1st) |
| 2025 (estimate, July 1) | 341,784,857 | 3.1% since April 2020 base | 2,029,733 | 10.4% since April 2020 base | 1st |
Sources: 1980 to 2020 from the 2020 Census apportionment file;1 2025 from Census Vintage 2025 estimates (NST-EST2025-ALLDATA), measured from the April 1, 2020 estimates base of 1,839,123 for Idaho and 331,516,113 for the U.S.2 The estimates base differs slightly from the census count because of corrections made after the count (the Count Question Resolution program and boundary updates).18
The 1980s exception
The 1980s are the only decade since 1970 in which Idaho grew more slowly than the nation: 6.7 percent against 9.8 percent. Idaho's building permits tell the same story. The state authorized 5,795 new housing units in 1980 and only 2,536 in 1982, the lowest total in the 46 years of state data, and did not pass 1980's level again until 1991.193 Idaho's per capita personal income, 87.0 percent of the U.S. figure in 1980, fell to 82.3 percent by 1990.9 Lesson 02 explains the causes (high interest rates, the farm crisis, and the mining and timber downturns) year by year.
Idaho's share of the nation
In 1980 Idaho held 0.42 percent of the U.S. population (943,935 of 226,545,805). In July 2025 it held 0.59 percent (2,029,733 of 341,784,857), our calculation from the same sources.12 Even after four decades of fast growth, Idaho is a small state: its 2020 population density was 22.3 people per square mile against 93.8 for the nation.1 That small base matters. A state of two million adding 30,000 people a year posts a much higher percentage than California adding the same number, which is why a percentage rank and a numeric rank can tell different stories.
The neighbors by decade
Idaho's growth is part of a regional pattern, but its neighbors have moved in different directions.
| State | 1970 to 1980 | 1980 to 1990 | 1990 to 2000 | 2000 to 2010 | 2010 to 2020 | April 2020 to July 2025 |
|---|---|---|---|---|---|---|
| United States | 11.5% | 9.8% | 13.2% | 9.7% | 7.4% | 3.1% |
| Idaho | 32.5% (7th) | 6.7% (23rd) | 28.5% (5th) | 21.1% (4th) | 17.3% (2nd) | 10.4% (1st) |
| Utah | 37.9% (5th) | 17.9% (9th) | 29.6% (4th) | 23.8% (3rd) | 18.4% (1st) | 8.2% (5th) |
| Nevada | 63.8% (1st) | 50.1% (1st) | 66.3% (1st) | 35.1% (1st) | 15.0% (5th) | 5.7% (10th) |
| Montana | 13.3% | 1.6% | 12.9% | 9.7% | 9.6% | 5.6% (11th) |
| Washington | 21.2% | 17.8% | 21.1% | 14.1% | 14.6% | 3.8% |
| Oregon | 25.9% | 7.9% | 20.4% | 12.0% | 10.6% | 0.9% |
| Wyoming | 41.3% (4th) | minus 3.4% | 8.9% | 14.1% | 2.3% | 2.1% |
Percent changes 1970 to 2020 from the apportionment file; 2020 to 2025 our calculation from Vintage 2025 estimates; ranks are our sort among 50 states and shown only for the top tier.12 Nevada was the fastest-growing state for four straight decades, then slowed sharply after the 2008 housing crash. Utah and Idaho traded the top spots in the 2010s and 2020s. Oregon nearly stopped growing after 2020.
The fastest one-year rate in Vintage 2025 belongs to South Carolina. The Census Bureau's January 27, 2026 release ranked South Carolina first (1.5 percent) and Idaho second (1.4 percent) for July 2024 to July 2025, and attributed Idaho's growth to domestic migration.20 Measured from April 2020, Idaho is first. Both statements are true, and a reader who sees "Idaho is the fastest-growing state" should ask which period is meant.
The Magic Valley against the state
Jerome County grew from an April 2020 base of 24,241 to an estimated 26,362 in July 2025 (up 8.7 percent), and Twin Falls County from 90,050 to 97,539 (up 8.3 percent). Both grew more slowly than Idaho (10.4 percent) and more than twice as fast as the nation (3.1 percent).21 Net domestic migration was a small part of Jerome County's growth (459 people over five years) and a larger part of Twin Falls County's (5,118), so births and international migration did more of the work there than statewide. Lesson 04 breaks these numbers down town by town, and lesson 06 follows the moves.
Where the growth came from: births, other states and other countries
The Census Bureau splits population change into three parts. Natural increase is births minus deaths. International migration is the net movement of people between the state and other countries. Domestic migration is the net movement between the state and the other 49 states and the District of Columbia. For the nation as a whole, domestic migration is zero by definition, because every move out of one state is a move into another.2
| Estimate year (July to July) | Idaho natural increase | Idaho international | Idaho domestic | Idaho domestic rate per 1,000 | Idaho rank on domestic rate | U.S. natural increase | U.S. international |
|---|---|---|---|---|---|---|---|
| 2020 to 2021 | 4,731 | 699 | 52,350 | 27.9 | 1st | 146,036 | 376,026 |
| 2021 to 2022 | 3,436 | 5,908 | 28,019 | 14.6 | 2nd | 224,026 | 1,672,112 |
| 2022 to 2023 | 5,528 | 7,179 | 14,713 | 7.5 | 7th | 494,611 | 2,264,137 |
| 2023 to 2024 | 6,086 | 8,154 | 15,975 | 8.0 | 2nd | 514,277 | 2,734,468 |
| 2024 to 2025 | 6,900 | 2,148 | 19,915 | 9.9 | 2nd | 518,858 | 1,262,202 |
| Five-year total | 26,681 | 24,088 | 130,972 | 71.2 (per 1,000 of 2020 base) | tied for 1st with South Carolina | 1,897,808 | 8,308,945 |
Source: Census Vintage 2025 components of change (NST-EST2025-ALLDATA); rates are the Census Bureau's except the five-year rate and all ranks, which are our calculation. South Carolina's five-year rate rounds to the same 71.2 per 1,000, so we call it a tie.2
Three facts stand out. First, Idaho's growth since 2020 is mostly people moving from other states: 130,972 of the 180,405 added between July 2020 and July 2025, or 72.6 percent (our calculation; the components do not add exactly to the total because the Census Bureau carries a small residual).2 Second, the surge peaked early. The year ending July 2021 brought 52,350 net domestic movers, a rate of 27.9 per 1,000 residents and the highest of any state that year; by 2023 the rate had fallen to 7.5. Third, the nation's growth comes from a different place. For the U.S., international migration was the larger engine, and its drop from 2.7 million in 2024 to 1.3 million in 2025 is the main reason national growth slowed to 0.5 percent.20 Idaho, which draws relatively few international migrants, felt that drop much less.
The neighbors split into two groups. Montana (52.4 per 1,000) and Nevada (27.6) gained from domestic migration like Idaho. Washington (minus 3.2) and Oregon (minus 1.5) lost more people to other states than they gained, and grew through international migration and, in Washington's case, births. Utah gained 50,241 domestic movers over five years, a rate of 15.4 per 1,000, but its growth rests on natural increase: 119,972 more births than deaths, far more than Idaho's 26,681.2 Utah and Idaho post similar headline growth for different reasons, and that difference shows up in housing demand, school enrollment and the age of the population (lesson 08).
Which states Idaho's movers come from, and what they earn compared with the people leaving, is the subject of lesson 06.
Housing units: the stock grew faster than anywhere but Utah
A housing unit is a house, apartment, mobile home or group of rooms intended as separate living quarters, whether anyone lives there or not. A household is the people who occupy one unit. The count of housing units (the stock) is the slowest-moving and most reliable measure of how much a place has built, because it nets out demolitions and conversions that permit counts miss.
| Year | U.S. housing units | U.S. change | Idaho housing units | Idaho change | Utah housing units | Utah change |
|---|---|---|---|---|---|---|
| 1990 (census) | 102,263,678 | 413,327 | 598,388 | |||
| 2000 (census) | 115,904,641 | 13.3% | 527,824 | 27.7% | 768,594 | 28.4% |
| 2010 (census) | 131,704,730 | 13.6% | 667,796 | 26.5% | 979,709 | 27.5% |
| 2020 (census, April 1) | 140,498,736 | 6.7% | 751,859 | 12.6% | 1,151,414 | 17.5% |
| 2025 (estimate, July 1) | 148,260,882 | 5.5% in 5.25 years | 849,155 | 12.9% in 5.25 years | 1,307,088 | 13.5% in 5.25 years |
Sources: 1990 is our sum of the units-in-structure categories in the Census Historical Census of Housing table for 1990, which add to the 1990 total;22 2000, 2010 and 2020 from decennial census tables H001 (2000 and 2010 Summary File 1) and H1 (2020 Demographic and Housing Characteristics);23 2025 from Vintage 2025 housing unit estimates.18 Percent changes are our calculation.
From April 2020 to July 2025 Idaho added 97,296 housing units, a 12.9 percent increase, second among the states to Utah's 13.5 percent; the U.S. stock grew 5.5 percent.24 In the single year from July 2024 to July 2025 Idaho's stock grew 2.1 percent, the fastest rate of any state; Utah was fourth at 1.8 percent and the nation grew 1.0 percent.4 The Census Bureau's housing estimates start from the 2020 census count, add permitted units multiplied by a completion rate (assuming a six-month lag from permit to completion) and new mobile homes, and subtract estimated losses, so they are estimates too, revised each year.25
Idaho's housing growth in the 2020s (12.9 percent in about five years) roughly equals its growth for the whole decade of the 2010s (12.6 percent). The 2010s were slow because the decade began in a housing bust: Idaho's permits fell from 21,578 units in 2005 to 3,815 in 2011.3 The 2000s and 1990s each added more than a quarter to the stock.
Housing units against people
Did housing keep up with population? From April 2020 to July 2025 Idaho's population rose 10.4 percent and its housing stock 12.9 percent, so the stock grew faster than the number of people. The same was true for the nation (3.1 percent and 5.5 percent).224 That comparison does not settle whether Idaho has "enough" housing. Household size has been shrinking for decades, so the number of households can grow faster than the population; some new units are second homes or short-term rentals; and the stock built in the 2020s had to absorb demand that built up in the 2010s, when Idaho's population grew 17.3 percent and its housing stock 12.6 percent. Lesson 03 does this comparison for the cities, and lesson 04 for the Magic Valley towns.
Building permits: the most new homes per person of any state
A building permit is local permission to build. The Census Bureau's Building Permits Survey counts housing units authorized by permits in about 19,900 permit-issuing places; it says more than 99 percent of privately owned residential buildings are built in permit-issuing places, and it imputes values for places that do not report.26 A permit is not a finished home. Some permitted units are never built, and construction can take a year or more. Permits are the earliest signal of building; completions and the housing unit estimates come later.
| Year | U.S. units authorized | U.S. per 1,000 residents | Idaho units authorized | Idaho per 1,000 residents | Idaho share of U.S. units |
|---|---|---|---|---|---|
| 1980 | 1,190,600 | 5.3 | 5,795 | 6.1 | 0.49% |
| 1982 | 1,000,485 | 2,536 | 0.25% | ||
| 1990 | 1,110,766 | 4.5 | 5,703 | 5.7 | 0.51% |
| 2000 | 1,592,267 | 5.7 | 10,915 | 8.4 | 0.69% |
| 2005 | 2,155,316 | 21,578 | 1.00% | ||
| 2010 | 604,610 | 2.0 | 4,153 | 2.6 | 0.69% |
| 2020 | 1,471,141 | 4.4 | 19,130 | 10.4 | 1.30% |
| 2021 | 1,736,982 | 21,732 | 1.25% | ||
| 2022 | 1,680,368 | 18,706 | 1.11% | ||
| 2023 | 1,511,102 | 17,919 | 1.19% | ||
| 2024 | 1,478,000 | 17,630 | 1.19% | ||
| 2025 | 1,431,616 | 4.2 | 17,944 | 8.8 | 1.25% |
Units are the sum of 1-unit, 2-unit, 3 and 4 unit, and 5-or-more-unit buildings in the Census BPS annual state files (estimates including imputation).319 Per 1,000 residents is our calculation using the census count for 1980 to 2020 and the July 1, 2025 estimate for 2025; it is left blank for years where we did not compute an annual population.12 Idaho's share is our calculation.
Idaho authorized 8.8 units per 1,000 residents in 2025, the highest rate of any state; Utah was 7.6 and the nation 4.2. Over the six years 2020 through 2025 Idaho authorized 113,061 units, or 61.5 per 1,000 residents of the April 2020 base, again the highest of any state; Utah followed at 54.6 and the U.S. figure was 28.1 (9,309,209 units nationally).32 Among the neighbors, Nevada authorized 38.7 per 1,000 over the period, Washington 33.7, Montana 32.0, Oregon 25.5 and Wyoming 24.1 (our calculation).
Two cautions. Idaho's 2021 total of 21,732 units was a record, but only 154 units above 2005's 21,578, so the 2020s boom in absolute terms looks much like the mid-2000s boom; it is larger only relative to a smaller population in 2005. And per-person comparisons with the U.S. depend on which population is used. Using the 2020 census count instead of the estimates base changes Idaho's six-year rate by less than 0.1 per 1,000 and does not change its rank.
What kind of housing
Of Idaho's 17,944 units authorized in 2025, 14,112 were in single-unit buildings (78.6 percent), 340 in two-unit buildings, 566 in 3 and 4 unit buildings, and 2,926 in buildings of 5 or more units. Nationally 911,903 of 1,431,616 units (63.7 percent) were single-unit and 463,972 were in 5-plus buildings.3 Idaho builds a larger share of detached and single-family attached homes than the nation, which matters for land use (lesson 05), for renters (lesson 09) and for the cities' zoning choices (Idaho Planning and Zoning).
Construction jobs: a bigger share of Idaho's economy
The Bureau of Labor Statistics Current Employment Statistics survey counts jobs on employer payrolls by industry. The table compares construction jobs with total nonfarm jobs, annual averages, for Idaho and the nation.2728
| Year | U.S. construction jobs | U.S. share of nonfarm jobs | Idaho construction jobs | Idaho share of nonfarm jobs |
|---|---|---|---|---|
| 1990 | 5,263,000 | 4.81% | 19,100 | 4.96% |
| 2000 | 6,787,000 | 5.14% | 36,400 | 6.50% |
| 2006 | 7,691,000 | 5.64% | 52,000 | 8.15% |
| 2010 | 5,518,000 | 4.23% | 31,200 | 5.17% |
| 2019 | 7,493,000 | 4.97% | 52,900 | 6.96% |
| 2025 | 8,267,000 | 5.22% | 74,900 | 8.53% |
BLS series CEU2000000001 and CEU0000000001 (U.S.) and SMU16000002000000001 and SMU16000000000000001 (Idaho), not seasonally adjusted, annual averages in thousands; shares are our calculation.2728
Idaho's construction employment nearly quadrupled from 1990 to 2025, while the nation's grew 57 percent. In 2025 construction was 8.53 percent of Idaho's payroll jobs against 5.22 percent nationally, a larger share than any neighbor: Utah 8.04 percent, Wyoming 7.92, Nevada 7.08, Montana 7.04, Washington 5.99 and Oregon 5.70 (our calculation from the same BLS series).27 A large construction sector is both a sign of growth and a source of risk. From 2006 to 2010 Idaho lost 20,800 construction jobs, 40 percent of the total, compared with a 28 percent drop nationally.2728 Lesson 07 covers the rest of the job picture, including dairy and food processing in the Magic Valley.
Home prices against inflation
The Federal Housing Finance Agency (FHFA) House Price Index is a repeat-sales index: it tracks price changes on the same properties each time they sell or are refinanced, so it is not thrown off when a year's sales happen to include more large or small houses. FHFA describes it as measuring "average price changes for sales or refinancings of the same properties over time." The all-transactions version used here adds appraisal values from refinance mortgages to purchase prices and covers conventional, conforming loans bought or guaranteed by Fannie Mae and Freddie Mac. An index number has no meaning by itself; only its percent changes do.29 The state all-transactions series start at 100 in the first quarter of 1980.5
| Period | U.S. nominal change | U.S. real change | Idaho nominal change | Idaho real change |
|---|---|---|---|---|
| 1980 to 1990 | 61.7% | 1.9% | 23.0% | minus 22.4% |
| 1990 to 2000 | 42.1% | 7.8% | 60.1% | 21.5% |
| 2000 to 2007 | 60.2% | 33.1% | 72.6% | 43.4% |
| 2007 to 2012 | minus 17.6% | minus 25.6% | minus 24.1% | minus 31.4% |
| 2012 to 2019 | 40.1% | 25.8% | 72.2% | 54.7% |
| 2019 to 2022 | 39.3% | 21.7% | 65.6% | 44.7% |
| 2022 to 2025 | 15.2% | 4.7% | 7.7% | minus 2.1% |
| 1980 to 2025 | 581.3% | 74.4% | 693.5% | 103.1% |
| 2000 to 2025 | 196.7% | 58.7% | 302.7% | 115.4% |
Our calculation from the FHFA all-transactions index for Idaho and the U.S., quarterly values averaged to calendar years, deflated with CPI-U annual averages.5306 Annual average index values: Idaho 107.34 (1980), 211.51 (2000), 365.13 (2007), 277.17 (2012), 790.68 (2022), 851.80 (2025); U.S. 102.65, 235.75, 377.70, 311.15, 607.22 and 699.34.
The pattern has four phases. In the 1980s Idaho house prices lost more than a fifth of their value after inflation while national prices held even. From 2000 to 2007 Idaho rose faster than the nation and then fell harder in the crash (down 31.4 percent in real terms from 2007 to 2012, against 25.6 percent nationally). From 2012 to 2022 Idaho's real prices more than doubled: our real index went from 98.3 in 2012 to 220.0 in 2022 (2000 = 100), while the U.S. went from 99.0 to 151.6. Since 2022 Idaho's real prices have slipped 2.1 percent, while national prices kept rising slightly faster than inflation.
Utah followed nearly the same path as Idaho (real index 194.2 in 2022, 189.2 in 2025). Nevada, which had the biggest bubble of the 2000s, fell to 72.3 in 2012 and in 2025 stood at 172.8, below Idaho.5 Montana's real index rose 111.8 percent from 2000 to 2025, close to Idaho's 115.4 percent; Washington's rose 99.0 percent, Oregon's 78.9, Wyoming's 76.1 and Nevada's 72.8, all well above the nation's 58.7 percent (our calculation).
For 2026 to date, FHFA's second-quarter 2026 index was 3.0 percent above the second quarter of 2025 in both Idaho and the nation, in current dollars (not deflated).530 Lesson 09 tracks the metro areas (Boise, Coeur d'Alene, Idaho Falls, Pocatello and Twin Falls) and adds mortgage rates, which turned a flat price into a much higher monthly payment after 2022.
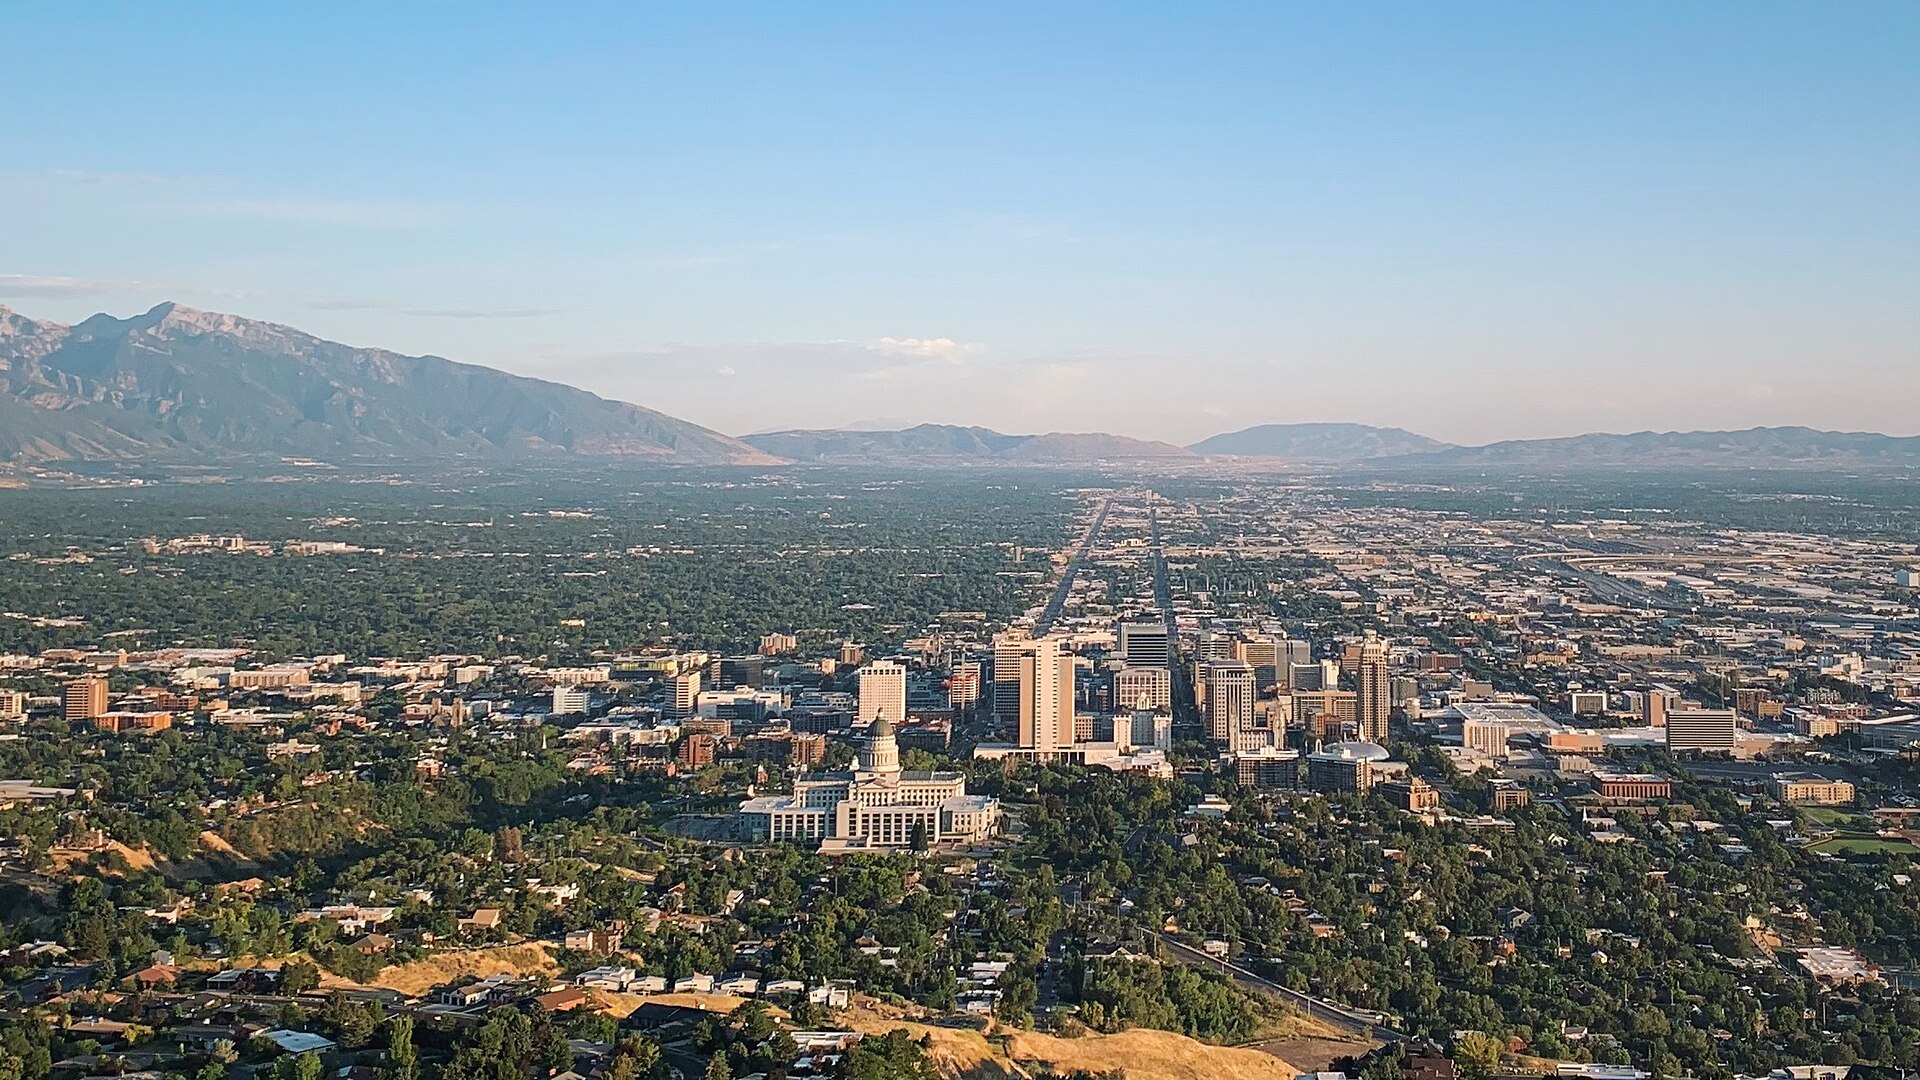

Home values, rents and household incomes
The American Community Survey (ACS) asks a sample of households each year what they think their home is worth, what they pay in rent, and what they earned. Its median (the middle value, with half above and half below) is not a sale price: it covers every owner-occupied home, including homes bought decades ago, and it rests on owners' own estimates. ACS figures are estimates with a margin of error, the range above and below the estimate within which the true value likely falls (the Census Bureau publishes 90 percent margins of error). 1-year estimates cover only areas of 65,000 or more people.13
| Measure (2025 dollars) | U.S. 2010 | U.S. 2025 | U.S. real change | Idaho 2010 | Idaho 2025 | Idaho real change |
|---|---|---|---|---|---|---|
| Median home value (B25077) | $265,609 | $371,100 | 39.7% | $243,758 | $457,800 | 87.8% |
| Median gross rent, monthly (B25064) | $1,262 | $1,557 | 23.4% | $1,008 | $1,462 | 45.0% |
| Median household income (B19013) | $73,889 | $84,780 | 14.7% | $64,210 | $84,234 | 31.2% |
ACS 1-year estimates, 2010 and 2025, converted to 2025 dollars with CPI-U (2010 index 218.056).1573186 The 2010 nominal figures were: U.S. $179,900, $855 and $50,046; Idaho $165,100, $683 and $43,490. The 2025 margins of error are $646 (U.S.) and $6,135 (Idaho) for value, $4 and $31 for rent, and $215 and $1,941 for income.
In 2010 Idaho's median home value was below the nation's. By 2019 it was above ($255,200 against $240,500 in that year's dollars), and by 2025 it was $86,700 above. Idaho's 2025 median household income of $84,234 (plus or minus $1,941) and the U.S. figure of $84,780 (plus or minus $215) are statistically indistinguishable: the difference of $546 is smaller than Idaho's margin of error.328 In 2010 Idaho households earned 13 percent less than the national median (our calculation). Idaho's median income caught up with the nation; its home values passed the nation's.
Price-to-income and rent-to-income ratios
A price-to-income ratio divides the median home value by the median household income; it says how many years of a typical household's gross income the typical home is worth. A rent-to-income ratio divides twelve months of median gross rent by median household income. Both are our calculations from the same ACS year, so inflation cancels out.
| Place | Price-to-income 2010 | 2019 | 2025 | Rent-to-income 2010 | 2019 | 2025 |
|---|---|---|---|---|---|---|
| United States | 3.59 | 3.66 | 4.38 | 20.5% | 20.0% | 22.0% |
| Idaho | 3.80 | 4.18 | 5.43 | 18.8% | 17.3% | 20.8% |
| Utah | 3.97 | 4.36 | 5.47 | 17.4% | 17.4% | 19.9% |
| Montana | 4.25 | 4.44 | 5.54 | 18.1% | 17.4% | 18.8% |
| Washington | 4.89 | 4.93 | 5.94 | 19.6% | 20.7% | 22.0% |
| Oregon | 5.25 | 5.29 | 5.84 | 21.0% | 21.2% | 22.5% |
| Nevada | 3.43 | 5.02 | 5.39 | 22.4% | 22.2% | 23.8% |
| Wyoming | 3.37 | 3.62 | 4.42 | 15.5% | 15.2% | 16.1% |
Our calculation from ACS 1-year tables B25077, B25064 and B19013 for each year.15327318
Idaho's price-to-income ratio rose 1.63 points from 2010 to 2025, more than any neighbor except Nevada (which rose 1.96 points from the bottom of its crash) and about twice the national rise of 0.79 points. In 2025 Idaho's ratio (5.43) sat between Nevada (5.39) and Utah (5.47), below Montana, Oregon and Washington, and well above the U.S. (4.38). Rent tells a milder story: Idaho's rent-to-income ratio (20.8 percent) remains below the national 22.0 percent, because Idaho rents, though up 45 percent in real terms since 2010, are still below the national median.
These are statewide ratios. In the Magic Valley the ACS 2020 to 2024 5-year estimates (the newest that cover counties of this size) give a price-to-income ratio of 3.79 for Jerome County (median value $271,800 plus or minus $16,969; median household income $71,724 plus or minus $3,145) and 5.01 for Twin Falls County ($337,900 plus or minus $8,873; $67,409 plus or minus $3,701), against 5.38 for Idaho and 4.12 for the U.S. on the same 5-year basis.33 Jerome County's median value carries a margin of error of about 6 percent, so its ratio should be read as a range: applying both margins in opposite directions gives roughly 3.4 to 4.2 (our calculation). A 5-year estimate pools 2020 through 2024, so it mixes years before and after the price surge; never put a 5-year county figure beside a 1-year state figure as if they described the same year.
Incomes since 1979
Per capita personal income, from the Bureau of Economic Analysis (BEA), is all income received by a state's residents (wages, business income, investment income, and government benefits such as Social Security) divided by population. It is a different measure from ACS household income: it counts every person, includes income households do not report on surveys, and is available every year back to 1929.9
| Year | U.S. nominal | U.S. in 2025 dollars | Idaho nominal | Idaho in 2025 dollars | Idaho as % of U.S. |
|---|---|---|---|---|---|
| 1979 | $9,232 | $40,939 | $8,007 | $35,507 | 86.7% |
| 1990 | $19,619 | $48,326 | $16,143 | $39,764 | 82.3% |
| 2000 | $30,551 | $57,118 | $25,139 | $47,000 | 82.3% |
| 2010 | $40,557 | $59,879 | $31,958 | $47,184 | 78.8% |
| 2019 | $55,567 | $69,974 | $45,866 | $57,758 | 82.5% |
| 2022 | $66,316 | $57,050 | 86.0% | ||
| 2025 | $77,028 | $77,028 | $64,200 | $64,200 | 83.3% |
BEA per capita personal income by state, current dollars, as updated Sept. 30, 2026, Idaho read on FRED (series IDPCPI) and U.S. from BEA table SAINC1 (Sept. 30, 2026 release); 2025 dollars and percentages are our calculation.96
After inflation, Idaho's per capita income rose 80.8 percent from 1979 to 2025, and the nation's 88.2 percent. Idaho's lowest point relative to the nation was 2011, at 78.4 percent. It climbed to 86.0 percent in 2022 and settled at 83.3 percent in 2025. Since 2000 Idaho's real per capita income has grown 36.6 percent, slightly faster than the nation's 34.9 percent but slower than every neighbor except Nevada (23.9 percent): Montana grew 67.7 percent, Wyoming 65.6, Utah 55.7, Washington 46.2 and Oregon 38.7 (our calculation).9 In 2025 Idaho's per capita personal income of $64,200 was the lowest of the seven states in this comparison.9 BEA reported that U.S. personal income grew 4.9 percent in 2025.34
Why does Idaho look better on household income than on per capita income? Idaho households are larger than the national average (2.59 people per occupied home in 2025 against 2.49 nationally) and Idahoans are younger (median age 37.9 against 39.5), so a typical household income is shared by more people, more of them children.35 Per capita income divides by every person; household income divides by households. Lesson 08 covers household size and age.
Homeownership: high, steady, and harder to measure than it looks
The homeownership rate is the share of occupied housing units lived in by their owners. Three Census sources measure it, and they do not agree exactly. The decennial census counted it through 2000 (the 2010 and 2020 censuses also asked tenure). The Housing Vacancies and Homeownership survey (HVS), part of the Current Population Survey, gives annual state rates from 1984 on. The ACS gives annual state rates from a much larger sample.
| Year and source | United States | Idaho | Utah | Montana | Washington | Oregon | Nevada | Wyoming |
|---|---|---|---|---|---|---|---|---|
| 1980 census | 64.4% | 72.0% | 70.7% | 68.6% | 65.6% | 65.1% | 59.6% | 69.2% |
| 1990 census | 64.2% | 70.1% | 68.1% | 67.3% | 62.6% | 63.1% | 54.8% | 67.8% |
| 2000 census | 66.2% | 72.4% | 71.5% | 69.1% | 64.6% | 64.3% | 60.9% | 70.0% |
| 2006 HVS | 68.8% | 75.1% | 73.5% | 69.5% | 66.7% | 68.1% | 65.7% | 73.7% |
| 2015 HVS | 63.7% | 70.0% | 69.9% | 66.4% | 62.6% | 61.1% | 54.8% | 69.9% |
| 2024 HVS | 65.6% | 71.6% | 68.3% | 71.9% | 64.8% | 63.0% | 61.5% | 73.5% |
| 2025 HVS | 65.2% | 68.3% | 68.3% | 70.7% | 63.4% | 64.1% | 59.1% | 73.7% |
| 2025 ACS 1-year (B25003) | 65.3% | 71.1% | 68.7% | 69.4% | 62.8% | 63.1% | 61.1% | 69.8% |
Sources: Census Historical Census of Housing Tables, homeownership rates by state, 1900 to 2000;36 Census HVS annual homeownership rates by state, read on FRED (series IDHOWN, USHOWN and the matching neighbor series), last updated March 24, 2026;37 ACS 2025 1-year table B25003, owner-occupied units divided by all occupied units (our calculation).10
Idaho's homeownership rate has been above the nation's in every census since 1980 and in every HVS year since 1984.3637 The HVS shows a drop from 71.6 percent in 2024 to 68.3 percent in 2025, which a quick reader could take as a collapse. It is more likely noise. In the Census Bureau's HVS state table, Idaho's quarterly rates carry margins of error of about 3 percentage points at 90 percent confidence (for example, 70.0 plus or minus 3.2 in the fourth quarter of 2025), and Idaho's quarterly rate in 2026 was 70.7 percent in the first quarter, 67.5 in the second and 70.0 in the third.38 The ACS, with a far larger sample, put Idaho at 71.1 percent in 2025, close to its 71.6 percent in 2019.1039 Use the ACS for state levels and the HVS only for long trends, preferably averaged over three years. Part D of this series, coming later, goes deeper on who owns.
In the Magic Valley, the ACS 2020 to 2024 5-year estimates give homeownership rates of 75.2 percent in Jerome County and 70.5 percent in Twin Falls County, against 72.1 percent for Idaho and 65.2 percent for the U.S. on the same basis (our calculation from table B25003).33
Housing cost burden
A household is cost-burdened when it spends 30 percent or more of its income on housing, and severely cost-burdened at 50 percent or more. For renters the ACS measures gross rent (rent plus utilities) as a share of household income (table B25070). For owners it measures selected monthly owner costs (mortgage, taxes, insurance, utilities and fees) as a share of income (table B25091). Households whose share cannot be computed (no income, or no cash rent) are left out of the denominator.
| Measure | U.S. 2019 | U.S. 2025 | Idaho 2019 | Idaho 2025 | Utah 2025 | Montana 2025 | Nevada 2025 |
|---|---|---|---|---|---|---|---|
| Renters paying 30% or more | 48.4% | 51.8% | 45.7% | 48.8% | 50.3% | 48.7% | 53.1% |
| Renters paying 50% or more | 23.7% | 26.2% | 19.6% | 23.7% | 23.4% | 19.6% | 26.6% |
| All owners paying 30% or more | 21.3% | 24.4% | 18.5% | 21.8% | 23.6% | 24.3% | 26.9% |
| Owners with a mortgage paying 30% or more | 26.6% | 30.7% | 23.6% | 28.2% | 29.8% | 32.0% | 34.2% |
Our calculation from ACS 1-year tables B25070 and B25091, 2019 and 2025.1140 Washington, Oregon and Wyoming are in the scorecard below.
Housing costs took a bigger bite in 2025 than in 2019 for every group, in Idaho and in the nation. The increase in Idaho's severely burdened renters (from 19.6 to 23.7 percent) was larger than the national increase (23.7 to 26.2 percent), but Idaho is still at or below the national rates on all four measures. How can Idaho's home prices be high relative to income while fewer Idahoans are cost-burdened? The burden measure reflects what current households pay now, not what a buyer would pay today. Many owners bought before the price run-up, and 39.5 percent of Idaho's owner-occupied homes in 2025 had no mortgage at all (41.0 percent nationally).40 Low property taxes, covered next, also help. A household buying the median Idaho home in 2025 faces a different calculation, which lesson 09 works through.
Property tax as a share of income
Property tax comparisons are easy to get wrong because states lean on the property tax to different degrees and Idaho's homeowner's exemption and levy limits shape what owners pay (see Idaho Property Taxes). Two measures help.
| Measure | U.S. | Idaho | Utah | Montana | Washington | Oregon | Nevada | Wyoming |
|---|---|---|---|---|---|---|---|---|
| State and local property tax revenue as % of personal income, FY2023 | 2.9% | 1.9% | 2.2% | 3.1% | 2.5% | 3.0% | 2.1% | 3.5% |
| Property tax revenue per capita, FY2023 | $2,033 | $1,136 | $1,427 | $2,006 | $2,004 | $1,999 | $1,397 | $2,844 |
| Median real estate taxes paid by owners, 2025 (ACS B25103) | $3,344 | $1,924 | $2,738 | $2,947 | $4,911 | $4,009 | $2,172 | $1,987 |
Rows 1 and 2: Lincoln Institute of Land Policy, Significant Features of the Property Tax, state and local property tax revenue by state, 2023 (a research institute's compilation of government finance data).12 Row 3: ACS 2025 1-year, table B25103.41
On both measures Idaho's property tax burden is below the nation's and among the lowest of its neighbors. Dividing the ACS median tax paid by the ACS median home value gives a rough figure of 0.42 percent of value in Idaho against 0.90 percent nationally (our calculation from tables B25103 and B25077; a ratio of two medians is not a true effective tax rate, because the owners paying the median tax are not necessarily the owners of the median home).417 Low property taxes relative to income are one reason Idaho's owners show lower cost burdens. They also mean that, when values jump, levy limits and the homeowner's exemption decide how much of the jump reaches tax bills, a subject for Part B of this series and for the property tax module.
Farmland
The USDA Census of Agriculture is taken every five years; the newest is 2022, and the next is 2027. Land in farms includes cropland, pasture and rangeland, so it changes slowly even when houses replace irrigated fields at the edge of a city; irrigated land and cropland are better signals of conversion.
| Ag Census year | Idaho farms | Idaho land in farms (acres) | Idaho cropland (acres) | Idaho irrigated land (acres) | U.S. farms | U.S. land in farms (acres) |
|---|---|---|---|---|---|---|
| 2002 | 25,017 | 11,767,294 | 6,152,611 | 3,288,522 | about 2.13 million | about 938 million |
| 2007 | 25,349 | 11,497,383 | 5,918,899 | 3,299,889 | about 2.20 million | about 922 million |
| 2012 | 24,816 | 11,760,109 | 5,793,347 | 3,365,292 | about 2.11 million | about 915 million |
| 2017 | 24,996 | 11,691,912 | 5,894,676 | 3,398,266 | 2,042,220 | 900,217,576 |
| 2022 | 22,877 | 11,547,963 | 5,623,516 | 3,167,499 | 1,900,487 | 880,100,848 |
Idaho: 2022 Census of Agriculture, Idaho, Table 1, Historical Highlights.42 U.S. 2017 and 2022 exact figures and earlier rounded figures from USDA NASS, 2022 Census of Agriculture Highlights, Farms and Land in Farms (the earlier years are read from its rounded twenty-year trend chart).43
From 2017 to 2022 Idaho lost 8.5 percent of its farms and 1.2 percent of its land in farms; the nation lost 6.9 percent of farms and 2.2 percent of land in farms (our calculation). Idaho's irrigated land fell 230,767 acres, or 6.8 percent, in those five years.4243 The census does not say why land left farming (development, water shortage, retirement into conservation programs, or reclassification), so these changes are not all houses. Lesson 05 matches the Ag Census with satellite land cover to show where fields became subdivisions, and the water and agriculture module covers the water rights that move with the land.


Why Idaho differs from the nation
Data can show that Idaho differs; explaining why takes more care. The reasons below are the ones the numbers in this lesson support, with the limits of each stated.
Movers from other states, not births, drive the difference
Idaho's natural increase over the five years to July 2025 (26,681) was smaller than Utah's in any single year (Utah's was 22,899 in its lowest year). What sets Idaho apart is domestic migration: 130,972 net movers, about 71 per 1,000 residents of the 2020 base, the highest rate in the nation, essentially tied with South Carolina.2 Movers bring demand for housing all at once, while births add to housing demand only years later, when children grow up and form households. That is one reason Idaho's housing stock and permits per person grew faster than its neighbors'.
Price gaps within the West
In 2025 Idaho's median home value ($457,800) was below Washington's ($605,600), Utah's ($543,400) and Oregon's ($507,900), and about the same as Nevada's ($459,400).7 Lower prices next door are one plausible pull on movers, and Washington and Oregon both lost more residents to other states than they gained from 2020 to 2025.2 The data in this lesson cannot prove that movers chose Idaho because of price; lesson 06 uses IRS and ACS flow data to show which states the movers came from and what they earned.
A small base
Idaho had about 0.59 percent of the nation's people in 2025.2 A small state can post a high growth rate with modest numbers: Idaho added 28,861 people from July 2024 to July 2025, a 1.4 percent gain; the same number added to the nation's population would barely register (our calculation from the Vintage 2025 estimates).2 Percent growth is the right measure for pressure on local roads, schools and water; raw numbers are the right measure for national comparisons of where people went.
Incomes that lag prices
Idaho's per capita personal income has stayed between 78 and 87 percent of the nation's since 1979.9 Its real home prices, measured by the FHFA index, rose almost twice as much as the nation's after 2000.5 When a state's prices move toward the levels of richer neighbors while its incomes stay below the national average, its price-to-income ratio climbs, which is what the ACS shows for Idaho from 2010 to 2025.
Building, and its limits
Idaho builds more housing per person than any state, mostly single-family homes, and has a larger construction workforce relative to its economy than any neighbor.327 That building has not stopped the price-to-income ratio from rising, but the counterfactual (what prices would have done with less building) cannot be read from these tables. Water, sewer, schools and roads set practical limits on how fast places can add homes; lesson 10 covers them.


The scorecard: Idaho, the U.S. and the neighbors
The table gives each state's value and marks it against the U.S. value using the 5 percent rule explained at the top of this lesson: "above" means more than 5 percent higher than the U.S., "below" more than 5 percent lower, and "in line" within 5 percent either way. Sources are the tables cited in each section above.
| Measure | U.S. | Idaho | Utah | Montana | Washington | Oregon | Nevada | Wyoming |
|---|---|---|---|---|---|---|---|---|
| Population growth, 2020 to 2025 | 3.1% | 10.4% (above) | 8.2% (above) | 5.6% (above) | 3.8% (above) | 0.9% (below) | 5.7% (above) | 2.1% (below) |
| Housing unit growth, 2020 to 2025 | 5.5% | 12.9% (above) | 13.5% (above) | 5.7% (in line) | 7.3% (above) | 5.3% (in line) | 8.1% (above) | 4.4% (below) |
| Permits per 1,000 residents, 2025 | 4.2 | 8.8 (above) | 7.6 (above) | 4.6 (above) | 4.4 (in line) | 3.5 (below) | 5.6 (above) | 3.8 (below) |
| Net migration per 1,000, 2020 to 2025 | 25.10 | 84.30 (above) | 41.30 (above) | 56.80 (above) | 25.70 (in line) | 11.90 (below) | 49.80 (above) | 18.90 (below) |
| Real home price change, 2000 to 2025 | 58.7% | 115.4% (above) | 89.2% (above) | 111.8% (above) | 99.0% (above) | 78.9% (above) | 72.8% (above) | 76.1% (above) |
| Median home value, 2025 | $371,100 | $457,800 (above) | $543,400 (above) | $427,500 (above) | $605,600 (above) | $507,900 (above) | $459,400 (above) | $357,300 (in line) |
| Median gross rent, 2025 | $1,557 | $1,462 (below) | $1,646 (above) | $1,208 (below) | $1,873 (above) | $1,629 (in line) | $1,692 (above) | $1,087 (below) |
| Median household income, 2025 | $84,780 | $84,234 (in line) | $99,311 (above) | $77,099 (below) | $101,946 (above) | $86,953 (in line) | $85,198 (in line) | $80,894 (in line) |
| Per capita personal income, 2025 | $77,028 | $64,200 (below) | $70,323 (below) | $72,066 (below) | $88,944 (above) | $73,283 (in line) | $73,767 (in line) | $91,109 (above) |
| Real per capita income growth, 2000 to 2025 | 34.9% | 36.6% (in line) | 55.7% (above) | 67.7% (above) | 46.2% (above) | 38.7% (above) | 23.9% (below) | 65.6% (above) |
| Price-to-income ratio, 2025 | 4.38 | 5.43 (above) | 5.47 (above) | 5.54 (above) | 5.94 (above) | 5.84 (above) | 5.39 (above) | 4.42 (in line) |
| Homeownership rate, 2025 ACS | 65.3% | 71.1% (above) | 68.7% (above) | 69.4% (above) | 62.8% (in line) | 63.1% (in line) | 61.1% (below) | 69.8% (above) |
| Renters paying 30%+ of income, 2025 | 51.8% | 48.8% (below) | 50.3% (in line) | 48.7% (below) | 50.6% (in line) | 53.1% (in line) | 53.1% (in line) | 41.8% (below) |
| Owners paying 30%+ of income, 2025 | 24.4% | 21.8% (below) | 23.6% (in line) | 24.3% (in line) | 26.4% (above) | 27.3% (above) | 26.9% (above) | 24.9% (in line) |
| Construction share of jobs, 2025 | 5.22% | 8.53% (above) | 8.04% (above) | 7.04% (above) | 5.99% (above) | 5.70% (above) | 7.08% (above) | 7.92% (above) |
| Property tax as % of personal income, FY2023 | 2.9% | 1.9% (below) | 2.2% (below) | 3.1% (above) | 2.5% (below) | 3.0% (in line) | 2.1% (below) | 3.5% (above) |
How we figured it: the scorecard
For each measure we took the U.S. value and each state's value from the same table and year, divided the state value by the U.S. value, and marked the result "above" if the ratio was greater than 1.05, "below" if it was less than 0.95, and "in line" otherwise. Growth rates, per-1,000 rates and ratios were computed by us from the cited tables: population and housing growth from Vintage 2025 estimates; permits per 1,000 from the BPS 2025 state file and the July 1, 2025 population estimate; net migration per 1,000 as the sum of domestic and international migration for 2021 through 2025 divided by the April 2020 estimates base (for the U.S., international only); real home price change from the FHFA all-transactions index and CPI-U; construction share from BLS CES annual averages; price-to-income from ACS 1-year B25077 and B19013. The 5 percent band is our choice. A wider band would put more states "in line"; no ranking in this lesson depends on the band. ACS margins of error mean that values close to the band's edges (for example Oregon's rent, 4.6 percent above the U.S.) could fall on either side of it.
Read across Idaho's row and three patterns appear. On every growth measure (people, housing, permits, migration, construction jobs, real home prices) Idaho is above the nation, usually far above. On household income it is in line, and on per capita income below. On the measures of what households pay (rent, cost burden, property tax) Idaho is below the nation, which in these cases means lighter burdens, though the gap has been narrowing since 2019. Utah matches Idaho on most growth measures but has higher incomes. Montana matches Idaho on migration and real price growth. Washington and Oregon have higher prices and incomes and slower population growth. Nevada matches Idaho on home values but has lower homeownership and higher cost burdens. Wyoming grows slowly and has the highest per capita income in the group.
Pictures, Numbers and Infographics
The lesson's key numbers at three levels: the nation, Idaho, and the Magic Valley (Jerome County and Twin Falls County). Where a county figure is not computed in this lesson, the table names the lesson that has it.
| Measure | United States | Idaho | Magic Valley (Jerome Co.; Twin Falls Co.) | Year | Source |
|---|---|---|---|---|---|
| Population (estimate, July 1) | 341,784,857 | 2,029,733 | 26,362; 97,539 | 2025 | Vintage 2025 estimates221 |
| Population growth, April 2020 base to July 2025 | 3.1% | 10.4% | 8.7%; 8.3% | 2020 to 2025 | Vintage 2025 estimates, our calculation221 |
| Net domestic migration, July 2020 to July 2025 | 0 (by definition) | 130,972 | 459; 5,118 | 2020 to 2025 | Vintage 2025 components221 |
| Housing unit growth | 5.5% | 12.9% | Lesson 04 | 2020 to 2025 | NST-EST2025-HU-CUMCHG24 |
| Units authorized per 1,000 residents | 4.2 | 8.8 | Lesson 04 | 2025 | Census BPS, our calculation3 |
| Units authorized per 1,000 residents, six years | 28.1 | 61.5 | Lesson 04 | 2020 to 2025 | Census BPS, our calculation3 |
| Real home price change (FHFA, CPI-U adjusted) | 58.7% | 115.4% | Lesson 09 (Twin Falls area) | 2000 to 2025 | FHFA HPI all-transactions530 |
| Median home value | $371,100 (1-yr); $332,700 (5-yr) | $457,800 (1-yr); $418,600 (5-yr) | $271,800; $337,900 (5-yr) | 2025; 2020 to 2024 | ACS B25077733 |
| Median gross rent | $1,557 (1-yr); $1,413 (5-yr) | $1,462 (1-yr); $1,238 (5-yr) | $966; $1,089 (5-yr) | 2025; 2020 to 2024 | ACS B250643133 |
| Median household income | $84,780 (1-yr); $80,734 (5-yr) | $84,234 (1-yr); $77,800 (5-yr) | $71,724; $67,409 (5-yr) | 2025; 2020 to 2024 | ACS B19013833 |
| Price-to-income ratio | 4.38 (1-yr); 4.12 (5-yr) | 5.43 (1-yr); 5.38 (5-yr) | 3.79; 5.01 (5-yr) | 2025; 2020 to 2024 | ACS, our calculation733 |
| Homeownership rate | 65.3% (1-yr); 65.2% (5-yr) | 71.1% (1-yr); 72.1% (5-yr) | 75.2%; 70.5% (5-yr) | 2025; 2020 to 2024 | ACS B250031033 |
| Per capita personal income | $77,028 | $64,200 | Lesson 04 | 2025 | BEA via FRED9 |
| Renters paying 30% or more of income | 51.8% | 48.8% | Not computed here | 2025 | ACS B2507011 |
| Construction share of payroll jobs | 5.22% | 8.53% | Lesson 07 | 2025 | BLS CES2728 |
| Property tax as % of personal income | 2.9% | 1.9% | Not available by county here | FY2023 | Lincoln Institute12 |
| Change in land in farms | minus 2.2% | minus 1.2% | Lesson 05 | 2017 to 2022 | USDA Census of Agriculture4243 |
Common mistakes
These are general pitfalls in state-to-nation comparisons, each shown with numbers from this lesson. We do not attribute them to any particular speaker.
- "Fastest-growing" without a period. Idaho was first among the states from April 2020 to July 2025, but second (behind South Carolina, 1.5 percent to Idaho's 1.4 percent) from July 2024 to July 2025.202 Always say which years.
- Reading one HVS year as a trend. The HVS homeownership rate for Idaho fell from 71.6 percent in 2024 to 68.3 percent in 2025, but quarterly state margins of error are about 3 points and the ACS shows Idaho at 71.1 percent in 2025.373810
- Comparing dollars across years without adjusting. Idaho's FHFA index rose 693.5 percent from 1980 to 2025 in current dollars, but 103.1 percent after inflation. The nominal figure overstates real growth almost sevenfold.56
- Comparing index levels across places. Idaho's 2025 FHFA index (851.80) is higher than the U.S. index (699.34), but that does not mean Idaho homes cost more; both started at 100 in 1980, and the levels show only cumulative change since then.29 Use the ACS median value or a sales-price series to compare levels.
- Mixing 1-year and 5-year ACS. Idaho's median home value is $457,800 in the 2025 1-year estimate and $418,600 in the 2020 to 2024 5-year estimate. Both are correct; they describe different periods.733 Compare 1-year with 1-year and 5-year with 5-year.
- Calling an estimate a count. Idaho's 2,029,733 residents on July 1, 2025 is a Vintage 2025 estimate that will be revised next year; only the 2020 figure of 1,839,106 is a census count.217
- Treating permits as homes built. A permit authorizes construction. The Census Bureau's own housing estimates multiply permits by a completion rate and assume a six-month lag.25
- Confusing per capita and household income. Idaho is in line with the nation on median household income ($84,234 against $84,780) but 16.7 percent below on per capita personal income ($64,200 against $77,028). Both are right; they divide by different things.89
- Reading "land in farms" as cropland. Idaho's land in farms fell only 1.2 percent from 2017 to 2022, but its irrigated land fell 6.8 percent.42
- Comparing only with the national average. Idaho's real home price growth since 2000 (115.4 percent) looks extreme beside the nation's 58.7 percent, less so beside Montana's 111.8 percent.5
What we know, what we don't, and what the data can show
What we know
- Idaho has grown faster than the nation in every census decade since 1970 except the 1980s, and was the fastest-growing state from April 2020 to July 2025 (Census apportionment file; Vintage 2025 estimates).
- Idaho authorized more housing units per person than any state in 2025 and over 2020 to 2025, and its housing stock grew faster than any state's from July 2024 to July 2025 (Census BPS; Vintage 2025 housing unit estimates).
- About 73 percent of Idaho's growth from 2020 to 2025 came from net domestic migration (Vintage 2025 components of change).
- Idaho's real home prices rose 115.4 percent from 2000 to 2025, against 58.7 percent for the nation, and have slipped 2.1 percent since 2022 (FHFA HPI and CPI-U, our calculation).
- Idaho's median household income is statistically even with the nation's, but its per capita personal income remains well below (ACS 2025; BEA).
- Idahoans own homes at higher rates, pay a lower share of income in property taxes, and are less likely to be cost-burdened than Americans overall (ACS 2025; Lincoln Institute FY2023).
What we don't know
- How many of the homes built since 2020 went to people moving in from other states compared with Idahoans forming new households. No public dataset links permits to buyers' previous addresses.
- Whether the 2025 HVS drop in Idaho's homeownership rate is real. The ACS 2025 figure suggests not, but the 2026 ACS (due in fall 2027) will tell more.
- How much farmland became housing after 2022. The next Census of Agriculture covers 2027, and its results will not be out until after that year.
- Why exactly people chose Idaho. Migration data show where people came from and their incomes, not their reasons.
- What prices would have done if Idaho had built less, or more. The tables here describe what happened, not the alternatives.
What the data can show
- Whether Idaho's building keeps pace with its population in future years: compare the annual Census BPS state file with the next vintage of population and housing unit estimates (NST-EST2026).
- Whether real prices and rents outrun real incomes: update the FHFA all-transactions index, ACS tables B25077, B25064 and B19013, and BEA per capita income each year, deflated with CPI-U.
- Whether Idaho's migration surge is fading or returning: follow the domestic migration column in each new Census vintage (NST-EST ALLDATA) and the IRS SOI state-to-state migration files.
- Whether cost burdens are rising faster in Idaho than nationally: ACS tables B25070 and B25091, 1-year for the state, 5-year for counties and towns.
- Where Idaho stands against its neighbors on any measure: the same tables for Utah, Montana, Washington, Oregon, Nevada and Wyoming, as in this lesson's scorecard.
Questions people ask
Is Idaho still the fastest-growing state?
From April 2020 to July 2025, yes: 10.4 percent, first among the 50 states. For the single year July 2024 to July 2025, no: Idaho was second at 1.4 percent behind South Carolina's 1.5 percent.220 The next Census vintage (Vintage 2026) will update both; Vintage 2025 state figures came out Jan. 27, 2026.
Did Idaho build enough housing?
Idaho built more per person than any state, and its housing stock grew faster than its population after 2020 (12.9 percent against 10.4 percent).242 Whether that is "enough" depends on how many households wanted to form, on vacancy, and on what prices families can pay. The rising price-to-income ratio (3.80 in 2010, 5.43 in 2025) shows that supply did not keep prices in line with incomes.157
Are Idaho homes more expensive than the U.S. average?
Yes, since about 2019 by the ACS median value. In 2025 the Idaho median was $457,800 and the U.S. median $371,100.7 In 2010 Idaho was below the nation ($165,100 against $179,900).15 Idaho is still cheaper than Washington, Utah and Oregon.
Are rents higher in Idaho than nationally?
No. Idaho's 2025 median gross rent was $1,462, below the U.S. median of $1,557, though Idaho's real rent grew 45.0 percent from 2010 to 2025 against 23.4 percent nationally.3115 HUD Fair Market Rents by county, in lesson 09, show the Magic Valley and Treasure Valley separately.
Is homeownership falling in Idaho?
Not clearly. The HVS says 68.3 percent in 2025, down from 71.6 percent; the ACS says 71.1 percent in 2025, about where it was in 2019. The HVS state sample is small, with margins of about 3 points.371038
Do Idahoans pay less property tax?
Relative to income and per person, yes. State and local property tax revenue equaled 1.9 percent of Idaho personal income in fiscal 2023, against 2.9 percent nationally, and the median Idaho owner paid $1,924 in real estate taxes in 2025 against $3,344 nationally.1241 Individual bills vary widely by county, city, school district and the homeowner's exemption.
Is the boom over?
The surge has cooled. Domestic migration fell from 52,350 in the year ending July 2021 to 19,915 in the year ending July 2025; permits fell from 21,732 in 2021 to 17,944 in 2025; real home prices fell 2.1 percent from 2022 to 2025.235 But on every one of those measures Idaho is still above the nation per person, and nominal prices in the second quarter of 2026 were 3.0 percent above a year earlier.5
How do I get these numbers for my county?
Lesson 13, Build Your Own Growth Profile, walks through each table, and the data course Data and Statistics explains margins of error and percent change.
Hard questions
Do newcomers drive up prices, or follow jobs?
The case that newcomers drive prices: Idaho's growth since 2020 is mostly domestic migration, the surge peaked in the year ending July 2021, and real home prices rose 44.7 percent from 2019 to 2022, faster than in the nation or any of the six neighbors (our calculation from the FHFA index).5 Buyers arriving with equity from higher-priced states can outbid local wage earners. The case that people follow jobs: Idaho's payroll jobs grew from 760,100 in 2019 to 877,800 in 2025, up 15.5 percent against 5.0 percent nationally (our calculation from BLS CES annual averages), and Idaho's median household income caught up with the nation's.2728 What the evidence shows: the timing fits a migration-driven price surge in 2020 to 2022, and the slowdown in both migration and real prices since then fits too. These state-level tables cannot separate how much of the price rise came from newcomers' purchasing power, from low mortgage rates in 2020 and 2021, or from local demand. Lessons 06, 07 and 12 come at the question from the migration, jobs and incentive sides.
Was Idaho a bubble?
The case for "bubble": in May 2022 researchers at Florida Atlantic University and Florida International University ranked the Boise metro first among the 100 largest metros for overvaluation, estimating buyers paid about 72.6 percent above the area's long-term price trend (a university study; its method compares current prices with each metro's own historical trend).44 Nevada's 2000s history shows how far real prices can fall. The case against: Idaho's real prices fell only 2.1 percent from 2022 to 2025, nominal prices were still rising in 2026, and population and permits kept growing. What the evidence shows: as of the second quarter of 2026, Idaho has had a plateau in real terms, not a crash like 2007 to 2012 (when Idaho real prices fell 31.4 percent). Whether prices are "too high" depends on incomes and interest rates, and Idaho's price-to-income ratio of 5.43 is above the nation's 4.38. This lesson gives no advice about buying or selling.
Should Idaho try to slow growth, or build faster?
The case for slowing: longtime residents and farmers point to lost irrigated land (down 6.8 percent from 2017 to 2022), crowded schools and roads, water limits on the Eastern Snake Plain Aquifer, and a property tax system that can shift costs to existing owners as values rise. The case for building faster: builders, renters and young families point to a price-to-income ratio that rose from 3.80 to 5.43 in fifteen years and argue more homes, including apartments, are the only way to keep Idaho affordable for people who work here. What the evidence shows: Idaho already builds more per person than any state and prices still rose faster than incomes; at the same time, the cooling since 2022 came with continued building. State tables cannot settle the trade-off. The local tools (zoning, annexation, impact fees, water and sewer capacity) are in Idaho Planning and Zoning, lesson 10, and Part B of this series.
Are low property taxes helping or hurting affordability?
The case that they help: lower tax bills reduce monthly owner costs, which is one reason Idaho's owners are less likely to be cost-burdened (21.8 percent against 24.4 percent nationally). The case that they hurt: local governments that collect less property tax may have less money for the roads, sewers and schools that new housing needs, and may lean on impact fees or delay growth instead. What the evidence shows: Idaho's property tax share of personal income (1.9 percent) is among the lowest of its neighbors, and its infrastructure strains are documented in lessons 10 and 12 and in School Boards, Budgets, Bonds and Levies and Idaho Roads and Highway Funding. Whether more property tax would buy more housing is a policy judgment the data in this lesson cannot make.
For reporters and advocates
Records and data that exist. Every number in this lesson comes from a public, downloadable table: Census population and housing unit estimates (released each December or January and each May), the Census BPS state, county and place files (monthly and annual), ACS 1-year (normally each September; the 2025 1-year estimates came out Oct. 29, 2026) and 5-year (each December) tables on data.census.gov, the FHFA HPI (quarterly), BEA state personal income (quarterly, with annual revisions each September), BLS CES and QCEW employment, and the USDA Census of Agriculture (every five years). For local detail, city and county building departments keep permit logs, plats and certificates of occupancy; city clerks keep annexation ordinances; cities and counties keep their long-range land use plans and area of city impact agreements; the Idaho Department of Water Resources keeps well permits and water right transfers; and school districts report enrollment to the Idaho State Department of Education. Under Idaho's Public Records Act (Idaho Code Title 74, Chapter 1) you can request records that are not posted; see Idaho Public Records Requests.
What to ask officials. When an official says Idaho or a city is "the fastest-growing," ask for the period and the source table. When a builder or city cites permit numbers, ask how many were completed and occupied, and how many were single-family versus apartments. When anyone compares prices over time, ask whether the figures are adjusted for inflation and which index was used. When a story cites the HVS homeownership rate for Idaho, ask for the margin of error and the ACS figure. When a county cites growth, ask for both the county number and the 5-year margin of error for any ACS figure.
The Idaho and Magic Valley angle. Statewide comparisons hide large differences. Jerome County grew 8.7 percent from 2020 to 2025 with almost no net domestic migration; Twin Falls County grew 8.3 percent with more of it.21 Jerome County's 5-year price-to-income ratio (3.79) is well below the state's (5.38), and its homeownership rate (75.2 percent) is above.33 Those gaps are stories: who is buying in Jerome, where Twin Falls workers live, and whether the Magic Valley's lower prices will last. Lesson 04 has the town numbers, lesson 07 the commuting flows, and lesson 12 the employer incentives. Related modules: Local Government, Urban Renewal and Economic Development, Idaho State Budget, Water Rights and Ag Land for Residents, Data Center Impacts and Idaho Medicaid.
Where to go next
- data.census.gov: The Census Bureau's free table finder for ACS and decennial data. Search a table ID (B25077, B25064, B19013, B25003) and pick a geography to compare Idaho, the U.S. and your county; download as CSV. Free.
- Census population and housing unit estimates: Free official annual estimates for the nation, states, counties and cities, with components of change. Use the newest vintage only; each one replaces the last.
- Census Building Permits Survey: Free monthly and annual permit counts for states, metros, counties and permit-issuing places. Use the annual files for year-to-year comparisons and divide by population for per-person rates.
- FHFA House Price Index: Free quarterly and monthly repeat-sales price indexes for the U.S., states, metros and some counties and ZIP codes. Compare percent changes, not index levels, and deflate with CPI-U for real change.
- BLS CPI Inflation data: Free official CPI-U series and the BLS inflation calculator. Use annual averages to convert dollars from one year to another.
- FRED, Federal Reserve Bank of St. Louis: Free charts and downloads that mirror BEA, Census and BLS series (for example IDPCPI, IDHOWN). Cite the original agency and note the FRED series ID and update date.
- BEA Regional Data (state personal income): Free interactive tables for state and county personal income (SAINC1, CAINC1). Annual revisions arrive each fall, so record the release date you used.
Still being checked (4 items)
These points could not be fully confirmed against a primary source when this lesson was written and fact checked in November 2026. The text above states each one as uncertain.
- Census Historical Census of Housing 1980 units-in-structure totals for Idaho (360,031) did not match the published 1980 total housing count, apparently because that table covers year-round units only; we therefore start the housing unit series at 1990 and did not use a 1980 state housing total.
- U.S. land in farms and farm counts for 2002, 2007 and 2012 are read from the rounded twenty-year trend chart in the NASS 2022 Highlights; we could not open the U.S. Table 1 PDF to confirm exact figures.
- The Lincoln Institute property tax table does not name its underlying source on the page we read; we label it as the Lincoln Institute's compilation and did not cross-check it against the Census Annual Survey of State and Local Government Finances.
- BLS LAUS state unemployment annual averages did not return from the BLS API, so unemployment is not compared in this lesson.
Last verified November 17, 2026. General education, not legal, financial or real estate advice; every figure names its source and year in the Notes and Sources below. Data is revised: check the newest release before relying on any number.
Notes
- U.S. Census Bureau, 2020 Census Apportionment Results, historical apportionment data file apportionment.csv: resident population, percent change and density for the nation and states, 1910 to 2020 (read Nov. 17, 2026). Read it online. ↩
- U.S. Census Bureau, Population Division, Vintage 2025 population estimates and components of change for the nation and states, April 1, 2020 to July 1, 2025, file NST-EST2025-ALLDATA (fields ESTIMATESBASE2020, POPESTIMATE2020 to 2025, NATURALCHG, INTERNATIONALMIG, DOMESTICMIG, RDOMESTICMIG) (read Nov. 17, 2026). Read it online. ↩
- U.S. Census Bureau, Building Permits Survey, annual state files st1990a.txt to st2025a.txt (units in 1-unit, 2-unit, 3 and 4 unit, and 5-or-more-unit buildings, estimates with imputation; U.S. row included); 2025 file st2025a.txt (read Nov. 17, 2026). Read it online. ↩
- U.S. Census Bureau, Estimates of Housing Unit Change for the United States, States, District of Columbia, and State Rankings: July 1, 2024 to July 1, 2025 (NST-EST2025-HU-ANNCHG), released May 2026 (Idaho ranked 1st by percent change, 2.1 percent) (read Nov. 17, 2026). Read it online. ↩
- Federal Housing Finance Agency, House Price Index, all-transactions index, states, quarterly, 1975 Q1 to 2026 Q2 (file hpi_at_state.csv; 1980 Q1 = 100); annual averages and CPI-U adjustment are our calculation (read Nov. 17, 2026). Read it online. ↩
- U.S. Bureau of Labor Statistics, Consumer Price Index for All Urban Consumers (CPI-U), U.S. city average, all items, 1982-84=100, not seasonally adjusted, series CUUR0000SA0, annual averages 1979 to 2025 (2025 = 321.943), retrieved from the BLS Public Data API (read Nov. 17, 2026). Read it online. ↩
- U.S. Census Bureau, American Community Survey 2025 1-year estimates, table B25077, Median Value (Dollars), owner-occupied housing units, United States and states, with margins of error (read Nov. 17, 2026). Read it online. ↩
- U.S. Census Bureau, American Community Survey 2025 1-year estimates, table B19013, Median Household Income in the Past 12 Months (in 2025 inflation-adjusted dollars), United States and states (read Nov. 17, 2026). Read it online. ↩
- U.S. Bureau of Economic Analysis, per capita personal income by state (SAINC1), annual, current dollars, Sept. 30, 2026 release: U.S. values from BEA table SAINC1 (file SAINC1__ALL_AREAS_1929_2025.csv; 2024 $73,634, 2025 $77,028); state values read on FRED, series IDPCPI, UTPCPI, MTPCPI, WAPCPI, ORPCPI, NVPCPI and WYPCPI, which match SAINC1 (read Nov. 17, 2026). Read it online. ↩
- U.S. Census Bureau, American Community Survey 2025 1-year estimates, table B25003, Tenure, United States and states; homeownership rate is owner-occupied divided by total occupied units (our calculation) (read Nov. 17, 2026). Read it online. ↩
- U.S. Census Bureau, American Community Survey 1-year estimates, 2019 and 2025, table B25070, Gross Rent as a Percentage of Household Income in the Past 12 Months; burden shares exclude "not computed" (our calculation) (read Nov. 17, 2026). Read it online. ↩
- Lincoln Institute of Land Policy, Significant Features of the Property Tax, Government Finance Data, "Summary: State and Local Property Tax Revenue, by State, 2023" (total, per capita, percent of general revenue, percent of personal income) (read Nov. 17, 2026). Read it online. ↩
- U.S. Census Bureau, American Community Survey, "When to Use 1-year or 5-year Estimates" (1-year estimates for areas of 65,000 or more; 5-year for all areas) (read Nov. 17, 2026). Read it online. ↩
- U.S. Bureau of Labor Statistics, "2025 Federal Government Shutdown Impact on the Consumer Price Index: Frequently Asked Questions" (October 2025 indexes not published for most series; 2025 annual averages computed from the 11 published months) (read Nov. 17, 2026). Read it online. ↩
- U.S. Census Bureau, American Community Survey 2010 1-year estimates, tables B25077, B25064 and B19013, United States and states (Idaho median value $165,100, median gross rent $683, median household income $43,490) (read Nov. 17, 2026). Read it online. ↩
- U.S. Bureau of Economic Analysis, Real Per Capita Personal Income for Idaho (chained 2017 dollars, adjusted with regional price parities), read on FRED, series IDRPIPC (2024 value $52,816) (read Nov. 17, 2026). Read it online. ↩
- U.S. Census Bureau, Methodology for the United States Population Estimates: Vintage 2025 (nation, states, counties and Puerto Rico), describing the balancing equation, NCHS birth and death data, IRS, Medicare and Social Security data for domestic migration, and annual revision of the full series (read Nov. 17, 2026). Read it online. ↩
- U.S. Census Bureau, Annual Estimates of Housing Units for the United States, Regions, States, and the District of Columbia: April 1, 2020 to July 1, 2025 (NST-EST2025-HU), released May 2026; its notes describe the April 1, 2020 estimates base and Count Question Resolution changes (read Nov. 17, 2026). Read it online. ↩
- U.S. Census Bureau, Building Permits Survey, annual state files for 1980 to 1989 (st1980a.txt to st1989a.txt), same layout as later years (read Nov. 17, 2026). Read it online. ↩
- U.S. Census Bureau, press release, "U.S. Population Growth Slows Due to Historic Decline in Net International Migration," Jan. 27, 2026 (Vintage 2025 state estimates; South Carolina 1.5 percent, Idaho 1.4 percent, July 2024 to July 2025) (read Nov. 17, 2026). Read it online. ↩
- U.S. Census Bureau, Vintage 2025 county population estimates and components of change, file co-est2025-alldata.csv (Jerome County 16053 and Twin Falls County 16083) (read Nov. 17, 2026). Read it online. ↩
- U.S. Census Bureau, Historical Census of Housing Tables, Units in Structure, 1990 state table units1990.txt (1-unit detached, 1-unit attached, 2 to 4, 5 or more, mobile home, other); totals are our sum (read Nov. 17, 2026). Read it online. ↩
- U.S. Census Bureau, decennial census housing unit counts: 2000 Summary File 1 table H001, 2010 Summary File 1 table H1, and 2020 Demographic and Housing Characteristics File table H1, United States and states, via data.census.gov (read Nov. 17, 2026). Read it online. ↩
- U.S. Census Bureau, Cumulative Estimates of Housing Unit Change for the United States, States, District of Columbia, and State Rankings: April 1, 2020 to July 1, 2025 (NST-EST2025-HU-CUMCHG), released May 2026 (read Nov. 17, 2026). Read it online. ↩
- U.S. Census Bureau, Methodology for the United States Housing Unit Estimates: Vintage 2025 (2020 Census base, permits times a completion rate with a six-month lag, mobile home shipments, loss rates from the American Housing Survey) (read Nov. 17, 2026). Read it online. ↩
- U.S. Census Bureau, Building Permits Survey, Methodology (about 19,900 permit-issuing places as of January 2023; more than 99 percent of privately owned residential buildings are in permit-issuing places; imputation for non-reporters) (read Nov. 17, 2026). Read it online. ↩
- U.S. Bureau of Labor Statistics, Current Employment Statistics, State and Metro Area, annual averages, not seasonally adjusted: construction (SMU16000002000000001 and matching series for UT, MT, WA, OR, NV, WY) and total nonfarm (SMU16000000000000001 and matching series), 1990 to 2025, retrieved from the BLS Public Data API (read Nov. 17, 2026). Read it online. ↩
- U.S. Bureau of Labor Statistics, Current Employment Statistics, national, annual averages, construction (CEU2000000001) and total nonfarm (CEU0000000001), 1990 to 2025 (read Nov. 17, 2026). Read it online. ↩
- Federal Housing Finance Agency, "FHFA House Price Index Frequently Asked Questions" (repeat-sales method; all-transactions index adds refinance appraisals; index measures changes, not levels; conforming conventional mortgages purchased or securitized by Fannie Mae or Freddie Mac) (read Nov. 17, 2026). Read it online. ↩
- Federal Housing Finance Agency, House Price Index, all-transactions index, United States and census divisions, quarterly, through 2026 Q2 (file hpi_at_us_and_census.csv) (read Nov. 17, 2026). Read it online. ↩
- U.S. Census Bureau, American Community Survey 2025 1-year estimates, table B25064, Median Gross Rent (Dollars), United States and states (read Nov. 17, 2026). Read it online. ↩
- U.S. Census Bureau, American Community Survey 2019 1-year estimates, tables B25077, B25064 and B19013, United States and states (read Nov. 17, 2026). Read it online. ↩
- U.S. Census Bureau, American Community Survey 2020 to 2024 5-year estimates, tables B25077, B25064, B19013 and B25003, Jerome County and Twin Falls County, Idaho, Idaho and United States, with margins of error (read Nov. 17, 2026). Read it online. ↩
- U.S. Bureau of Economic Analysis, news release BEA 26-19, "GDP (Third Estimate), Industries, Corporate Profits, State GDP, and State Personal Income, 4th Quarter and Year 2025," April 9, 2026 (U.S. personal income up 4.9 percent in 2025) (read Nov. 17, 2026). Read it online. ↩
- U.S. Census Bureau, American Community Survey 2025 1-year estimates, table B25010, Average Household Size of Occupied Housing Units, and table B01002, Median Age by Sex, United States and Idaho (read Nov. 17, 2026). Read it online. ↩
- U.S. Census Bureau, Historical Census of Housing Tables, Homeownership Rates by state, 1900 to 2000 (file owner-tab.txt) (read Nov. 17, 2026). Read it online. ↩
- U.S. Census Bureau, Housing Vacancies and Homeownership (CPS/HVS) annual statistics, homeownership rate by state, read on FRED: series IDHOWN, UTHOWN, MTHOWN, WAHOWN, ORHOWN, NVHOWN, WYHOWN and USHOWN, 1984 to 2025, last updated March 24, 2026 (read Nov. 17, 2026). Read it online. ↩
- U.S. Census Bureau, Housing Vacancies and Homeownership, Table 3, Homeownership Rates by State: 2005 to 2026, quarterly, with margins of error at the 90 percent confidence level (file tab3_state05_2026_hmr.xlsx) (read Nov. 17, 2026). Read it online. ↩
- U.S. Census Bureau, American Community Survey 2019 1-year estimates, table B25003, Tenure, United States and states (Idaho 71.6 percent owner-occupied, our calculation) (read Nov. 17, 2026). Read it online. ↩
- U.S. Census Bureau, American Community Survey 1-year estimates, 2019 and 2025, table B25091, Mortgage Status by Selected Monthly Owner Costs as a Percentage of Household Income; burden shares exclude "not computed" (our calculation) (read Nov. 17, 2026). Read it online. ↩
- U.S. Census Bureau, American Community Survey 2025 1-year estimates, table B25103, Mortgage Status by Median Real Estate Taxes Paid, United States and states (read Nov. 17, 2026). Read it online. ↩
- USDA National Agricultural Statistics Service, 2022 Census of Agriculture, Volume 1, Chapter 1, State Level Data, Idaho, Table 1, Historical Highlights: 2022 and Earlier Census Years (read Nov. 17, 2026). Read it online. ↩
- USDA National Agricultural Statistics Service, 2022 Census of Agriculture Highlights, "Farms and Land in Farms," U.S. farms 1,900,487 and land in farms 880,100,848 acres in 2022; 2,042,220 and 900,217,576 in 2017; earlier years shown rounded in a twenty-year trend chart (read Nov. 17, 2026). Read it online. ↩
- Florida Atlantic University College of Business, news release, May 31, 2022, on housing market rankings by Ken H. Johnson (Florida Atlantic University) and Eli Beracha (Florida International University): Boise metro ranked most overvalued of the 100 largest metros, 72.64 percent above its long-term trend (read Nov. 17, 2026). Read it online. ↩
Check yourself
1. Measured from the April 1, 2020 estimates base to July 1, 2025, where did Idaho rank among the 50 states in population growth?
Census Vintage 2025 estimates (NST-EST2025-ALLDATA): Idaho grew 10.4 percent from its April 2020 base, the highest rate of any state; for July 2024 to July 2025 alone it was 2nd behind South Carolina.
2. In which census decade since 1970 did Idaho grow more slowly than the United States?
2020 Census apportionment file: Idaho grew 6.7 percent from 1980 to 1990, against 9.8 percent for the U.S., ranking 23rd among the states.
3. From July 2020 to July 2025, which component added the most people to Idaho?
Census Vintage 2025 components of change: net domestic migration added 130,972 people, against 26,681 from natural increase and 24,088 from international migration.
4. How many housing units per 1,000 residents did Idaho authorize by building permit from 2020 through 2025, and how did that rank?
Census Building Permits Survey annual state files, 2020 to 2025 (113,061 units), divided by the April 2020 estimates base: 61.5 per 1,000, first among states; Utah was second at 54.6 and the U.S. 28.1 (our calculation).
5. After adjusting with CPI-U, how much did the FHFA all-transactions house price index rise in Idaho from 2000 to 2025?
FHFA HPI all-transactions annual averages (211.51 in 2000, 851.80 in 2025) deflated with CPI-U (172.2 and 321.943): a real rise of 115.4 percent. The U.S. rose 58.7 percent; 302.7 percent is Idaho's nominal rise.
6. Using ACS 1-year estimates, what was Idaho's price-to-income ratio (median home value divided by median household income) in 2025?
ACS 2025 1-year tables B25077 ($457,800) and B19013 ($84,234): 5.43, up from 3.80 in 2010. The U.S. ratio was 4.38 and Washington's 5.94 (our calculation).
7. Idaho's HVS homeownership rate fell from 71.6 percent in 2024 to 68.3 percent in 2025. What is the best reading?
Census HVS Table 3 shows quarterly Idaho margins of error near 3 points, and ACS 2025 table B25003 gives 71.1 percent, close to 2019's 71.6 percent.
8. In 2025, how did Idaho's median household income compare with the U.S. median (ACS 1-year, table B19013)?
ACS 2025 1-year table B19013: Idaho $84,234 plus or minus $1,941; U.S. $84,780 plus or minus $215. Idaho's per capita personal income (BEA) is 16.7 percent below the U.S. ($64,200 against $77,028 in 2025), a different measure.
9. What share of personal income did state and local property taxes take in Idaho in fiscal 2023, compared with the nation?
Lincoln Institute of Land Policy, Significant Features of the Property Tax, state and local property tax revenue by state, 2023: Idaho 1.9 percent, U.S. 2.9 percent (Wyoming 3.5, Utah 2.2).
10. Why can Idaho's FHFA index (851.80 in 2025) be higher than the U.S. index (699.34) without meaning Idaho homes cost more?
FHFA's HPI FAQ says the index measures changes over time, not price levels; the state and U.S. all-transactions series are both set to 100 in 1980 Q1. Use ACS median values to compare levels.
Terms in this lesson
- Estimates base
- The Census Bureau's April 1, 2020 starting population or housing count for its annual estimates; it can differ slightly from the census count because of later corrections.
- Vintage
- The release year of a Census estimates series. Vintage 2025 replaces all earlier vintages, including their figures for past years.
- Natural increase
- Births minus deaths in a period.
- Domestic migration
- Net movement of people between a state and the rest of the United States; zero for the nation as a whole.
- International migration
- Net movement of people between a place and other countries, including Puerto Rico and Armed Forces moves in Census estimates.
- Housing units in new privately owned buildings approved by local building permits, as counted by the Census Building Permits Survey.
- All-transactions index
- The FHFA house price index version that adds refinance appraisals to purchase prices for repeat sales of the same homes.
- Price-to-income ratio
- Median home value divided by median household income for the same place and year; how many years of income the typical home is worth.
- Rent-to-income ratio
- Twelve months of median gross rent divided by median household income for the same place and year.
- Cost-burdened
- A household paying 30 percent or more of its income for housing; severely cost-burdened means 50 percent or more.
- Per capita personal income
- BEA's total personal income of a state's residents, from all sources, divided by its population.
- Homeownership rate
- Owner-occupied housing units divided by all occupied housing units.
- Housing Vacancies and Homeownership survey (HVS)
- A Census survey, part of the Current Population Survey, that publishes quarterly and annual homeownership and vacancy rates, including by state with wide margins of error.
- Scorecard band
- In this lesson, the rule that a state within 5 percent of the U.S. value is in line, more than 5 percent higher is above, and more than 5 percent lower is below.
Sources
- U.S. Census Bureau, 2020 Census apportionment file: resident population 1910 to 2020 (2026-11-17) checked 2026-11
- U.S. Census Bureau, Vintage 2025 state population estimates and components (NST-EST2025-ALLDATA) (2026-11-17) checked 2026-11
- U.S. Census Bureau, Vintage 2025 housing unit estimates by state (NST-EST2025-HU) (2026-11-17) checked 2026-11
- U.S. Census Bureau, Building Permits Survey, annual state files 1980 to 2025 (2026-11-17) checked 2026-11
- U.S. Bureau of Labor Statistics, CPI-U, U.S. city average, all items (CUUR0000SA0) (2026-11-17) checked 2026-11
- Federal Housing Finance Agency, House Price Index, all-transactions, states (2026-11-17) checked 2026-11
- U.S. Census Bureau, American Community Survey 2025 1-year, table B25077 (median value) (2026-11-17) checked 2026-11
- U.S. Census Bureau, American Community Survey 2025 1-year, table B19013 (median household income) (2026-11-17) checked 2026-11
- U.S. Bureau of Economic Analysis, per capita personal income for Idaho (FRED IDPCPI) (2026-11-17) checked 2026-11
- U.S. Census Bureau, HVS Table 3, Homeownership Rates by State, 2005 to 2026 (2026-11-17) checked 2026-11
- U.S. Census Bureau, Historical Census of Housing Tables, Homeownership Rates (2026-11-17) checked 2026-11
- U.S. Bureau of Labor Statistics, Current Employment Statistics, State and Metro Area (2026-11-17) checked 2026-11
- USDA NASS, 2022 Census of Agriculture, Idaho Table 1, Historical Highlights (2026-11-17) checked 2026-11
- Lincoln Institute of Land Policy, state and local property tax revenue by state, 2023 (2026-11-17) checked 2026-11