Lesson 8 of 12 · about 50 minutes · Updated November 21, 2026
Raw Materials: How Much, Why, and the Trend
You'll be able to
- Read a producer price index correctly, including its series ID, base period, seasonal adjustment and national scope
- Compare nominal and inflation-adjusted changes in materials prices since 1979 and since December 2019
- Describe the antidumping, countervailing and Section 232 duties on Canadian softwood lumber and how they stack, with dates and rates
- Explain which 2025 and 2026 trade actions the Supreme Court's IEEPA ruling did and did not affect
- Identify causes of materials price swings beyond tariffs, including demand, mill capacity and costs
- Use the NAHB Cost of Constructing a Home survey with its stated limits, including that it does not separate materials from labor
Start here: the short version
- Materials cost far more than before the pandemic. The Bureau of Labor Statistics (BLS) producer price index for goods used in residential construction (series WPUIP2311001, June 1986=100, not seasonally adjusted, national) stood at 226.7 in December 2019 and 355.005 in October 2026, a 56.6 percent rise (our calculation). Consumer prices rose 31.3 percent over the same months.123
- Lumber is the famous spike, metals are the current one. The softwood lumber index (WPU0811) peaked at 581.5 in May 2021, then fell by more than half within four months. From October 2025 to October 2026 the steel mill products index rose 32.9 percent and copper wire and cable rose 25.5 percent, while softwood lumber rose 10.6 percent.4567
- Over the long run, most materials beat inflation only lately. Measured from the 1979 annual average to the 2024 annual average and adjusted with the consumer price index, lumber fell about 49 percent in real terms, the broad construction materials index fell about 13 percent, and ready-mix concrete and gypsum rose about 9 and 11 percent (our calculation).8
- Canadian lumber pays three layers of duty. After the U.S. Commerce Department's seventh administrative reviews (final results published Oct. 19, 2026, amended effective Nov. 18, 2026), most Canadian mills pay a combined antidumping and countervailing duty deposit rate of 24.72 percent, plus the 10 percent Section 232 duty on softwood lumber that took effect Oct. 14, 2025.9101112
- The cabinet and vanity increase was pushed to 2027. Proclamation 10976 set 25 percent duties on kitchen cabinets and vanities and scheduled 50 percent for Jan. 1, 2026; Proclamation 11000 (Dec. 31, 2025) moved that increase to Jan. 1, 2027.13
- The Supreme Court struck down the emergency-power tariffs, not the material-specific ones. In Learning Resources, Inc. v. Trump (Feb. 20, 2026), the Court held 6 to 3 that the International Emergency Economic Powers Act does not authorize tariffs. Section 232 duties on steel, aluminum, copper and wood rest on a different law and were not part of the ruling.14
- Construction cost is 64.4 percent of a new home's price in the newest builder survey. The National Association of Home Builders (NAHB, a trade group) 2024 survey of 41 builders put the average price at $665,298, with $428,215 in construction cost; the survey does not split that cost into materials and labor.15
Data: BLS producer price indexes and the consumer price index as published through the October 2026 reference month and retrieved from the Federal Reserve Bank of St. Louis FRED database on Nov. 20, 2026 (national, not seasonally adjusted; recent months may be revised). Trade actions: Federal Register notices and presidential proclamations through Nov. 18, 2026. Industry figures: NAHB Cost of Constructing a Home 2024 (published Jan. 20, 2025). Checked Nov. 20, 2026. Index values and duty rates change every month or review; check the issuing agency.
A house is a pile of materials put together by people. This lesson is about the pile: how much the materials cost, why their prices moved the way they did since 1979, and what tariffs and trade cases have done to them in 2025 and 2026. It uses the federal government's own price measures, the producer price indexes kept by the Bureau of Labor Statistics, and the Federal Register notices and presidential proclamations that set duties on lumber, steel, aluminum and copper. It then places materials inside the full price of a new house using the newest national builder survey, which is industry research and is labeled that way throughout.
Three limits run through everything below. There is no Idaho producer price index; every price series here is national. There is no public series that tracks what an Idaho builder paid for a load of studs in Jerome or Meridian on a given day. And the builder survey that splits a home's price into parts does not separate materials from the labor that installs them. Where this lesson computes something (an inflation-adjusted change, a combined duty rate, a hypothetical effect on a house), it says so, gives the inputs and shows the method in a box labeled "How we figured it."
The rest of a home's price (land, labor, fees, financing and builder margin) is the subject of lesson 09. How cheaper materials and value engineering connect to the quality debate is in lesson 07. Part A of this series compared Idaho home prices and rents with inflation in Prices and Rents vs. Inflation; this lesson does the same kind of comparison for the materials that go into a house.

How materials prices are measured
What a producer price index is
The producer price index (PPI) program at BLS "measures the average change over time in selling prices received by domestic producers of goods and services."16 Three words in that definition matter for a house. "Selling prices" means what a mill, plant or factory charges when it sells, not what a contractor pays at the lumber yard after freight and the yard's markup. "Received by domestic producers" means the commodity indexes follow U.S. producers' prices; the BLS overview lists "additional net inputs to industry indexes including imports" as research still in progress, so imported goods and the duties paid on them are not counted directly in these indexes.16 And "average change over time" means a PPI is an index, a ratio to a base period, and never a dollar price.
An index number reads like this: the lumber index (WPU081) uses 1982 as its base, so 1982 averages 100. An October 2026 value of 275.584 means lumber producers' selling prices were about 2.76 times their 1982 average.17 It does not mean lumber costs $275 of anything. Two indexes with different base periods cannot be compared by their levels; they can be compared by their percent changes over the same months, which is what this lesson does.
All the series used here are "not seasonally adjusted." Seasonal adjustment removes patterns that repeat each year; for comparing the same month a year apart (October 2025 with October 2026) or annual averages, unadjusted series work. The newest months in any PPI download are the most likely to change later, so the October 2026 values below may differ slightly from later downloads (we did not confirm BLS's revision schedule for this lesson; see the unverified list).
The series used in this lesson
The table lists each series, the BLS identifier (the same code works on FRED, the St. Louis Fed's free data site, and on the BLS data tools), the base period and the first month of data. All are national. All were retrieved Nov. 20, 2026.
| Material | Series ID | Base (=100) | Data begin | Oct. 2026 value | Note |
|---|---|---|---|---|---|
| Net inputs to residential construction, goods | WPUIP2311001 | June 1986 | June 1986 | 355.005 | All goods that go into new homes, weighted by use; the broadest single measure1 |
| Net inputs to single-family residential construction, goods | WPUIP2311101 | Dec. 2014 | Dec. 2014 | 164.304 | Single-family only18 |
| Net inputs to single-family residential construction, services | WPUIP2311102 | Dec. 2014 | Dec. 2014 | 172.164 | Services bought by single-family builders19 |
| Construction materials (special index) | WPUSI012011 | 1982 | Jan. 1947 | 381.552 | Older, broader materials index20 |
| Lumber | WPU081 | 1982 | Jan. 1926 | 275.584 | Softwood and hardwood17 |
| Softwood lumber | WPU0811 | 1982 | Jan. 1947 | 277.612 | Framing lumber (studs, joists, rafters)4 |
| Hardwood lumber | WPU0812 | 1982 | Jan. 1947 | 284.331 | Flooring, trim and cabinet stock21 |
| Plywood | WPU083 | 1982 | Jan. 1947 | 312.362 | Sheathing and subfloor panels22 |
| Reconstituted wood product manufacturing | PCU321219321219 | June 1991 | June 1991 | 239.526 | Industry index that includes oriented strand board (OSB); we found no OSB-only series on FRED23 |
| Gypsum products | WPU137 | 1982 | Jan. 1947 | 486.546 | Drywall24 |
| Ready-mix concrete | WPU1333 | 1982 | Jan. 1971 | 394.843 | Footings, foundations, slabs, driveways25 |
| Steel mill products | WPU1017 | 1982 | Jan. 1939 | 399.645 | Rebar and structural steel5 |
| Copper wire and cable | WPU10260314 | Dec. 1986 | Dec. 1986 | 610.018 | Building wire6 |
| Nonferrous wire and cable | WPU1026 | 1982 | Jan. 1947 | 488.486 | Copper and aluminum wire together26 |
| Insulation materials | WPU1392 | 1982 | Jan. 1947 | 296.495 | Fiberglass and other insulation27 |
| Consumer price index, all items (CPI-U) | CPIAUCNS | 1982 to 1984 | Jan. 1913 | 337.511 | Used here to adjust for general inflation2 |
The brief for this course asked for an index of "inputs to residential construction less energy." The broad residential inputs series on FRED is titled "Net Inputs to Residential Construction, Goods" (WPUIP2311001), and that is the series used here; we did not find a "less energy" version on FRED, and that gap is listed at the end of the lesson as unverified.1 The descriptions in the "Note" column for the wood, metal and mineral series are plain-language guides to what each material is used for in a house, not BLS definitions of the series' contents.
Where to get the numbers yourself
- Go to FRED (fred.stlouisfed.org) and type the series ID, for example WPU0811, in the search box.
- The series page shows the title, the units (for example "Index 1982=100"), the frequency and whether it is seasonally adjusted.
- Use the "Download" button to save a CSV file of every month. The same data can be pulled from a web address of the form fredgraph.csv?id= followed by the series ID.
- To compare two months, divide the later value by the earlier value and subtract 1. To adjust for inflation, divide that ratio by the same ratio for the CPI-U over the same months, then subtract 1.
- Note the date you retrieved the data. Recent PPI months are revised, so a number pulled in November may differ a little from the same month pulled in March.
For this lesson the CSV files were retrieved through FRED on Nov. 20, 2026; a table of annual averages and selected months computed from them is saved with the lesson's source files. For how to read and present index numbers in general, see the data and statistics training at Data and Statistics.
How much: the long trend since 1979
The lesson starts in 1979 because that is where this housing series starts its long view of Idaho (see Idaho Since 1979: The Long View). Seven of the material series below run back that far. Two of the most useful newer ones (residential inputs, from 1986, and copper wire, from December 1986) do not.
Nominal and inflation-adjusted change, 1979 to 2024
A "nominal" price is the price as recorded at the time. An "inflation-adjusted" or "real" price removes the general rise in prices measured by the consumer price index, so it answers a different question: did this material get more expensive compared with everything else people buy? The table compares the 1979 annual average with the 2024 annual average, the most recent year for which all twelve monthly CPI values exist. (The FRED CPI-U file has no value for October 2025, so a 2025 CPI annual average would rest on eleven months.)2
| Series (ID) | 1979 average | 2024 average | Nominal change | Real change (CPI-adjusted) |
|---|---|---|---|---|
| Construction materials (WPUSI012011) | 87.3 | 328.5 | +276% | -13% |
| Lumber (WPU081) | 114.0 | 253.7 | +123% | -49% |
| Softwood lumber (WPU0811) | 118.1 | 254.4 | +115% | -50% |
| Plywood (WPU083) | 107.9 | 274.9 | +155% | -41% |
| Gypsum products (WPU137) | 98.5 | 473.6 | +381% | +11% |
| Ready-mix concrete (WPU1333) | 81.6 | 383.8 | +370% | +9% |
| Steel mill products (WPU1017) | 80.2 | 291.4 | +263% | -16% |
| Insulation materials (WPU1392) | 71.9 | 281.8 | +292% | -9% |
| CPI-U all items (CPIAUCNS) | 72.575 | 313.689 | +332% | 0% (by definition) |
Sources: BLS series as named, annual averages of monthly not seasonally adjusted values retrieved from FRED Nov. 20, 2026; changes are our calculation.2017422242552728
Read plainly: over 45 years, framing lumber and plywood got much cheaper compared with the rest of the economy, even after the pandemic spike. Concrete and drywall roughly kept pace with inflation and ended a little ahead. The broad materials index ended a little behind. The picture changes depending on the end year, which is the point of the next sections: 2021 and 2022 look very different from 2019 or 2024.
How we figured it: real change, 1979 to 2024
Inputs. Monthly values for each series from FRED (BLS data), retrieved Nov. 20, 2026. We averaged the twelve months of 1979 and the twelve months of 2024 for each series and for the CPI-U (CPIAUCNS): 72.575 for 1979 and 313.689 for 2024, a ratio of 4.3223.
Method. Nominal change = (2024 average / 1979 average) minus 1. Real change = (2024 average / 1979 average) / 4.3223, minus 1. Example, lumber: 253.7 / 114.0 = 2.225; 2.225 / 4.3223 = 0.515; real change about -49 percent (computed from unrounded averages).
Limits. The CPI measures what urban consumers pay for everything, not what builders pay. The PPIs measure domestic producers' selling prices, not delivered prices to a job site, and do not include duties paid on imports. Percent changes depend on the start and end years chosen; 1979 was itself a year of high inflation, and 2024 came after the 2021 and 2022 peaks had faded.
The index lines on one chart
The chart below plots annual averages for lumber, the broad construction materials index, ready-mix concrete and the CPI. The three PPIs use 1982=100 and the CPI uses 1982 to 1984=100; those base periods are close, so the lines start near each other, but the chart is meant to show shapes and timing, and the percent changes in the tables are the exact comparison.
Three patterns stand out. Ready-mix concrete climbs steadily with almost no reversals, because concrete is made and sold within a short truck haul of where it is poured and tracks local costs of cement, aggregate, fuel and labor. Lumber swings far more than anything else, up in 1993 (an annual average of 183, up from 145 in 1992), up in 2004 (204), down to 149 in 2009, and then up to 347 in 2021. The broad materials index sits between them: lumber is part of it, so it bumps up in 2021 and 2022, but it is dominated by steadier products.172025
Since 2019: what changed for each material
For anyone pricing a house in 2026, the long view matters less than the last seven years. The table compares December 2019, the last month before the pandemic, with October 2026, the newest month published when this lesson was checked, and with October 2025, one year earlier.
| Series (ID) | Dec. 2019 | Oct. 2026 | Change since Dec. 2019 | Real change since Dec. 2019 | Change Oct. 2025 to Oct. 2026 |
|---|---|---|---|---|---|
| Inputs to residential construction, goods (WPUIP2311001) | 226.7 | 355.005 | +56.6% | +19.2% | +9.8% |
| Construction materials (WPUSI012011) | 232.2 | 381.552 | +64.3% | +25.1% | +12.1% |
| Lumber (WPU081) | 210.0 | 275.584 | +31.2% | -0.1% | +6.4% |
| Softwood lumber (WPU0811) | 220.6 | 277.612 | +25.8% | -4.2% | +10.6% |
| Plywood (WPU083) | 194.9 | 312.362 | +60.3% | +22.0% | +16.9% |
| Reconstituted wood, incl. OSB (PCU321219321219) | 184.9 | 239.526 | +29.5% | -1.4% | +13.4% |
| Gypsum products (WPU137) | 317.4 | 486.546 | +53.3% | +16.7% | +0.9% |
| Ready-mix concrete (WPU1333) | 278.8 | 394.843 | +41.6% | +7.8% | +2.4% |
| Steel mill products (WPU1017) | 187.4 | 399.645 | +113.3% | +62.4% | +32.9% |
| Copper wire and cable (WPU10260314) | 296.3 | 610.018 | +105.9% | +56.8% | +25.5% |
| Insulation materials (WPU1392) | 193.5 | 296.495 | +53.2% | +16.7% | +4.6% |
| CPI-U all items (CPIAUCNS) | 256.974 | 337.511 | +31.3% | 0% | not published for Oct. 2025 |
Sources: BLS series as named, retrieved from FRED Nov. 20, 2026; October 2026 values are the newest published and may be revised; changes are our calculation.123637
The pattern is not what most people remember. Lumber, the material that made national news in 2021, is now close to where general inflation alone would have put it. The materials that rose most since 2019 are metals: steel mill products more than doubled and copper wire and cable roughly doubled. Plywood, gypsum and insulation rose well ahead of inflation. The broad index for goods used in residential construction ended about 19 percent above inflation, which means a builder buying the same basket of goods in October 2026 paid about a fifth more in real terms than in December 2019.3
The services side of a builder's purchases moved too. The single-family services index (WPUIP2311102, December 2014=100) rose from 114.3 in December 2019 to 172.164 in October 2026, 50.6 percent, and 11.5 percent in the latest twelve months; the single-family goods index (WPUIP2311101) rose 53.8 percent since December 2019 and 8.9 percent in the latest twelve months.19183

The spikes and the crashes
Materials prices did not rise in a straight line. The monthly series show four episodes worth knowing by date, because people often compare a price today with the wrong reference point.
2004 to 2006: the housing boom
The lumber index reached 219.0 in August 2004, its highest month of the boom years, and the broad construction materials index kept rising through 2006 to 183.3 in September 2006. Ready-mix concrete rose from an annual average of 151 in 2003 to 199 in 2006, a 32 percent jump in three years, and kept rising through 2009 even as home building fell. Steel mill products reached 187.3 in October 2006.172025528
2008 to 2011: the crash
When home building collapsed, lumber went with it. The lumber index fell to 143.7 in May 2009, 34 percent below its August 2004 peak (our calculation). The broad residential inputs index, which includes many steadier products, reached 192.6 in August 2008 and then fell back. Concrete did not fall much at all; its annual average was higher in 2009 (218) than in 2007 (207).1712528
The crash mattered for supply as well as price. A University of Idaho and University of Montana report on Idaho's industry found that after the 2007 to 2009 recession, most Idaho sawmills had raised operating levels "from around 60 percent to 75 percent or more of capacity utilization" by 2015, "due in part to slowly increased demand from housing starts and several years of rising lumber prices."29 Mills that run at 60 percent of capacity for years close lines, cut shifts or shut down, and capacity that is gone cannot be switched back on when demand returns.
2020 to 2022: the pandemic spike
The softwood lumber index stood at 212.3 in April 2020, the first full month of pandemic shutdowns. Thirteen months later, in May 2021, it reached 581.5, a 174 percent rise. By September 2021 it was back down to 273.9, 53 percent below the peak (our calculations).428 Other materials peaked later and fell less:
| Series (ID) | Pandemic-era peak month | Peak value | Low after peak (month) |
|---|---|---|---|
| Softwood lumber (WPU0811) | May 2021 | 581.5 | 240.798 (Nov. 2023) |
| Lumber (WPU081) | May 2021 | 462.0 | 240.351 (Nov. 2023) |
| Plywood (WPU083) | June 2021 | 471.3 | 273.847 (July 2023) |
| Steel mill products (WPU1017) | Dec. 2021 | 449.711 | 297.967 (Nov. 2023) |
| Reconstituted wood, incl. OSB (PCU321219321219) | March 2022 | 530.711 | 260.214 (Feb. 2023) |
| Construction materials (WPUSI012011) | May 2022 | 353.015 | 326.449 (Dec. 2022) |
| Inputs to residential construction, goods (WPUIP2311001) | June 2022 | 322.036 | 305.558 (Dec. 2022) |
| Copper wire and cable (WPU10260314) | April 2022 | 425.859 | (no lasting decline; above this peak by 2025) |
| Gypsum products (WPU137) | Nov. 2022 | 463.006 | (no lasting decline) |
| Ready-mix concrete (WPU1333) | Dec. 2022 | 344.153 | (no decline; kept rising) |
Sources: BLS series as named, monthly not seasonally adjusted values retrieved from FRED Nov. 20, 2026; "peak" is the highest month from January 2020 through December 2022 and "low" is the lowest month from June 2022 through December 2023 (our calculations).28
The table shows why "materials went up and came back down" is only half true. Wood products came most of the way back down by 2023. Drywall, concrete and insulation did not come back down at all; they stayed at their new levels and kept rising more slowly. The broad residential inputs index fell only about 5 percent from its June 2022 peak to its December 2022 low before rising again.128
Lumber futures traded on the Chicago Mercantile Exchange reached record highs in 2021 that are often quoted in dollars per thousand board feet. Those are futures contract prices, a different measure from the PPI, and we did not confirm the peak figures from an exchange record for this lesson, so none is stated here.
2025 to 2026: metals and tariffs
The newest twelve months look different again. From October 2025 to October 2026, steel mill products rose 32.9 percent and copper wire and cable 25.5 percent; nonferrous wire and cable (WPU1026) rose 19.6 percent. Softwood lumber rose 10.6 percent, plywood 16.9 percent and the reconstituted wood index 13.4 percent. Gypsum (0.9 percent), concrete (2.4 percent) and insulation (4.6 percent) barely moved. The broad residential inputs index rose 9.8 percent.5626422237
Softwood lumber moved within the year: the index fell to 250.132 in December 2025, rose to 300.547 in July 2026, and was 277.612 in October 2026.4 The trade actions behind some of these moves are the next section. The PPI cannot by itself show how much of any change came from duties; it measures domestic producers' prices, and domestic mills can raise their own prices when competing imports carry duties, but the index does not separate that effect from changes in demand, costs or anything else.
Tariffs and trade cases on building materials
Four kinds of federal trade action touch the materials in a house. They rest on different laws, are set by different offices and change on different schedules, so they are easiest to follow one at a time.
| Kind of action | Legal basis | Who sets it | Materials affected in 2025 and 2026 |
|---|---|---|---|
| Antidumping (AD) duty | Tariff Act of 1930, as amended (trade remedy law) | Commerce Department, International Trade Administration, after an investigation and yearly administrative reviews | Canadian softwood lumber9 |
| Countervailing (CVD) duty | Tariff Act of 1930, as amended | Commerce Department, same process | Canadian softwood lumber10 |
| Section 232 duty | Section 232 of the Trade Expansion Act of 1962 (national security) | The President by proclamation, after a Commerce investigation | Softwood timber and lumber, kitchen cabinets and vanities, upholstered wood products; steel and aluminum and their derivatives; semi-finished copper products123031 |
| Emergency-power tariffs | International Emergency Economic Powers Act (IEEPA) | The President by executive order | Broad tariffs by country in 2025; held unlawful by the Supreme Court Feb. 20, 202614 |
Two terms first. An antidumping duty offsets imports sold in the United States below what Commerce calculates as their fair value. A countervailing duty offsets subsidies that Commerce finds a foreign government gave its producers. Together they are called AD/CVD duties. Importers pay a cash deposit at the rate in force when the lumber enters the country, and the final amount owed is set later, in an "administrative review" that looks back at one calendar year of shipments. That is why the rates below carry two dates: the year reviewed and the date the new deposit rate took effect.32
Canadian softwood lumber: the AD/CVD case
The lumber dispute between the United States and Canada is decades old. The current round began after the 2006 Softwood Lumber Agreement expired on Oct. 12, 2015. On Nov. 25, 2016, a coalition of U.S. lumber producers filed petitions with the Commerce Department, starting what British Columbia's government calls the "Lumber V" proceedings, and the AD and CVD orders that followed remain in place; the U.S. International Trade Commission voted on Nov. 30, 2023 to keep them.33
Each year Commerce reviews a past year of shipments, picks a few large Canadian companies as "mandatory respondents," calculates their rates, and assigns most other companies a "non-selected" rate. The two most recent reviews:
| Review (year of shipments) | Notice | Company rates | Non-selected rate |
|---|---|---|---|
| AD, sixth review (2023) | 90 FR 35666, July 29, 2025 | Canfor 35.53%; West Fraser 9.65% | 20.56% |
| CVD, sixth review (2023) | 90 FR 38755, Aug. 12, 2025 | Canfor 12.12%; West Fraser 16.82% | 14.63% |
| AD, seventh review (2024) | FR Doc. 2026-21296, published Oct. 19, 2026 (signed Oct. 13, 2026) | Canfor 17.00%; Resolute 13.13%; West Fraser 4.71% | 10.64% |
| CVD, seventh review (2024) | FR Doc. 2026-21286, published Oct. 19, 2026 (signed Oct. 13, 2026) | Resolute 12.42%; West Fraser 15.31% | 14.11% |
| Seventh review, amended (2024) | Rates effective Nov. 18, 2026, as tabulated by the British Columbia government | Canfor 31.08% combined; West Fraser 20.02%; Resolute 25.48% (CVD 12.35%) | 24.72% combined (AD 10.64% + CVD 14.08%) |
Sources: Commerce Department final results in the Federal Register; British Columbia Ministry of Forests softwood lumber page for the amended rates.343591011
The combined non-selected rate was 35.19 percent after the sixth reviews in 2025 (20.56 plus 14.63, our addition) and 24.72 percent after the amended seventh reviews in November 2026.343511 The AD/CVD rate on Canadian lumber therefore went down in late 2026, even as the Section 232 duty described next was added on top. Companies that have never had their own rate and are not on the review lists pay the original investigation's "all others" rates: the seventh AD notice gives 6.04 percent for AD, and the seventh CVD notice gives 14.19 percent for CVD.3236
One caution from the AD notice itself: the notice describes the 10.64 percent non-selected rate as an average of the mandatory respondents' rates, and a simple average of the three company rates (17.00, 13.13 and 4.71) does not equal 10.64. Commerce uses weighted averages based on sales volumes that are not printed in the notice, so the figure cannot be checked from the notice alone.9
Section 232: timber, lumber, cabinets and vanities
On Sept. 29, 2025, President Trump signed Proclamation 10976, "Adjusting Imports of Timber, Lumber, and Their Derivative Products Into the United States," under Section 232 of the Trade Expansion Act of 1962, which lets the President adjust imports that the Commerce Department finds threaten national security. It was published at 90 FR 48127 on Oct. 6, 2025.12 It set:
- a 10 percent duty on softwood timber and lumber;
- a 25 percent duty on certain upholstered wooden products, scheduled to rise to 30 percent on Jan. 1, 2026;
- a 25 percent duty on kitchen cabinets and vanities, scheduled to rise to 50 percent on Jan. 1, 2026;
- an effective time of 12:01 a.m. Eastern Daylight Time on Oct. 14, 2025.
The proclamation capped the duty for the United Kingdom at 10 percent and, for the European Union and Japan, capped the duty plus the ordinary tariff at 15 percent. It states that the new duties are "in addition to any other duties, taxes, fees, exactions, and charges," which by its plain words includes AD/CVD deposits on Canadian lumber.37 Canada received no cap in the proclamation.
On Dec. 31, 2025, Proclamation 11000 (91 FR 1039, Jan. 9, 2026) postponed the two scheduled increases by a year: "Effective January 1, 2027, the duty rate in clause 2 shall increase to 30 percent and the duty rate in clause 3 shall increase to 50 percent." It kept the exception for countries that reach an agreement with the United States and left the 10 percent lumber rate unchanged.13 As of Nov. 20, 2026, we found no later proclamation changing the Jan. 1, 2027 date, but proclamations can be issued at any time, and readers checking this after that date should look for one.
How we figured it: the layers on a load of Canadian lumber
Inputs. AD deposit rate for non-selected companies, 10.64 percent (seventh review); CVD deposit rate for non-selected companies after the amendment, 14.08 percent; Section 232 duty on softwood lumber, 10 percent.91112
Method. Each of these duties is charged as a percent of the customs value of the lumber, so we added them: 10.64 + 14.08 + 10 = 34.72 percent. On a hypothetical shipment with a customs value of $100,000, the deposits would be about $10,640 (AD), $14,080 (CVD) and $10,000 (Section 232), $34,720 in all. This is a hypothetical example to show the arithmetic.
Limits. Final AD/CVD amounts are set in later reviews and can be higher or lower than the deposits; refunds with interest or extra bills follow. Ordinary tariff rates, merchandise processing fees and any agreement-based exceptions are left out. A company with its own rate (for example West Fraser, 20.02 percent AD/CVD combined after the amendment) would add 10 percent to its own rate instead.
Steel, aluminum and copper
Metals in a house include rebar in footings and foundations, steel beams and posts, nails, screws and connectors, aluminum in windows and some siding, copper building wire, and copper pipe and fittings where builders still use them.
- Steel and aluminum. Proclamation 10947, signed June 3, 2025 (90 FR 24199), raised the Section 232 duty on steel and aluminum articles and their derivatives from 25 percent to 50 percent, effective 12:01 a.m. Eastern Daylight Time on June 4, 2025, with the United Kingdom kept at 25 percent.30 The White House website lists a further proclamation on aluminum and steel imports dated June 2026; we could not open it and do not describe it here (see the unverified list).
- Copper. Proclamation 10962, signed July 30, 2025 (90 FR 37727, Aug. 5, 2025), set a 50 percent duty on "semi-finished copper products and intensive copper derivative products," effective Aug. 1, 2025, applied to the copper content of covered goods. Refined copper was not taxed; the proclamation asked the Commerce Secretary for an update by June 30, 2026, so the President could decide whether to phase in a duty on refined copper of 15 percent from Jan. 1, 2027 and 30 percent from Jan. 1, 2028.3138 The product list is an annex printed as images in the Federal Register, and we did not confirm from it whether building wire is a covered derivative.
The price indexes moved in the same direction as these actions. The steel mill products index was 261.563 in January 2025 and 399.645 in October 2026, up 52.8 percent; copper wire and cable rose from 417.399 to 610.018, up 46.1 percent, over the same months (our calculations).567 Timing alone does not prove the duties caused the rise. Copper is traded on world metal exchanges, and steel prices depend on demand, mill capacity and scrap prices as well as trade policy. What the record supports is narrower: the duties raised the cost of imported metal by a known percentage on known dates, and domestic producers' prices rose a great deal over the same period.
IEEPA tariffs and the Supreme Court
Through 2025 the administration also imposed broad tariffs on imports from most countries under the International Emergency Economic Powers Act (IEEPA), a law that lets the President regulate some economic transactions during a declared national emergency. Importers sued. On Feb. 20, 2026, in Learning Resources, Inc. v. Trump (No. 24-1287), decided with Trump v. V.O.S. Selections, Inc., the Supreme Court held 6 to 3 that, in the words of a Congressional Research Service summary, "IEEPA does not give the President authority to impose tariffs." Chief Justice Roberts wrote the opinion; Justices Kavanaugh, Alito and Thomas dissented.14
The ruling did not reach Section 232. A Congressional Research Service legal summary written three days later says the Court did not address tariffs imposed under other laws such as Section 232 or Section 301. The same summary reports that the President then proclaimed new tariffs under Section 122 of the Trade Act of 1974, which allows a temporary import surcharge of up to 15 percent for up to 150 days to deal with "large and serious United States balance-of-payments deficits."39 For a house, this means the duties written specifically on lumber, cabinets, steel, aluminum and copper stayed in force after the ruling, while the broad country-by-country tariffs that had applied to many other building products (fixtures, appliances, tools, hardware) ended or were replaced. We did not confirm the Section 122 rate actually imposed or whether it was extended, and the refund process for IEEPA tariffs already paid is outside this lesson.
USMCA and Canada
The United States-Mexico-Canada Agreement (USMCA) governs most trade with Canada and Mexico. It does not stop AD/CVD cases; the Canadian lumber orders continued throughout. Proclamation 10976 gave caps to the United Kingdom, the European Union and Japan and did not give one to Canada.37 We did not review USMCA dispute panel decisions on lumber for this lesson and say nothing here about them.
Why prices move: causes beyond tariffs
Tariffs get the headlines, but the price series moved just as hard in years with no new tariffs at all (2004, 2009, 2021). The causes fall into four groups. The evidence for each is uneven, and this section says which parts come from a record and which are general explanations offered by the sources named.
Demand: housing starts and interest rates
Lumber demand follows home building. The 2016 University of Idaho and University of Montana report on Idaho's industry put it directly: "Idaho wood products markets are highly correlated with U.S. housing starts," and "since 1994, more than 90 percent of the variance in the level of Idaho lumber production can be explained by U.S. housing starts."40 The same report tied mortgage rates to that demand, expecting rates to stay "near historically low levels" in 2016 and supporting home buying.40 The 2014 edition described the mechanism in a single year: U.S. housing starts grew more than 15 percent in 2013, lumber prices reached eight-year highs in March and April 2013, and mills "increased production by bringing recession-idled capacity back into operation," which then pushed prices back down.41
The pandemic spike fits the same pattern at a larger scale: demand for building and remodeling rose quickly in 2020 and 2021 while mills and supply chains were disrupted, and wood prices more than doubled in about a year before falling just as fast (see the table above). We did not pull housing start or mortgage rate series into this lesson; lesson 09 covers financing and rates.
Supply: mills, timber, fire and insects
Wood supply depends on standing timber, the mills that cut it and the labor and trucks that move it. The 2016 Idaho report noted that the 2006 Softwood Lumber Agreement had expired and that "Canadian lumber may increase as a result," which shows how closely Idaho mills watch Canadian supply.40 Industry and news accounts often name other supply causes in western Canada: the mountain pine beetle outbreak, large wildfires, and mill closures and curtailments in British Columbia. Those are commonly cited, but the British Columbia government page we used for duty rates does not discuss them, and we did not read a primary British Columbia or Canadian forest service report on them for this lesson; they are listed as unverified.11
In Idaho, the same report showed how timber supply shifted by owner. In 2015, private lands provided 62 percent of Idaho's timber harvest volume, state lands 27 percent and National Forest System lands about 11 percent, even though "more than three-fourths of Idaho's timber resources are on federal lands." Between 1947 and 1990, federal lands had provided on average 43 percent of the harvest.42 These are 2015 figures from a 2016 report, the newest edition of the series we were able to retrieve; the shares may differ now.
Costs and logistics
Energy, freight and labor costs enter every material differently. Concrete and drywall are heavy and bulky, and ready-mix concrete must be poured within hours of mixing, so they are made close to where they are used and their prices track regional costs. Lumber and panels travel long distances by rail and truck. Copper and steel are global commodities whose raw material prices are set on world markets. The PPI program publishes a separate index for the services a builder buys (WPUIP2311102), which rose 50.6 percent from December 2019 to October 2026, a reminder that the cost of getting materials to a job site rose along with the materials themselves.193
Why each material moved differently
| Material | Pattern in the index | Main drivers named by the sources used here |
|---|---|---|
| Softwood lumber, plywood, OSB | Large swings; 2021 peak, back near inflation by 2026 | Housing starts, mill capacity, Canadian supply and duties404 |
| Ready-mix concrete | Steady climb, almost no declines since 1979 | Made and sold locally; index rose in 2009 when building fell25 |
| Gypsum (drywall) | Rose 2021 to 2022, then held flat | Index shows no lasting decline after the peak24 |
| Steel mill products | 2021 peak, decline to 2023, sharp rise 2025 to 2026 | 50 percent Section 232 duty from June 4, 2025305 |
| Copper wire and cable | About doubled since 2019; highest values in the series in 2026 | World copper prices; 50 percent duty on semi-finished copper from Aug. 1, 2025316 |
| Insulation | Steady rise, ahead of inflation since 2019 | Index only; no cause stated in the sources used here27 |
Idaho timber, mills and local prices
Idaho is a timber state, and people often ask whether that makes lumber cheaper here. The record available for this lesson does not answer that directly, because no public series tracks lumber prices paid in Idaho, but it does show how Idaho mills sell.

What the Idaho industry reports show
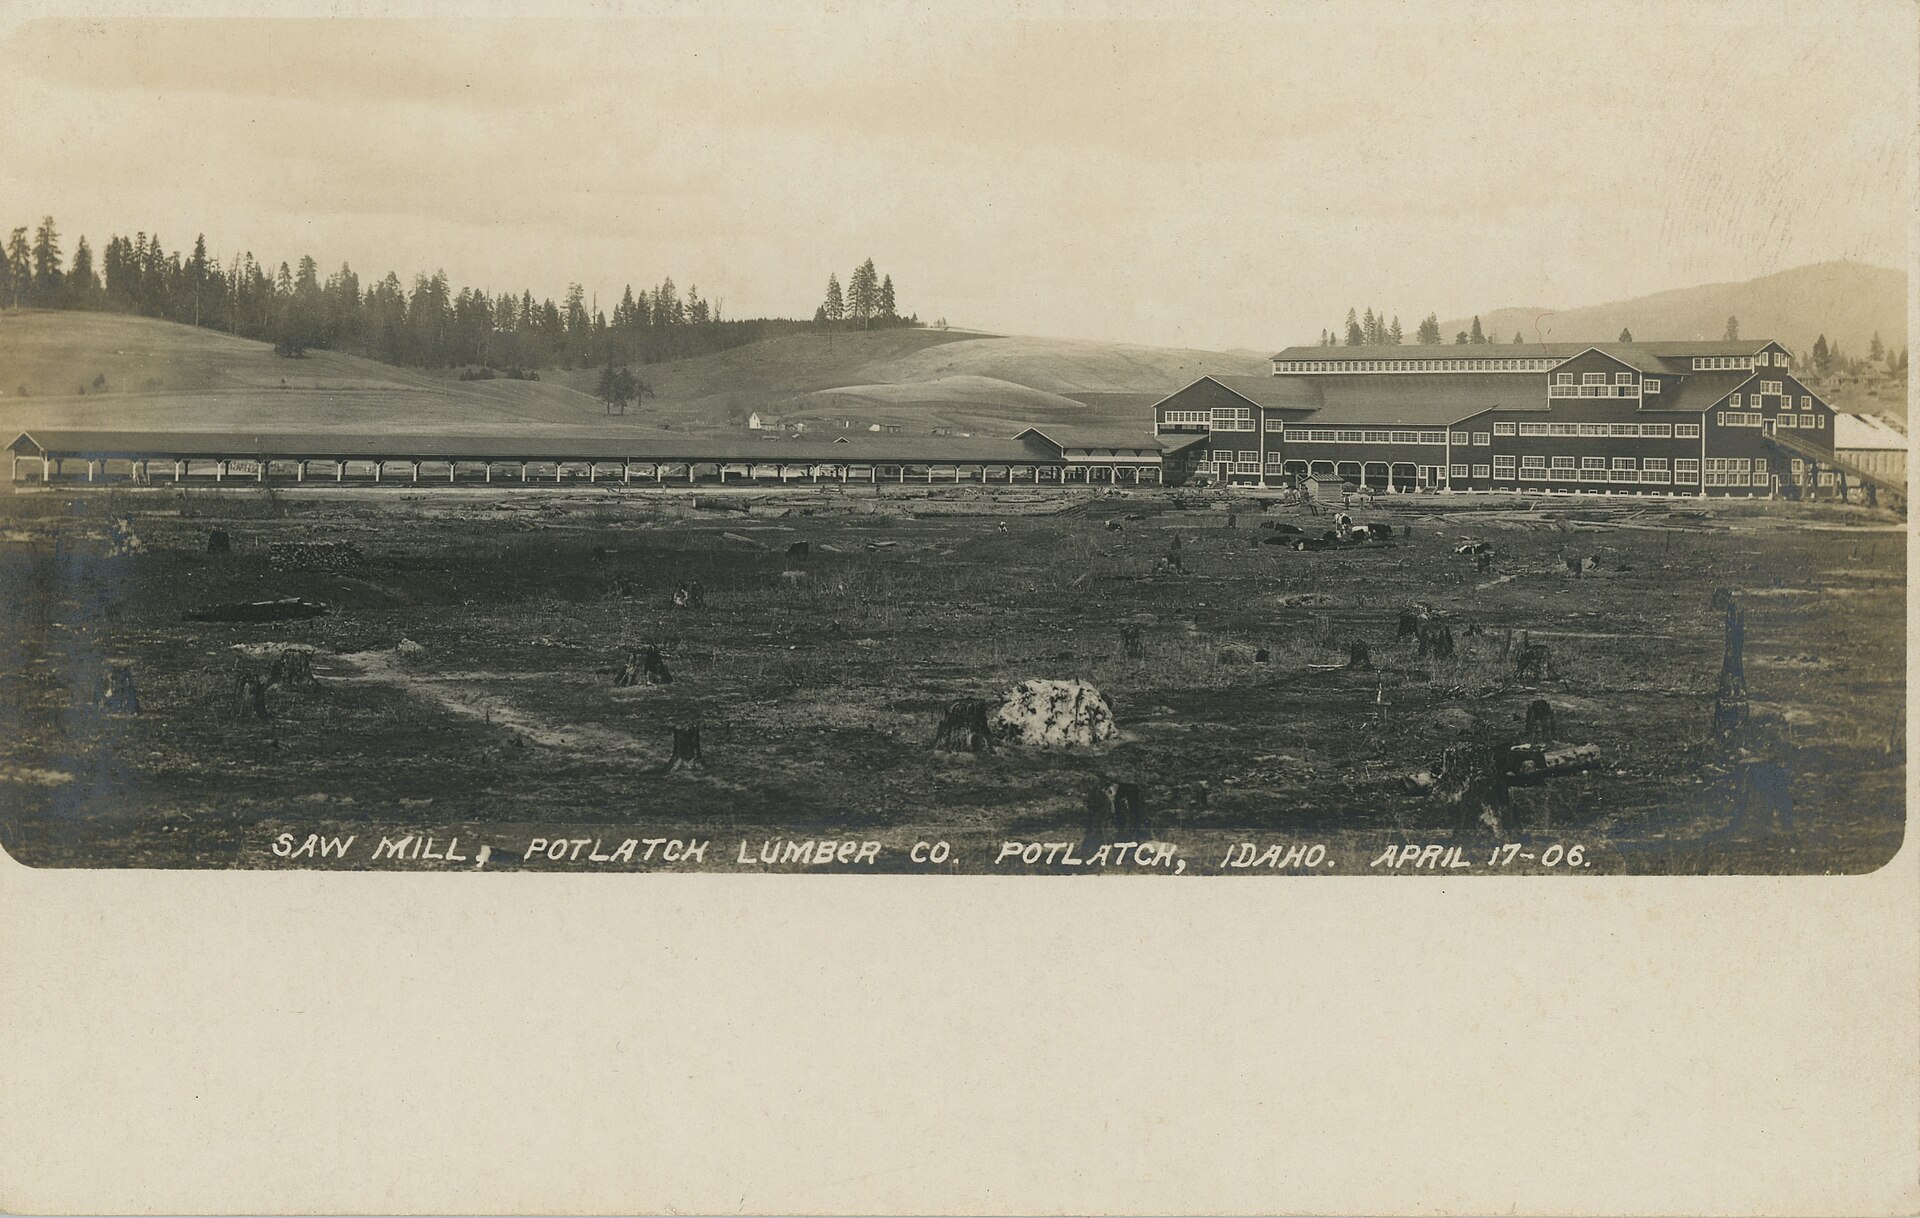
The University of Idaho's Policy Analysis Group and the University of Montana's Bureau of Business and Economic Research published yearly reports on Idaho's forest products industry, with funding from the Idaho Forest Products Commission noted in the 2014 edition.41 The 2016 edition reported, for 2015 (estimates based on information through mid-November 2015):4229
- Idaho lumber production of about 1.75 billion board feet, up 5 percent from 1.67 billion in 2014.
- Timber harvest of about 1.05 billion board feet (Scribner log scale), 40 percent above the recession low of 746 million board feet in 2009.
- Total forest products sales of $2.72 billion, with lumber sales of about $761 million.
- Forest products employment of 11,980 jobs and average earnings of $56,600 per job, about 39 percent above the Idaho average of $40,600.
- "About 90 percent of primary wood products and 65 percent of primary paper products are exported out of the state."
That last figure answers part of the price question. When nine-tenths of what Idaho mills make leaves the state, Idaho lumber is sold at prices set in a market that covers the western United States and Canada, and an Idaho builder buying studs competes with buyers elsewhere for the same output. The 2014 report charted lumber prices using a "nationwide composite" price from the trade publication Random Lengths, again a national measure.41 Freight from a nearby mill can cost less than freight from a distant one, so delivered prices could be somewhat lower close to a mill, but we found no public data that measures that difference for Idaho.

The Magic Valley and the Treasure Valley
The industry reports used here do not list mills by town, and we did not confirm whether any sawmill operates in the six Magic Valley core towns (Jerome, Twin Falls, Kimberly, Gooding, Buhl and Hagerman). Builders in Twin Falls or Jerome buy lumber through yards and distributors that draw from mills across the Northwest and Canada, and concrete from local ready-mix plants. Builders in Boise, Meridian and Nampa do the same at larger volume. Because the producer price indexes are national, a reporter or homeowner in Twin Falls or Meridian reads the same index; local differences show up only in quotes from suppliers, which are private. We did not find a public record of Magic Valley lumber yard prices, and we found no materials cost data published by the Jerome or Twin Falls building departments. Building permit applications do list a project valuation used to set the permit fee, which is covered in lesson 03; that valuation comes from a fee table, not from actual materials invoices.
Materials in the price of a new home
The question everyone asks is "how much of my house is lumber?" The best public answer comes from a trade group's survey, and it does not answer the question precisely.
The NAHB Cost of Constructing a Home survey
The National Association of Home Builders, the home building industry's national trade association, surveys builders periodically on how the price of a typical new single-family home breaks down. Its newest published survey, conducted in the fall of 2024, emailed a questionnaire to 4,000 builders, stratified by builder size and Census region; after outlier review, "usable responses were received from 41 builders."43 NAHB says the survey "is not designed to capture representative characteristics of the average home built during a particular year," that results are national only because the sample is too small for regional breakdowns, and that users should be cautious comparing years.43 It is labeled industry research throughout this course.
| Part of the sales price (2024 survey) | Average dollars | Share of price |
|---|---|---|
| Finished lot (including financing cost) | $91,057 | 13.7% |
| Total construction cost | $428,215 | 64.4% |
| Financing | $10,220 | 1.5% |
| Overhead and general expenses | $38,248 | 5.7% |
| Marketing | $5,633 | 0.8% |
| Sales commission | $18,955 | 2.8% |
| Profit | $72,971 | 11.0% |
| Total sales price | $665,298 | 100.0% |
Source: NAHB, Cost of Constructing a Home 2024, Table 1 (average lot 20,907 square feet; average finished area 2,647 square feet).15 NAHB's economics blog reported that the 64.4 percent construction share was the highest since the series began in 1998, up from 60.8 percent in the 2022 survey, while the lot share fell from 17.8 percent to 13.7 percent, a series low.44
The construction cost of $428,215 breaks into eight stages. NAHB states that "each category includes all the costs paid by a builder that go into a particular item, including labor costs paid directly by the general contractor, the cost of hiring subcontractors, and the cost of materials."43 So "framing, $70,982" means the lumber, trusses, sheathing and the framing crew together.
| Construction stage and selected items (2024 survey) | Average dollars | Share of construction cost |
|---|---|---|
| Site work (permit fees $7,640; impact fee $6,367; water and sewer fees and inspections $6,260; architecture and engineering $6,480; other $5,972) | $32,719 | 7.6% |
| Foundations (excavation, foundation, concrete, retaining walls, backfill $43,002) | $44,748 | 10.5% |
| Framing (framing including roof $49,763; trusses $12,903; sheathing $6,513; general metal and steel $1,718) | $70,982 | 16.6% |
| Exterior finishes (wall finish $24,450; roofing $16,732; windows and doors $15,990) | $57,510 | 13.4% |
| Major systems rough-ins (plumbing $27,180; electrical $27,383; HVAC $26,938) | $82,319 | 19.2% |
| Interior finishes (insulation $6,992; drywall $13,962; cabinets and countertops $19,056; flooring $15,388; other items) | $103,391 | 24.1% |
| Final steps (yard work and plantings $9,269; driveway $9,635; outdoor structures $4,722; clean up $3,183) | $27,710 | 6.5% |
| Other costs | $8,835 | 2.1% |
Source: NAHB, Cost of Constructing a Home 2024, Table 1, section II.45 The fees in site work are the subject of lesson 09 and, for impact fee law, Impact Fees, Urban Renewal and Who Pays.
What the survey can and cannot say about materials
Because each line mixes labor and materials, the NAHB table cannot give a materials share. Some lines are mostly materials (cabinets and countertops, appliances, trusses delivered from a plant), and some are mostly labor (painting, clean up). Any claim that "materials are X percent of a house" needs its own source and method; we did not find a federal statistic that answers it for new single-family homes. The box below shows how far the NAHB numbers can be pushed with clearly stated assumptions.
How we figured it: a hypothetical effect of wood and metal price changes
Hypothetical example. Take the NAHB 2024 average home. Its framing, trusses and sheathing lines total $49,763 + $12,903 + $6,513 = $69,179. Its plumbing and electrical rough-in lines total $27,180 + $27,383 = $54,563.45
Assumption. Suppose, for illustration only, that half of each of those lines is materials. That is an assumption made for this example, not a survey finding. Materials would then be about $34,590 of framing and about $27,282 of plumbing and electrical rough-in.
Apply the index changes from October 2025 to October 2026. Softwood lumber rose 10.6 percent; copper wire and cable rose 25.5 percent.7 If framing materials rose like softwood lumber, $34,590 x 0.106 = about $3,670. If rough-in materials rose like copper wire, $27,282 x 0.255 = about $6,960. Together, about $10,600 on a $665,298 home, or about 1.6 percent of the price.
Limits. This is a hypothetical example to show the arithmetic. Plumbing rough-in includes plastic pipe and fittings that did not rise like copper; builders buy on contracts and quotes that lag the index; the PPI measures producer prices, not delivered prices; and the NAHB survey home is not a typical Idaho home. Change the assumption from half to a third, and every dollar figure falls by a third.46
NAHB has also published estimates of the tariff cost per home in 2025. We were unable to retrieve NAHB's own pages with those estimates when this lesson was checked (the site returned errors), so no NAHB tariff-per-home figure is given here, and that point is listed as unverified.
Idaho compared with the United States and other states
For materials prices, the comparison is short, because the federal data does not break out states. BLS publishes producer price indexes for the nation, not for Idaho, Utah, Washington or any other state. Every builder in the country faces the same Section 232 and AD/CVD rates on the same imported goods, set by federal proclamation and Commerce notice.1612
Where states differ is in what they make and how far materials travel. Idaho produces lumber and ships about 90 percent of its primary wood products out of state, according to the 2016 university report.42 States without large mills or cement and gypsum plants nearby pay more freight on those materials. States that tie building codes to newer energy editions may use more insulation and higher-grade windows per house, a code question covered in lesson 02. None of these differences is measured by a public state-level price index, and we did not find a government series that compares delivered materials prices by state.
For the overall cost of a home in Idaho compared with the nation (price, size, lot size), see lesson 09 and Part A's Idaho vs. the United States.
Pictures, Numbers and Infographics
The key numbers from this lesson in one table. "Idaho" is blank where no Idaho series exists; every price series is national.
| Measure | Idaho | U.S. or other states | Place or year | Source |
|---|---|---|---|---|
| Goods used in residential construction (WPUIP2311001), change Dec. 2019 to Oct. 2026 | No Idaho index | +56.6% (CPI-U +31.3%) | U.S., 2019 to 2026 | 13 |
| Same index, change Oct. 2025 to Oct. 2026 | No Idaho index | +9.8% | U.S., 2025 to 2026 | 7 |
| Softwood lumber PPI peak (WPU0811) | No Idaho index | 581.5 (1982=100) | U.S., May 2021 | 4 |
| Lumber, real change 1979 to 2024 (WPU081 vs. CPI-U) | No Idaho index | about -49% | U.S., 1979 to 2024 | 8 |
| Steel mill products, change Oct. 2025 to Oct. 2026 | No Idaho index | +32.9% | U.S. | 5 |
| Copper wire and cable, change Oct. 2025 to Oct. 2026 | No Idaho index | +25.5% | U.S. | 6 |
| AD/CVD on Canadian softwood lumber, non-selected mills | Same federal rate in Idaho | 24.72% combined (was 35.19%) | Effective Nov. 18, 2026 (previous from Aug. 2025) | 113435 |
| Section 232 duty on softwood lumber | Same federal rate | 10% (U.K. capped at 10%; EU and Japan total capped at 15%) | From Oct. 14, 2025 | 1237 |
| Section 232 duty on kitchen cabinets and vanities | Same federal rate | 25%; scheduled 50% on Jan. 1, 2027 | From Oct. 14, 2025 | 13 |
| Section 232 duty on steel and aluminum | Same federal rate | 50% (U.K. 25%) | From June 4, 2025 | 30 |
| Section 232 duty on semi-finished copper products | Same federal rate | 50% on copper content | From Aug. 1, 2025 | 31 |
| Construction cost share of new home price (NAHB, industry survey, 41 builders) | No Idaho breakdown | 64.4% ($428,215 of $665,298) | U.S., 2024 | 15 |
| Idaho lumber production | about 1.75 billion board feet | Idaho, 2015 estimate | 29 | |
| Share of Idaho primary wood products shipped out of state | about 90% | Idaho, 2015 report | 42 |
The graphics in this lesson: the long-run index chart and the 2019 to 2026 change chart (how much), the duty-layer diagram and the trade timeline (tariffs), the cause map (why), and the NAHB price breakdown (share of a home). The last of these is repeated here in summary form as a quick reference.
Common mistakes
- Reading an index number as a price. A lumber PPI of 275.584 is not $275 per anything; it is a ratio to the 1982 average. Only percent changes between two dates of the same series are meaningful.17
- Comparing a nominal price with an inflation-adjusted one. Lumber up 123 percent since 1979 and lumber down 49 percent since 1979 are both true; the first is nominal and the second is adjusted with the CPI. Mixing the two in one sentence misleads.8
- Using the 2021 peak as the baseline. Saying lumber "fell by half" is true from May 2021, and saying it "rose a quarter" is true from December 2019. Each statement needs its start month.4
- Treating the PPI as the price a builder pays. The PPI measures domestic producers' selling prices. It leaves out freight, yard markups and, for imports, the duties themselves.16
- Assuming an Idaho series exists. There is no Idaho PPI. A story that says "Idaho lumber prices rose X percent" from a BLS index is reporting a national number.16
- Adding the wrong duty rates. Canadian lumber AD/CVD rates differ by company and change after every review. The non-selected rate fell from 35.19 to 24.72 percent between 2025 and November 2026, while a 10 percent Section 232 duty was added in October 2025. Quote the company or category, the review and the effective date.34351112
- Assuming the Supreme Court ended all tariffs. The February 2026 ruling covered IEEPA tariffs only; Section 232 duties on lumber, cabinets and metals and AD/CVD duties on Canadian lumber remained.14
- Reading NAHB's construction cost as materials. The $428,215 construction cost in the 2024 survey includes labor, subcontractors and materials together.43
- Treating the NAHB average home as an Idaho home. The survey is national, based on 41 builders, and NAHB itself warns it is not designed to describe the average home built in a year.43
What we know, what we don't, and what the data can show
What we know
- Goods used in residential construction cost 56.6 percent more in October 2026 than in December 2019 by the BLS index, about 19 percent more after inflation (our calculation).13
- Wood product prices spiked in 2021 and fell back; by October 2026 lumber was roughly where general inflation alone would have put it compared with December 2019.173
- Steel and copper wire prices rose sharply from 2025 into 2026, the same period that 50 percent Section 232 duties on steel, aluminum and semi-finished copper took effect.563031
- Canadian softwood lumber carries AD/CVD deposits (24.72 percent combined for non-selected mills from Nov. 18, 2026) plus a 10 percent Section 232 duty.1112
- Idaho mills ship most of their primary wood products out of state, so Idaho lumber sells at regional and national prices.42
What we don't know
- What Idaho builders actually paid for materials in any month; no public series measures it.
- How much of the 2025 to 2026 rise in each index came from duties as opposed to demand, world commodity prices or costs; the PPI does not separate causes.
- The materials share of a typical new Idaho home; the NAHB survey is national and combines labor with materials.43
- Whether the scheduled Jan. 1, 2027 increases on cabinets and vanities will take effect, be delayed again or be changed by agreements.13
- Current Idaho lumber production and mill capacity; the newest university report we could retrieve covers 2015.29
What the data can show
- BLS PPI series on FRED (IDs in the table above) can show month-by-month national price changes for each material and, with the CPI, inflation-adjusted changes.1
- Federal Register AD/CVD notices can show the rate for any named Canadian company in any review year, and Commerce's later notices show whether deposits were refunded or increased.910
- Presidential proclamations in the Federal Register show Section 232 rates, covered products and effective dates.1213
- The NAHB Cost of Constructing a Home survey (industry research) can show how builders report the split of a home's price, and how that split changed between survey years, with the caveats NAHB states.15
- City building permit records show project valuations used for fees (lesson 03), which can be compared over time but are set by fee tables, not by actual costs.
Questions people ask
Is lumber still expensive?
Compared with May 2021, no: the softwood lumber index in October 2026 (277.612) was less than half its peak (581.5). Compared with December 2019 it was 25.8 percent higher, a little less than the 31.3 percent rise in consumer prices over the same months. Compared with October 2025 it was 10.6 percent higher.437
Which materials rose the most since the pandemic?
Among the series in this lesson, steel mill products (up 113.3 percent from December 2019 to October 2026) and copper wire and cable (up 105.9 percent). Plywood, gypsum and insulation each rose more than 50 percent.3
Do tariffs on Canadian lumber raise the price of U.S. lumber?
Duties raise the cost of the imported lumber directly. Whether and how much U.S. mills raise their own prices in response is an economic question the PPI alone cannot answer, because the index also moves with demand and costs. The duties' purpose under the trade laws is to offset what Commerce finds to be dumping and subsidies; the Section 232 proclamation rests on national security findings.912
Why did concrete never come down?
The ready-mix concrete index has risen in almost every year since 1979, including 2009, when the lumber index fell sharply. It rose 41.6 percent from December 2019 to October 2026 and 2.4 percent in the latest twelve months.253 The index does not say why; concrete is a local product made from cement, sand, gravel and water and delivered by truck, so it does not swing with national lumber demand.
How much do tariffs add to a new home?
No government agency publishes a tariff-per-home figure. NAHB has published estimates, but we could not retrieve them from NAHB for this lesson. The hypothetical example above shows that, under stated assumptions, a year of wood and copper price changes could plausibly add about $10,000 to a $665,000 home, but that example is illustrative and does not isolate tariffs.46 The purchase contract and the records a buyer of new construction can check are covered in lesson 10.
Will cabinet duties go up in 2027?
Under Proclamation 11000, the duty on imported kitchen cabinets and vanities is scheduled to rise from 25 to 50 percent on Jan. 1, 2027, except for countries that reach an agreement with the United States. The date has already been postponed once.13
Where can the latest numbers be checked?
FRED and the BLS PPI pages for the indexes; the Federal Register for AD/CVD notices and proclamations; and the British Columbia government's softwood lumber page, which keeps a running table of current combined rates. The learn-more list at the end of this lesson describes each.11
Hard questions
Do lumber duties protect Idaho mill jobs, or do they raise home prices?
The case for the duties: U.S. producers argue, and Commerce has found in its reviews, that Canadian lumber is sold below fair value and benefits from subsidies; the duties offset that so U.S. mills, including Idaho's, can compete. Idaho's forest products industry had about 11,980 jobs in 2015 with pay well above the state average.91042 The case against: home builders argue that buyers pay more for a basic input that the United States imports in large amounts from Canada. What the evidence shows: the duty rates and their dates are in the record. The PPI shows softwood lumber prices in October 2026 slightly below where general inflation alone would have put them compared with 2019, despite the duties. The record used here does not measure how many Idaho jobs the duties preserve or how much they add to an Idaho house.
Is national security a fair basis for lumber and cabinet duties?
The administration's case: Proclamation 10976 rests on a Commerce finding that imports of timber, lumber and derivative products threaten to impair national security, and Section 232 gives the President authority to act on such a finding.12 The opposing case: lumber and cabinets are consumer goods, much of the supply comes from close allies, and a national-security law should not serve as a general tariff tool. What the evidence shows: the Supreme Court's 2026 ruling limited tariffs under IEEPA, a different law, and did not decide anything about Section 232.14 Whether Section 232 duties on wood products are good policy is a question for Congress and the voters; their legal basis was not overturned as of Nov. 20, 2026.
Are materials the main reason new homes cost more?
One view: materials rose much faster than inflation from 2020 to 2022 and again in 2025 and 2026, and construction cost reached a record 64.4 percent of the NAHB survey home's price in 2024.144 Another view: land, labor, fees and financing also rose, and the NAHB construction cost figure includes labor. What the evidence shows: materials are a large part of the price and a volatile one. The public record does not separate materials from labor in a home's price, so the claim that materials are "the main reason" cannot be tested with the sources here. Lesson 09 covers the other parts.
Do higher materials prices push builders toward lower-quality materials?
One view: when lumber and panels spike, builders look for cheaper substitutes and thinner products to hold prices. Another view: engineered products such as OSB and trusses are tested to standards and permitted by code, and substitutes are not necessarily worse. What the evidence shows: the PPI shows price swings; it does not show what builders bought or how it performed. That debate, and the evidence on durability, is in lesson 07 and lesson 06.
For reporters and advocates
Public records and data that exist.
- BLS producer price indexes (on FRED and bls.gov) for each material, with series IDs in this lesson. Always give the series ID, base period, whether seasonally adjusted, the months compared and that the series is national.1
- Federal Register notices for AD/CVD reviews of Canadian softwood lumber (case numbers A-122-857 and C-122-858), with company rates and effective dates.910
- Presidential proclamations under Section 232 (10947 steel and aluminum, 10962 copper, 10976 and 11000 timber and lumber), in the Federal Register and on whitehouse.gov.30311213
- City building permit files (valuation, plans, inspection records) under the Idaho Public Records Act, Idaho Code Title 74; see Idaho Public Records Requests and lesson 12.
- Public bid tabulations for city, county and school district construction projects, which show materials and unit prices bid by contractors on public work; these can be requested from the public body that took the bids.
Questions to ask. Builders: which materials changed your costs most in the last year, and can you show the supplier invoices or quotes? Lumber yards and distributors in Twin Falls, Jerome, Boise or Nampa: how do your prices track the national index, and how much is freight? Mills: what share of your output stays in Idaho? City building officials: has the valuation table used for permit fees changed, and when?
Fairness. Present the duties with each side's stated reason: Commerce's dumping and subsidy findings and the President's national-security finding on one side, and builders' and buyers' cost concerns on the other. Do not attribute a builder's price increase to tariffs without the builder's own explanation or records.
The Magic Valley angle. Magic Valley builders buy the same nationally priced lumber and metals as Treasure Valley builders, often in smaller volumes and with longer freight. A story can compare quotes from yards in Twin Falls and in the Boise area for the same materials list on the same day (with permission to publish), and set them against the national PPI for the same month. Explain that any difference is a snapshot, not a trend.
Where to go next
- FRED, Federal Reserve Bank of St. Louis: Free public database with every BLS PPI and CPI series used in this lesson. Search by series ID (for example WPU0811), view a chart, and download a CSV of every month. No account needed.
- BLS Producer Price Index home page: The source agency's page for the PPI, with monthly news releases, detailed tables and methods. Free. Useful for checking the newest month and BLS's own descriptions of each index.
- Federal Register: The official daily publication of federal notices and proclamations. Free. Search 'softwood lumber from Canada' for AD/CVD notices or 'Section 232' for proclamations, and note the citation and effective date.
- British Columbia government: Softwood Lumber Trade Dispute: A Canadian provincial government page that keeps a running table of current U.S. duty rates on Canadian lumber by company. Free. Useful as a quick reference; confirm rates in the Federal Register.
- International Trade Administration, Enforcement and Compliance: The Commerce Department office that runs AD/CVD cases. Free. Explains how investigations and administrative reviews work and links to case documents.
- NAHB Cost of Constructing a Home 2024: Industry trade association survey report (PDF, free) breaking down the average price of a new home by part and construction stage. National averages from 41 builders; read its caveats section.
- University of Idaho Policy Analysis Group: University research group that has published reports on Idaho's forest products industry and timber harvest. Free reports; check dates, since some editions are years old.
Still being checked (15 items)
These points could not be fully confirmed against a primary source when this lesson was written and fact checked in November 2026. The text above states each one as uncertain.
- We did not find a BLS series titled 'inputs to residential construction less energy' on FRED; the lesson uses WPUIP2311001, 'Net Inputs to Residential Construction, Goods'.
- We did not find an OSB-only PPI series on FRED; the lesson uses the reconstituted wood product manufacturing industry index (PCU321219321219), which includes OSB among other products.
- BLS's schedule for revising recent PPI months was not confirmed from a BLS page for this lesson; October 2026 values may change.
- The amended seventh-review rates effective Nov. 18, 2026 (CVD 14.08 percent non-selected; Canfor, West Fraser and Resolute combined rates) come from the British Columbia government's table; the amended Federal Register notice itself was not read.
- The date of the original 2017 to 2018 AD/CVD orders on Canadian softwood lumber was not confirmed and is not stated.
- A June 2026 proclamation on aluminum and steel imports is listed on whitehouse.gov; we could not open it and do not describe its contents.
- Whether the Section 232 copper annex covers building wire was not confirmed (the annex is printed as images).
- The Section 122 surcharge rate actually imposed after the Feb. 20, 2026 ruling, and whether it was extended, were not confirmed.
- Whether any proclamation after Proclamation 11000 changed the Jan. 1, 2027 cabinet and vanity increase was not found as of Nov. 20, 2026.
- NAHB's 2025 and 2026 estimates of tariff costs per home could not be retrieved from NAHB (site errors) and are not stated.
- Mountain pine beetle, wildfire and British Columbia mill closure effects on lumber supply are described only as commonly cited causes; no primary Canadian report was read.
- Peak lumber futures prices in 2021 were not confirmed from an exchange record and are not stated.
- Current (post-2015) Idaho lumber production, mill counts and capacity were not confirmed; newer University of Idaho reports could not be downloaded.
- Whether any sawmill operates in the six Magic Valley core towns was not confirmed.
- USMCA dispute panel decisions on Canadian lumber were not reviewed.
Last verified November 21, 2026. General education, not legal, tax, financial or real estate advice; every figure names its source and year in the Notes and Sources below. Data is revised: check the newest release before relying on any number.
Notes
- U.S. Bureau of Labor Statistics, Producer Price Index, Inputs to Industries: Net Inputs to Residential Construction, Goods, series WPUIP2311001, index June 1986=100, monthly, not seasonally adjusted, national; retrieved from Federal Reserve Bank of St. Louis FRED (read Nov. 20, 2026). Read it online. ↩
- U.S. Bureau of Labor Statistics, Consumer Price Index for All Urban Consumers (CPI-U), all items, U.S. city average, series CUUR0000SA0 (FRED ID CPIAUCNS), index 1982 to 1984=100, not seasonally adjusted; the FRED file has no value for October 2025 (read Nov. 20, 2026). Read it online. ↩
- Our calculation: percent change = (October 2026 value / December 2019 value) minus 1; real change divides that ratio by the CPI-U ratio for the same months (337.511 / 256.974 = 1.3134). Values from the BLS series cited in this lesson via FRED (read Nov. 20, 2026). Read it online. ↩
- U.S. Bureau of Labor Statistics, Producer Price Index, Lumber and Wood Products: Softwood Lumber, series WPU0811, index 1982=100, monthly, not seasonally adjusted, national; retrieved from Federal Reserve Bank of St. Louis FRED (read Nov. 20, 2026). Read it online. ↩
- U.S. Bureau of Labor Statistics, Producer Price Index, Metals and Metal Products: Steel Mill Products, series WPU1017, index 1982=100, monthly, not seasonally adjusted, national; retrieved from Federal Reserve Bank of St. Louis FRED (read Nov. 20, 2026). Read it online. ↩
- U.S. Bureau of Labor Statistics, Producer Price Index, Metals and Metal Products: Copper Wire and Cable, series WPU10260314, index Dec. 1986=100, monthly, not seasonally adjusted, national; retrieved from Federal Reserve Bank of St. Louis FRED; the series has no value for July 2020 (read Nov. 20, 2026). Read it online. ↩
- Our calculation: percent change from the October 2025 value to the October 2026 value (and January 2025 to October 2026 where stated) of each BLS series cited, via FRED (read Nov. 20, 2026). October 2026 values were the newest published and may be revised. Read it online. ↩
- Our calculation: annual averages of monthly values for 1979 and 2024 of each BLS PPI series and of the CPI-U (72.575 and 313.689); real change = (2024 average / 1979 average) / 4.3223, minus 1. See the methods box in this lesson. Data via FRED (read Nov. 20, 2026). Read it online. ↩
- U.S. Department of Commerce, International Trade Administration, Certain Softwood Lumber Products From Canada: Final Results of Antidumping Duty Administrative Review, Partial Rescission of Administrative Review, and Final Determination of No Shipments; 2024, case A-122-857, FR Doc. 2026-21296, signed Oct. 13, 2026, published Oct. 19, 2026 (period Jan. 1 to Dec. 31, 2024: Canfor 17.00%, Resolute 13.13%, West Fraser 4.71%, non-selected 10.64%) (read Nov. 20, 2026). Read it online. ↩
- U.S. Department of Commerce, International Trade Administration, Certain Softwood Lumber Products From Canada: Final Results of Countervailing Duty Administrative Review; 2024, case C-122-858, FR Doc. 2026-21286, signed Oct. 13, 2026, published Oct. 19, 2026 (Resolute 12.42%, West Fraser 15.31%, non-selected 14.11%) (read Nov. 20, 2026). Read it online. ↩
- Government of British Columbia, Ministry of Forests, "Softwood Lumber Trade Dispute" web page, table of current duty rates (AR7 amended final, effective Nov. 18, 2026: Canfor 17.00% AD + 14.08% CVD = 31.08%; West Fraser 4.71% + 15.31% = 20.02%; Resolute 13.13% + 12.35% = 25.48%; all others 10.64% + 14.08% = 24.72%). A foreign government's summary of U.S. rates; the amended Federal Register notice itself was not read for this lesson (read Nov. 20, 2026). Read it online. ↩
- Proclamation 10976 of Sept. 29, 2025, Adjusting Imports of Timber, Lumber, and Their Derivative Products Into the United States, 90 FR 48127 (Oct. 6, 2025): 10 percent on softwood timber and lumber; 25 percent on upholstered wooden products and on kitchen cabinets and vanities; effective 12:01 a.m. EDT Oct. 14, 2025 (read Nov. 20, 2026). Read it online. ↩
- Proclamation 11000 of Dec. 31, 2025, Amendments to Adjusting Imports of Timber, Lumber, and Their Derivative Products Into the United States, 91 FR 1039 (Jan. 9, 2026), moving the increases to 30 and 50 percent to Jan. 1, 2027 (read Nov. 20, 2026). Read it online. ↩
- Congressional Research Service, Legal Sidebar LSB11398, Supreme Court Rules Against Tariffs Imposed Under the International Emergency Economic Powers Act (IEEPA), Feb. 23, 2026, on Learning Resources, Inc. v. Trump and Trump v. V.O.S. Selections, Inc., No. 24-1287 (U.S. Feb. 20, 2026) (read Nov. 20, 2026). Read it online. ↩
- National Association of Home Builders (industry trade association), Eric Lynch, Cost of Constructing a Home 2024, Jan. 20, 2025, Table 1, section I, sale price breakdown (industry survey) (read Nov. 20, 2026). Read it online. ↩
- U.S. Bureau of Labor Statistics, "Producer Price Indexes: Overview" page, definition of the PPI and research in progress on net inputs to industry indexes including imports (read Nov. 20, 2026). Read it online. ↩
- U.S. Bureau of Labor Statistics, Producer Price Index, Lumber and Wood Products: Lumber, series WPU081, index 1982=100, monthly, not seasonally adjusted, national; retrieved from Federal Reserve Bank of St. Louis FRED (read Nov. 20, 2026). Read it online. ↩
- U.S. Bureau of Labor Statistics, Producer Price Index, Inputs to Industries: Net Inputs to Single Family Residential Construction, Goods, series WPUIP2311101, index Dec. 2014=100, monthly, not seasonally adjusted, national; retrieved from Federal Reserve Bank of St. Louis FRED (read Nov. 20, 2026). Read it online. ↩
- U.S. Bureau of Labor Statistics, Producer Price Index, Inputs to Industries: Net Inputs to Single Family Residential Construction, Services, series WPUIP2311102, index Dec. 2014=100, monthly, not seasonally adjusted, national; retrieved from Federal Reserve Bank of St. Louis FRED (read Nov. 20, 2026). Read it online. ↩
- U.S. Bureau of Labor Statistics, Producer Price Index, Special Indexes: Construction Materials, series WPUSI012011, index 1982=100, monthly, not seasonally adjusted, national; retrieved from Federal Reserve Bank of St. Louis FRED (read Nov. 20, 2026). Read it online. ↩
- U.S. Bureau of Labor Statistics, Producer Price Index, Lumber and Wood Products: Hardwood Lumber, series WPU0812, index 1982=100, monthly, not seasonally adjusted, national; retrieved from Federal Reserve Bank of St. Louis FRED (read Nov. 20, 2026). Read it online. ↩
- U.S. Bureau of Labor Statistics, Producer Price Index, Lumber and Wood Products: Plywood, series WPU083, index 1982=100, monthly, not seasonally adjusted, national; retrieved from Federal Reserve Bank of St. Louis FRED (read Nov. 20, 2026). Read it online. ↩
- U.S. Bureau of Labor Statistics, Producer Price Index by Industry, Reconstituted Wood Product Manufacturing, series PCU321219321219, index June 1991=100, not seasonally adjusted, national; retrieved from FRED (read Nov. 20, 2026). Read it online. ↩
- U.S. Bureau of Labor Statistics, Producer Price Index, Nonmetallic Mineral Products: Gypsum Products, series WPU137, index 1982=100, monthly, not seasonally adjusted, national; retrieved from Federal Reserve Bank of St. Louis FRED (read Nov. 20, 2026). Read it online. ↩
- U.S. Bureau of Labor Statistics, Producer Price Index, Nonmetallic Mineral Products: Ready-Mix Concrete, series WPU1333, index 1982=100, monthly, not seasonally adjusted, national; retrieved from Federal Reserve Bank of St. Louis FRED (read Nov. 20, 2026). Read it online. ↩
- U.S. Bureau of Labor Statistics, Producer Price Index, Metals and Metal Products: Nonferrous Wire and Cable, series WPU1026, index 1982=100, monthly, not seasonally adjusted, national; retrieved from Federal Reserve Bank of St. Louis FRED (read Nov. 20, 2026). Read it online. ↩
- U.S. Bureau of Labor Statistics, Producer Price Index, Nonmetallic Mineral Products: Insulation Materials, series WPU1392, index 1982=100, monthly, not seasonally adjusted, national; retrieved from Federal Reserve Bank of St. Louis FRED (read Nov. 20, 2026). Read it online. ↩
- Our calculation: highest and lowest monthly values in the stated windows from the BLS series cited, via FRED (read Nov. 20, 2026); percent changes between named months. Read it online. ↩
- Philip S. Cook, Todd A. Morgan and others, Idaho's Forest Products Industry: Current Conditions and 2016 Forecast, Station Bulletin 103, University of Idaho College of Natural Resources and University of Montana Bureau of Business and Economic Research, January 2016, pp. 2 to 3 (lumber production, capacity utilization) (read Nov. 20, 2026). Read it online. ↩
- Proclamation 10947 of June 3, 2025, Adjusting Imports of Aluminum and Steel Into the United States, 90 FR 24199 (June 9, 2025): 50 percent effective 12:01 a.m. EDT June 4, 2025; United Kingdom 25 percent (read Nov. 20, 2026). Read it online. ↩
- Proclamation 10962 of July 30, 2025, Adjusting Imports of Copper Into the United States, 90 FR 37727 (Aug. 5, 2025): 50 percent on semi-finished copper products and intensive copper derivative products, effective 12:01 a.m. EDT Aug. 1, 2025, on copper content (read Nov. 20, 2026). Read it online. ↩
- Same notice, FR Doc. 2026-21296, cash deposit requirements: deposits apply to entries on or after the publication date of the final results; producers and exporters without their own rate pay the 6.04 percent all-others rate from the original investigation (read Nov. 20, 2026). Read it online. ↩
- Government of British Columbia, "Softwood Lumber Trade Dispute" page, history section (agreement expiry Oct. 12, 2015; petition Nov. 25, 2016; ITC vote Nov. 30, 2023) (read Nov. 20, 2026). Read it online. ↩
- U.S. Department of Commerce, Certain Softwood Lumber Products From Canada: Final Results of Antidumping Duty Administrative Review; 2023, 90 FR 35666 (July 29, 2025), signed July 24, 2025 (Canfor 35.53%, West Fraser 9.65%, non-selected 20.56%) (read Nov. 20, 2026). Read it online. ↩
- U.S. Department of Commerce, Certain Softwood Lumber Products From Canada: Final Results of Countervailing Duty Administrative Review; 2023, 90 FR 38755 (Aug. 12, 2025), signed Aug. 7, 2025 (Canfor 12.12%, West Fraser 16.82%, non-selected 14.63%) (read Nov. 20, 2026). Read it online. ↩
- Same notice, FR Doc. 2026-21286: all other producers and exporters continue to pay the 14.19 percent all-others rate from the original investigation (read Nov. 20, 2026). Read it online. ↩
- Proclamation 10976, 90 FR 48127, clauses on the United Kingdom (not to exceed 10 percent) and the European Union and Japan (duty plus column 1 rate not to exceed 15 percent), and the statement that duties are in addition to other duties (read Nov. 20, 2026). Read it online. ↩
- Proclamation 10962, 90 FR 37727, clause on refined copper: update due by June 30, 2026 on a possible phased duty of 15 percent from Jan. 1, 2027 and 30 percent from Jan. 1, 2028 (read Nov. 20, 2026). Read it online. ↩
- Congressional Research Service, LSB11398 (Feb. 23, 2026), discussion of Section 122 of the Trade Act of 1974 (surcharge capped at 15 percent and 150 days) and the President's use of it after the ruling (read Nov. 20, 2026). Read it online. ↩
- Same report, Station Bulletin 103 (January 2016), Outlook for 2016 (housing starts, mortgage rates, Canadian lumber after the agreement expired) (read Nov. 20, 2026). Read it online. ↩
- Todd A. Morgan, Jay O'Laughlin and others, Idaho's Forest Products Industry: Current Conditions and 2014 Forecast, Station Bulletin 101, University of Montana Bureau of Business and Economic Research with the University of Idaho College of Natural Resources, funded by the Idaho Forest Products Commission, January 2014 (read Nov. 20, 2026). Read it online. ↩
- Same report, Station Bulletin 103 (January 2016), sales, exports out of state, employment, earnings and harvest by ownership for 2015 (read Nov. 20, 2026). Read it online. ↩
- NAHB, Cost of Constructing a Home 2024 (Jan. 20, 2025), Introduction, Caveats and Methodology sections: questionnaire to 4,000 builders, 41 usable responses, national averages only, categories include labor, subcontractors and materials (industry survey) (read Nov. 20, 2026). Read it online. ↩
- Eric Lynch, "Cost of Constructing a Home in 2024," NAHB Eye on Housing blog, Jan. 23, 2025 (construction share 64.4% vs. 60.8% in 2022; lot share 13.7% vs. 17.8%; series since 1998) (industry research) (read Nov. 20, 2026). Read it online. ↩
- NAHB, Cost of Constructing a Home 2024, Table 1, section II, construction cost breakdown by stage and item (industry survey) (read Nov. 20, 2026). Read it online. ↩
- Our calculation, hypothetical example: NAHB 2024 Table 1 line items, an assumed 50 percent materials share, and the October 2025 to October 2026 changes in BLS series WPU0811 and WPU10260314 (read Nov. 20, 2026). Read it online. ↩
Check yourself
1. What does the BLS producer price index for softwood lumber (WPU0811) measure?
BLS says the PPI measures the average change over time in selling prices received by domestic producers; WPU0811 is an index with 1982=100, national and not seasonally adjusted (BLS PPI overview; FRED series WPU0811).
2. From December 2019 to October 2026, the BLS index for goods used in residential construction (WPUIP2311001) rose about how much?
The index went from 226.7 to 355.005, a 56.6 percent rise (our calculation from BLS data via FRED). The CPI-U rose 31.3 percent; steel mill products rose 113.3 percent.
3. Adjusted for consumer price inflation, how did the lumber index (WPU081) change from the 1979 average to the 2024 average?
Nominal lumber rose 123 percent (114.0 to 253.7) while the CPI-U rose by a factor of 4.3223, so the real change was about -49 percent (our calculation, methods box).
4. In which month did the softwood lumber index reach its pandemic-era peak of 581.5?
FRED series WPU0811 shows 581.5 in May 2021, up from 212.3 in April 2020, then 273.9 by September 2021.
5. After the amended seventh administrative reviews effective Nov. 18, 2026, what is the combined AD/CVD rate for non-selected Canadian softwood lumber producers?
The British Columbia government's table lists 10.64 percent AD plus 14.08 percent CVD, 24.72 percent, effective Nov. 18, 2026. The 35.19 percent figure was the sixth-review rate (90 FR 35666 and 90 FR 38755).
6. What Section 232 duty did Proclamation 10976 put on softwood timber and lumber, and when did it take effect?
Proclamation 10976 (90 FR 48127) set 10 percent on softwood timber and lumber effective 12:01 a.m. EDT Oct. 14, 2025.
7. What did Proclamation 11000 (Dec. 31, 2025) do?
Proclamation 11000 (91 FR 1039) states that effective Jan. 1, 2027 the rates increase to 30 and 50 percent, a one-year delay; the 10 percent lumber rate was unchanged.
8. What did the Supreme Court hold in Learning Resources, Inc. v. Trump (Feb. 20, 2026)?
The Court held 6 to 3 that IEEPA does not give the President authority to impose tariffs; it did not address Section 232 or Section 301 (CRS Legal Sidebar LSB11398).
9. In NAHB's Cost of Constructing a Home 2024 survey, what share of the average sales price was construction cost?
NAHB Table 1: construction cost $428,215, 64.4 percent of the $665,298 average price; 41 builders responded, and the figure includes labor and materials together (industry survey).
10. According to the 2016 University of Idaho and University of Montana report, about what share of Idaho's primary wood products were shipped out of state?
Station Bulletin 103 (January 2016) states that about 90 percent of primary wood products and 65 percent of primary paper products are exported out of the state, which is why Idaho lumber sells at regional and national prices.
Terms in this lesson
- Producer price index (PPI)
- A BLS index of the average change over time in selling prices received by domestic producers. It is a ratio to a base period, not a dollar price, and the commodity series used here are national.
- Base period
- The period an index is set to equal 100, for example 1982=100 for the lumber index or June 1986=100 for residential construction inputs.
- Not seasonally adjusted
- Index values as collected, without removing repeating yearly patterns. Suitable for comparing the same month in different years or annual averages.
- Nominal change
- The change in a price or index as recorded at the time, without adjusting for general inflation.
- Real (inflation-adjusted) change
- A change after dividing out the rise in the consumer price index over the same period; it shows whether an item got more or less expensive compared with prices in general.
- CPI-U
- The Consumer Price Index for All Urban Consumers, BLS's main measure of consumer inflation, base 1982 to 1984=100.
- Antidumping (AD) duty
- A duty that offsets imports the Commerce Department finds are sold in the United States below fair value.
- Countervailing (CVD) duty
- A duty that offsets subsidies the Commerce Department finds a foreign government gave its producers.
- Administrative review
- Commerce's yearly look back at one calendar year of imports under an AD or CVD order, which sets final duties for that year and new cash deposit rates for later imports.
- Non-selected rate
- The AD or CVD rate assigned to companies under review that Commerce did not examine individually, based on the rates of the companies it did examine.
- Section 232
- Section 232 of the Trade Expansion Act of 1962, which lets the President adjust imports that Commerce finds threaten to impair national security. Used in 2025 for lumber, cabinets, steel, aluminum and copper.
- IEEPA
- The International Emergency Economic Powers Act. The Supreme Court held on Feb. 20, 2026 that it does not authorize tariffs.
- Board foot
- A unit of lumber volume equal to a board 12 inches by 12 inches by 1 inch, used in mill production and harvest figures.
- Oriented strand board (OSB)
- A structural panel made of wood strands bonded with resin, widely used for wall and roof sheathing; BLS prices it within the reconstituted wood products industry index.
Sources
- BLS PPI: Net Inputs to Residential Construction, Goods (WPUIP2311001), via FRED (2026-11-20) checked 2026-11
- BLS PPI: Softwood Lumber (WPU0811), via FRED (2026-11-20) checked 2026-11
- BLS PPI: Steel Mill Products (WPU1017), via FRED (2026-11-20) checked 2026-11
- BLS PPI: Copper Wire and Cable (WPU10260314), via FRED (2026-11-20) checked 2026-11
- BLS CPI-U all items (CPIAUCNS), via FRED (2026-11-20) checked 2026-11
- BLS, Producer Price Indexes overview (2026-11-20) checked 2026-11
- Commerce, softwood lumber from Canada, AD final results 2024 review (FR Doc. 2026-21296) (2026-11-20) checked 2026-11
- Commerce, softwood lumber from Canada, CVD final results 2024 review (FR Doc. 2026-21286) (2026-11-20) checked 2026-11
- Commerce, softwood lumber from Canada, AD final results 2023 review, 90 FR 35666 (2026-11-20) checked 2026-11
- Proclamation 10976, timber and lumber, 90 FR 48127 (2026-11-20) checked 2026-11
- Proclamation 11000, timber and lumber amendments, 91 FR 1039 (2026-11-20) checked 2026-11
- Proclamation 10962, copper, 90 FR 37727 (2026-11-20) checked 2026-11
- Proclamation 10947, aluminum and steel, 90 FR 24199 (2026-11-20) checked 2026-11
- Congressional Research Service, LSB11398, Supreme Court ruling on IEEPA tariffs (2026-11-20) checked 2026-11
- University of Idaho and University of Montana, Idaho's Forest Products Industry: Current Conditions and 2016 Forecast (2026-11-20) checked 2026-11