Lesson 1 of 12 · about 55 minutes · Updated November 20, 2026
Homeownership in Idaho, 1900 to 2026
You'll be able to
- Define the homeownership rate and explain why the census, the Housing Vacancy Survey and the American Community Survey report different numbers
- Describe Idaho's homeownership trend from 1900 to 2025 and how it compares with the United States and neighboring states
- Identify the federal and Idaho laws that shaped home buying, from the National Housing Act of 1934 to Public Law 119-21 of 2025
- Compare ownership rates by age, income, race and Hispanic origin in Idaho and the nation
- Read county and town ownership rates with their margins of error, including Jerome, Twin Falls and Gooding counties
- Explain how mortgage rates, prices and incomes changed the cost of buying from 2019 to 2025
Start here: the short version
- Idaho has out-owned the nation for 125 years. In the 1900 census, 71.6 percent of Idaho's occupied homes were lived in by their owners, against 46.5 percent nationally. By 2000 the figures were 72.4 and 66.2 percent. Idaho's low point was 57.0 percent in 1930.1
- The newest large survey puts Idaho at 71.1 percent. The American Community Survey (ACS) counted 544,227 owner households among Idaho's 765,200 occupied homes in 2025, against 65.3 percent for the United States. That ranked Idaho 11th of the 50 states and the District of Columbia (our calculation).2
- The 68.3 percent figure is real but shaky. The Census Bureau's Housing Vacancy Survey (HVS) put Idaho at 68.3 percent for 2025, down from 71.6 percent in 2024. Its Idaho sample is small, October 2025 was never collected because of the federal funding lapse, and the 2023 to 2025 average is 70.3 percent (our calculation).3
- Young Idahoans own more than young Americans, but far less than their parents. In 2025, 40.5 percent of Idaho householders under 35 owned their homes, against 34.5 percent nationally; for householders 65 and over the Idaho rate was 85.2 percent.4
- Gaps by ethnicity are smaller in Idaho than nationally but still about 15 points. In the 2020 to 2024 ACS, 74.5 percent of white non-Hispanic Idaho householders owned, against 59.7 percent of Hispanic householders.5
- The squeeze is about payments. On a hypothetical 10 percent down loan, principal and interest on Idaho's median home took about 21 percent of the median household's income in 2019 and about 38 percent in 2025, as the median value rose from $255,200 to $457,800 and the average 30-year rate rose from 3.94 to 6.60 percent (our calculation).67
- First-time buyers are older and fewer nationally. The National Association of Realtors (an industry group) reported Nov. 5, 2026, that first-time buyers made up 22 percent of purchases from July 2025 to June 2026, with a median age of 40.8
Data: decennial census 1900 to 2020; Census Housing Vacancy Survey annual statistics through 2025 (released March 24, 2026) and quarterly state rates through the third quarter of 2026 (released Oct. 28, 2026); American Community Survey 1-year estimates for 2025 and 5-year estimates for 2020 to 2024; Freddie Mac weekly mortgage rates through Nov. 19, 2026; federal statutes as published in the U.S. Code and Public Law 119-21; Idaho Code as amended through the 2026 regular session. Checked Nov. 20, 2026. Survey figures are revised and new releases come every year; check the newest table.
The homeownership rate is one of the oldest numbers the federal government keeps about American households. The Census Bureau's historical tables of the owner-or-renter question begin with the 1900 census, ten years after Idaho became a state, and they show a state where owning has been the normal way to live for as long as anyone has counted: about seven in ten households for most of 125 years, and well above the national share in every census.1
That steady rate hides a lot of change. The share of Idaho households that owned fell by nearly 15 points between 1900 and 1930, climbed again after World War II, peaked in the survey data around 2009, sagged after the mortgage crisis, and has held near 71 percent in the 2020s even as the median home value rose by about four-fifths from 2019 to 2025. Underneath the statewide figure, ownership varies sharply by age, income, ethnicity and county. This lesson walks through the numbers from 1900 to 2026, the federal and state laws that shaped them, the three Census sources that measure them and why they disagree, and how Idaho compares with the nation and its neighbors.
It is the first lesson of Part D, the affordable housing course. Lesson 02, What "Low Income" and "Affordable" Mean, defines the income terms used throughout. The programs that help people buy are in lesson 09, First-Time Buyer Assistance, and their problems in lesson 10, The Problems With Buyer Assistance. Manufactured homes, a large share of owner housing in rural Idaho, are covered in lesson 11, Manufactured Homes as Affordable Ownership. Price, rent and income trends since 1979 are in Part A, Prices and Rents vs. Inflation, and the state-by-state scorecard in Idaho vs. the United States. This lesson does not repeat those; it links to them.

How homeownership is measured
The homeownership rate is the number of occupied homes lived in by their owners divided by all occupied homes. The Census Bureau's word for the owner-or-renter question is tenure. A home counts as owned if the owner or co-owner lives in it, whether it is paid off or carries a mortgage; everyone else, including people who live rent-free, counts as a renter. The denominator is households (occupied housing units), not people and not all housing units, so vacant homes, second homes and short-term rentals do not enter the rate at all.910
That definition has consequences. A rate of 71 percent means 71 percent of households, not 71 percent of Idahoans: a married couple and their three children who own count as one owner household, the same as a widow living alone. Adult children living with parents are not households, so a son who would like to rent his own place but cannot is invisible in the rate. If young people double up instead of forming their own households, the homeownership rate can rise even while fewer young adults own.10
Three Census sources, three different numbers
Three Census Bureau sources report Idaho's rate, and they never match exactly.
- The decennial census counts every occupied home once every ten years. It is the anchor: no sampling error, but a decade between readings. The Bureau's Historical Census of Housing Tables give every state's rate from 1900 to 2000; the 2010 Census (table H4) and the 2020 Census Demographic and Housing Characteristics file (DHC, table H4) give the two newer counts. In 2010, 404,903 of Idaho's 579,408 occupied homes were owner-occupied (69.9 percent); in 2020, 476,263 of 676,206 (70.4 percent), our calculations from the published counts.1910
- The Housing Vacancy Survey (HVS) is a supplement to the monthly Current Population Survey. It produces the national rate every quarter and annual state rates going back to 1984. The whole national sample is about 72,000 housing units a month, so each state's sample is small, and the Bureau publishes margins of error of roughly 3 percentage points for Idaho's quarterly figures.31112
- The American Community Survey (ACS) is a much larger survey mailed to addresses every month of the year; it publishes 1-year estimates for states and large places and 5-year estimates down to small towns. It is the best source for counties, cities, age, income and race. Its 2025 Idaho estimate was 71.1 percent, with a margin of error of plus or minus 8,165 on the owner count.213
The sources measure the same thing differently. The HVS and the ACS ask different questions, use different weighting and sample at different times of year. The decennial census in 2020 reported an unusually low national rate of 63.1 percent, below both the 2019 ACS (64.1 percent) and the 2020 HVS (66.6 percent); the Census Bureau has offered only partial explanations. Its 2020 Census brief on housing characteristics (September 2023) reports the 63.1 percent figure, the lowest national census rate since 1970, and warns that census and survey results can differ noticeably, partly because the census records a home's status as of April 1 while a survey records it when the interviewer makes contact. A Bureau working paper dated Feb. 18, 2021, found that changes in which households answered the HVS after in-person interviews stopped in March 2020 "likely contributed to the historically large increase in the homeownership rate" that year. We found no Bureau study that fully reconciles the three 2020 figures and list that under unverified. The safest practice is to compare like with like: census with census, ACS with ACS, HVS with HVS.101434243
How we figured it: homeownership rates
Where the Census Bureau publishes a rate (Historical Census tables 1900 to 2000 and HVS annual Table 15), we quote it. Where it publishes counts, we divide owner-occupied units by all occupied units and round to one decimal. Examples: 2020 Census DHC table H4 for Idaho: owned with a mortgage 324,717 plus owned free and clear 151,546 equals 476,263 owners; divided by 676,206 occupied units equals 70.4 percent. ACS 2025 1-year table B25003: 544,227 divided by 765,200 equals 71.1 percent. State rankings use ACS 2025 1-year B25003 for the 50 states and the District of Columbia. We did not compute margins of error for the ratios; the published owner-count margins appear in the tables. Three-year HVS averages are the plain average of three published annual rates.13210
Reading the margins of error
The HVS quarterly table shows how noisy a state survey can be. Idaho's quarterly rate in 2025 ran 69.3, 66.7, 67.9 and 70.0 percent, each with a margin of error of 3.1 or 3.2 points; in the first three quarters of 2026 it was 70.7, 67.5 and 70.0 percent, with margins of about 3 points. A swing of 3 points from one quarter to the next is within the survey's own stated uncertainty. The fourth quarter of 2025 rests on only November and December data because October was never collected during the federal funding lapse, and the Bureau warns users to note the larger uncertainty.1115
That is why Part A of this series advised averaging three years of HVS data before reporting a change, and why this lesson leans on the census and the ACS for anything below the state level. For the statistics behind margins of error, see the site's Data and Statistics course.
The long trend, 1900 to 2000
The census tables for 1900 to 2000 put Idaho near the top of the country at the start of the century and keep it above the national rate in every one of the eleven counts.1
| Census year | Idaho | United States | Idaho minus U.S. (points) | Idaho change from prior census (points) |
|---|---|---|---|---|
| 1900 | 71.6% | 46.5% | 25.1 | First census after statehood (1890) |
| 1910 | 68.1% | 45.9% | 22.2 | minus 3.5 |
| 1920 | 60.9% | 45.6% | 15.3 | minus 7.2 |
| 1930 | 57.0% | 47.8% | 9.2 | minus 3.9 (Idaho low) |
| 1940 | 57.9% | 43.6% | 14.3 | plus 0.9 (U.S. low) |
| 1950 | 65.5% | 55.0% | 10.5 | plus 7.6 |
| 1960 | 70.5% | 61.9% | 8.6 | plus 5.0 |
| 1970 | 70.1% | 62.9% | 7.2 | minus 0.4 |
| 1980 | 72.0% | 64.4% | 7.6 | plus 1.9 |
| 1990 | 70.1% | 64.2% | 5.9 | minus 1.9 |
| 2000 | 72.4% | 66.2% | 6.2 | plus 2.3 |
| 2010 | 69.9% | 65.1% | 4.8 | minus 2.5 |
| 2020 | 70.4% | 63.1% | 7.3 | plus 0.5 |
Sources: Census Bureau Historical Census of Housing Tables (1900 to 2000); 2010 Census SF1 table H4 and 2020 Census DHC table H4 (owner share, differences and changes are our calculations).1910
The farm and homestead era, 1900 to 1920
In 1900, Idaho's 71.6 percent ownership rate was far above the 46.5 percent national figure. The pattern was regional: the farm states of the northern plains and the interior West led the country. North Dakota recorded the highest rate of any state in any census, 80.0 percent in 1900; South Dakota was at 71.2 percent, Utah 67.8 percent and Nevada 66.2 percent, while New York was at 33.2 percent. The Census Bureau's own summary of the historical tables notes North Dakota's 1900 peak and that Utah's rate never fell below 60 percent.116
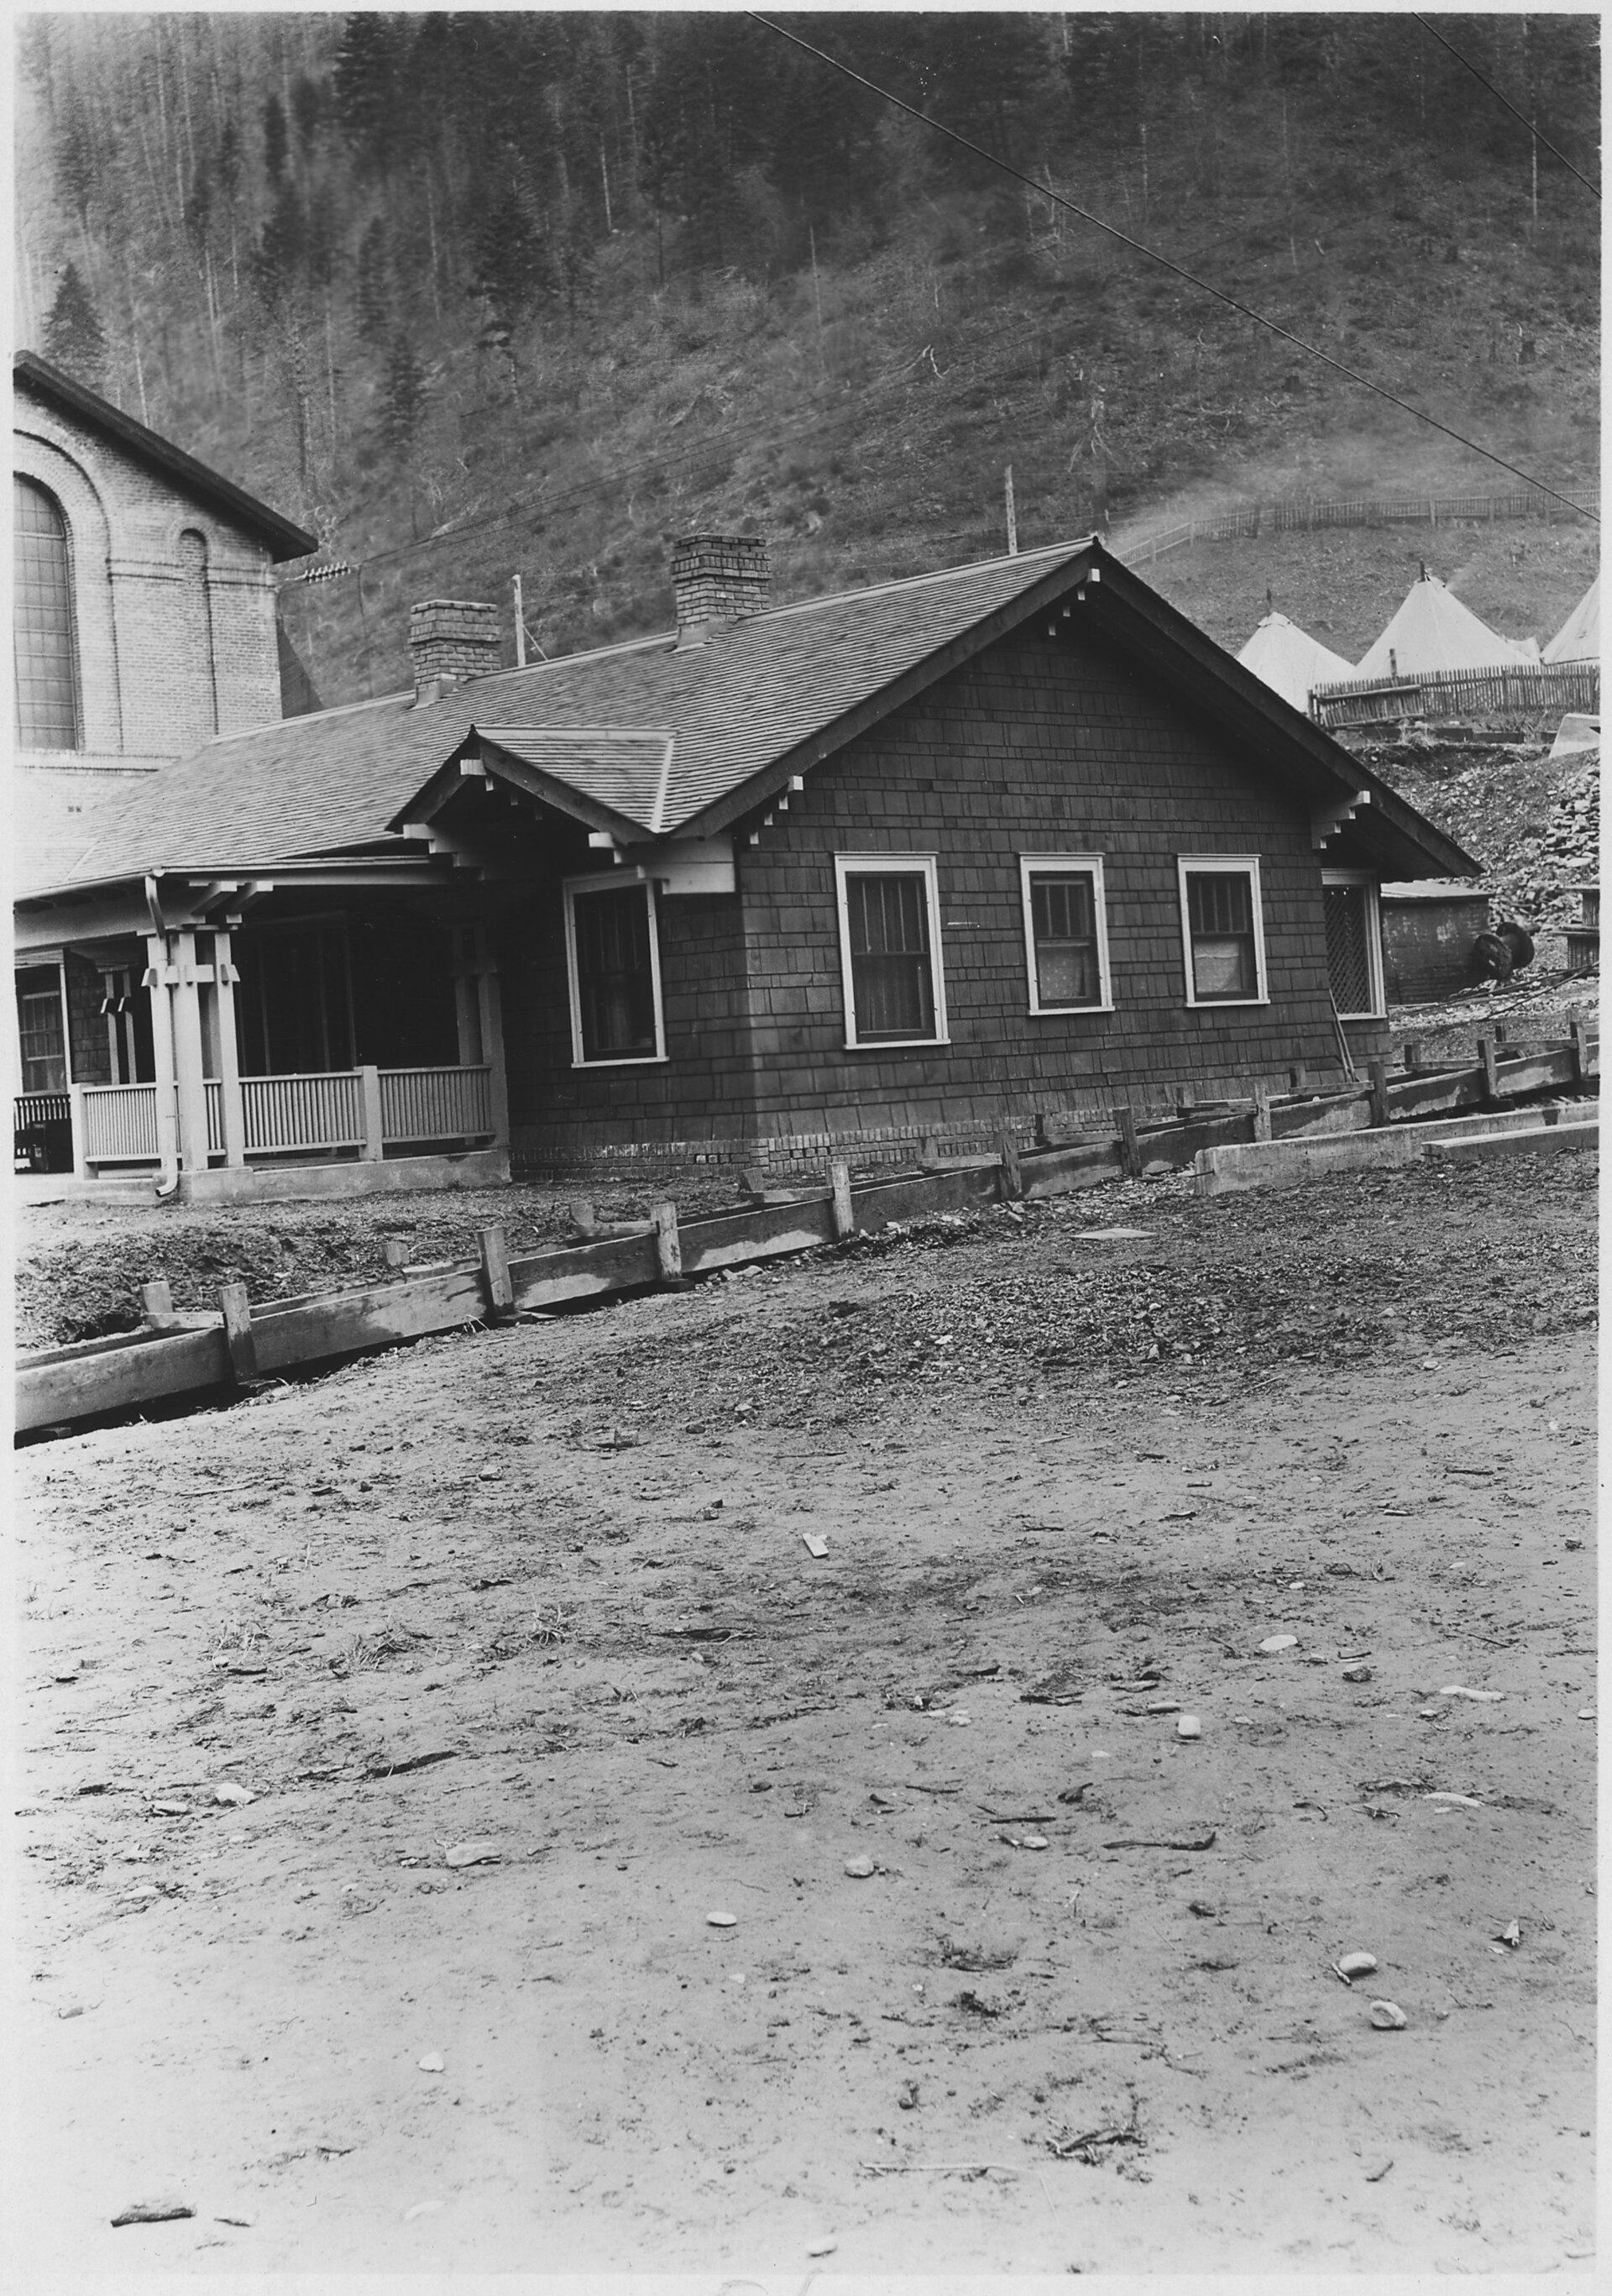
The census tables do not explain why. The pattern lines up with the federal land laws that let settlers claim farms and mining ground, and with the small number of large cities in those states, but the tables themselves report only owners and renters, so any explanation is an inference rather than a census finding. The photograph below, from a National Archives land-claim file, is a reminder that a home in early Idaho was often tied to a land claim that could be lost.

Between 1900 and 1920, Idaho's rate fell from 71.6 to 60.9 percent while the national rate barely moved. The census counts do not say why. One possibility is that newcomers, tenant farmers and workers in mining and timber towns rented while they got established, but we found no census table that separates those groups for Idaho, so that is offered as a possibility, not a finding.1
The Depression low, 1930 and 1940
Idaho reached its lowest recorded rate in 1930, at 57.0 percent, and stayed near it in 1940 at 57.9 percent. Nationally the low came in 1940, at 43.6 percent. The Census Bureau's narrative calls 1940 the lowest level of the century for the nation and attributes the drop to the Great Depression.116
The mortgage system of the time made ownership fragile. HUD's history of the Federal Housing Administration describes pre-1934 home loans limited to 50 percent of a property's market value, repaid over three to five years and ending in a balloon payment, which borrowers had to refinance or pay off in full. When banks failed and could not refinance, owners lost homes. The same HUD page says that before FHA "only 1 in 10 households owned homes," a claim the census tables contradict: the national rate was 47.8 percent in 1930. The section on common mistakes below returns to that line.171
The postwar surge, 1950 to 1970
Both Idaho and the nation rose sharply after World War II. Idaho went from 57.9 percent in 1940 to 65.5 percent in 1950 and 70.5 percent in 1960; the nation went from 43.6 to 55.0 and 61.9 percent. The Census Bureau credits a booming economy, favorable tax laws, a rebuilt home construction industry and easier financing, and says the national rate topped 60 percent within about two decades.116
The financing changes are the subject of the next section. The national gain was much larger than Idaho's because Idaho started from a higher base: by 1960 the gap between Idaho and the nation had narrowed from 25 points in 1900 to under 9.
A high plateau, 1970 to 2000
From 1960 to 2000 Idaho stayed within a band of 70.1 to 72.4 percent in every census. The nation kept climbing slowly, from 61.9 to 66.2 percent, so the gap kept shrinking, to about 6 points by 1990 and 2000. Idaho's 1990 dip to 70.1 percent followed a decade in which, as Part A shows in Idaho Since 1979: The Long View, the state's farm and timber economy slumped and population growth slowed.1
The federal and state laws that shaped ownership
Almost every tool a household uses to buy a home today, from the 30-year fixed mortgage to the down-payment loan, traces to a federal law. Idaho added its own housing finance agency in 1972. The table lists the main laws with their citations; the sections after it explain what each changed. Program rules for buyers today are in lesson 09, First-Time Buyer Assistance.
| Year | Law or event | What changed | Source |
|---|---|---|---|
| 1932 | Federal Home Loan Bank Act (July 22, 1932) | Created a system of regional banks to lend to savings and loan associations that made home loans | 12 U.S.C. 142118 |
| 1933 | Home Owners' Loan Corporation formed | Refinanced home mortgages in default during the Depression | HUD timeline19 |
| 1934 | National Housing Act (June 27, 1934) | Created the Federal Housing Administration (FHA) to insure loans made by approved lenders | 12 U.S.C. 1702; HUD2017 |
| 1938 | Fannie Mae chartered | Federal National Mortgage Association, set up to buy FHA-insured loans from lenders | HUD timeline19 |
| 1944 | Servicemen's Readjustment Act, the GI Bill (June 22, 1944) | Federal guarantee of up to 50 percent of veterans' home, farm and business loans | VA21 |
| 1949 | Housing Act of 1949, Title V (July 15, 1949) | Section 502 rural home loans, now run by USDA Rural Development | 42 U.S.C. 147222 |
| 1965 | Department of Housing and Urban Development created | FHA became part of HUD's Office of Housing | HUD1719 |
| 1968 | Fair Housing Act, Title VIII of the Civil Rights Act (April 11, 1968) | Barred discrimination in the sale, rental and financing of housing | 42 U.S.C. 36012324 |
| 1968 | Fannie Mae privatized; Ginnie Mae created | Fannie Mae became a shareholder-owned company; Ginnie Mae stayed in government | HUD timeline19 |
| 1970 | Federal Home Loan Mortgage Corporation Act (July 24, 1970) | Created Freddie Mac to buy conventional mortgages | 12 U.S.C. 145125 |
| 1972 | Idaho Housing Agency created (Idaho Session Laws 1972, ch. 324) | State agency to finance housing for low-income Idahoans; today the Idaho Housing and Finance Association | Idaho Code 67-620126 |
| 1975 | Home Mortgage Disclosure Act (Dec. 31, 1975) | Lenders must report where they make home loans | 12 U.S.C. 280127 |
| 1977 | Community Reinvestment Act (Oct. 12, 1977) | Bank regulators must encourage banks to meet the credit needs of their whole communities | 12 U.S.C. 290128 |
| 1988 | Fair Housing Amendments Act (Sept. 13, 1988) | Added protections for people with disabilities and families with children | 42 U.S.C. 3601 note; DOJ2324 |
| 2002 | White House Conference on Minority Homeownership (Oct. 15, 2002) | National goal of 5.5 million new minority homeowners by the end of the decade | HUD archives29 |
| 2003 | American Dream Downpayment Act (Dec. 16, 2003) | HUD grants for down-payment aid through HOME participating jurisdictions; authority expired Dec. 31, 2011 | 42 U.S.C. 12821 (omitted)30 |
| 2008 | Housing and Economic Recovery Act (July 30, 2008); conservatorship (Sept. 6, 2008) | Created the Federal Housing Finance Agency, which placed Fannie Mae and Freddie Mac in conservatorship | FHFA31 |
| 2017 | Federal tax law change | Mortgage interest deduction limited to the first $750,000 of debt taken out after Dec. 15, 2017 (was $1 million) | IRS Publication 93632 |
| 2025 | Public Law 119-21, section 70108 (signed July 4, 2025) | Made the $750,000 limit permanent and treats mortgage insurance premiums as deductible interest for tax years after 2025 | Public Law 119-2133 |
The 1930s: rescuing the mortgage
Congress built the modern mortgage system in three years. The Federal Home Loan Bank Act of July 22, 1932, created regional banks to lend to the savings and loans that made most home loans. The Home Owners' Loan Corporation, formed in 1933, refinanced loans in default. The National Housing Act of June 27, 1934, created the Federal Housing Administration, which, in HUD's words, provides "mortgage insurance on loans made by FHA-approved lenders" and pays the lender's claim if the owner defaults. Fannie Mae followed in 1938 to buy insured loans and give lenders money to make more.18192017
The change that mattered most to buyers was the loan itself. Before FHA, HUD says, loans were capped at half the home's value and ran three to five years with a balloon payment at the end. Insured loans could run longer, cover more of the price and be paid off in equal monthly installments, the structure most Idaho mortgages still use. HUD's page does not give the original FHA terms in detail, so this lesson does not state them.17
The GI Bill and rural loans, 1944 and 1949
President Franklin D. Roosevelt signed the Servicemen's Readjustment Act on June 22, 1944. It provided a federal guarantee "not to exceed 50 percent" of loans for homes, farms and businesses, and the Department of Veterans Affairs says it backed nearly 2.4 million home loans for World War II veterans from 1944 to 1952. The VA home loan guaranty still exists; its current terms are in lesson 09.21
The Housing Act of 1949 added Title V, the rural housing loans now known as Section 502, codified at 42 U.S.C. 1472. Under the current statute the Secretary of Agriculture may lend to a rural applicant who can repay with interest, for a term of up to 33 years. Section 502 matters more in Idaho than in most states because so much of the state is rural; whether a given Magic Valley town is in an eligible area is a USDA map question covered in lesson 09.22
Civil rights and lending records, 1968 to 1988
Title VIII of the Civil Rights Act of 1968, signed April 11, 1968, is the Fair Housing Act. The U.S. Department of Justice describes it as prohibiting discrimination by landlords, real estate companies, lenders, homeowners insurance companies and municipalities. The protected classes today are race or color, religion, sex, national origin, familial status and disability; the Fair Housing Amendments Act of Sept. 13, 1988, added the last two. Fair housing complaints and enforcement are covered in lesson 07, and HUD's 2026 withdrawal of some fair housing guidance is noted in Part C.2324
Two later laws put lending on the record. The Home Mortgage Disclosure Act of Dec. 31, 1975, requires lenders to report loan data so the public can "determine whether depository institutions are filling their obligations to serve the housing needs of the communities" where they operate. The Community Reinvestment Act of Oct. 12, 1977, says banks have a "continuing and affirmative obligation to help meet the credit needs of the local communities in which they are chartered," consistent with safe and sound operation, and directs regulators to encourage it in their exams. Mortgage denial rates by race and income in Idaho, drawn from the Home Mortgage Disclosure Act data, are covered in lesson 10.2728
Idaho's own agency, 1972
The Idaho Legislature created the Idaho Housing Agency in 1972 (Session Laws 1972, ch. 324). Its purpose section, Idaho Code 67-6201, still opens with a finding that "there is a shortage of safe or sanitary dwelling accommodations available which persons of low incomes can afford" and that the supply of housing for low-income families must be increased. Amendments in 1974, 1976, 1997, 2000, 2005 and 2007 widened its powers. Today it is the Idaho Housing and Finance Association (IHFA), which sells bonds and makes the first-mortgage and down-payment loans described in lesson 09. Its other roles, as Idaho's housing credit agency and voucher administrator, are in lesson 04, Idaho's Housing Authorities.26
The mortgage interest deduction
Home mortgage interest has been deductible from federal income tax for owners who itemize. The deduction is in 26 U.S.C. 163(h). For loans taken out after Dec. 15, 2017, the deduction covers interest on the first $750,000 of home purchase debt ($375,000 if married filing separately); loans from Oct. 14, 1987, to Dec. 15, 2017, keep the old $1 million limit. The 2017 limit was set to expire after 2025. Public Law 119-21, signed July 4, 2025, removed that end date in section 70108 and, for tax years beginning after Dec. 31, 2025, treats mortgage insurance premiums as deductible interest again. The IRS says the itemized deduction for mortgage insurance premiums had expired before that change.343233
The deduction helps only owners who itemize. How much it matters to Idaho homeownership is not measured in any Idaho data set we found; it is listed under what we don't know.
Boom, bust and recovery, 2000 to 2019
The national push for ownership
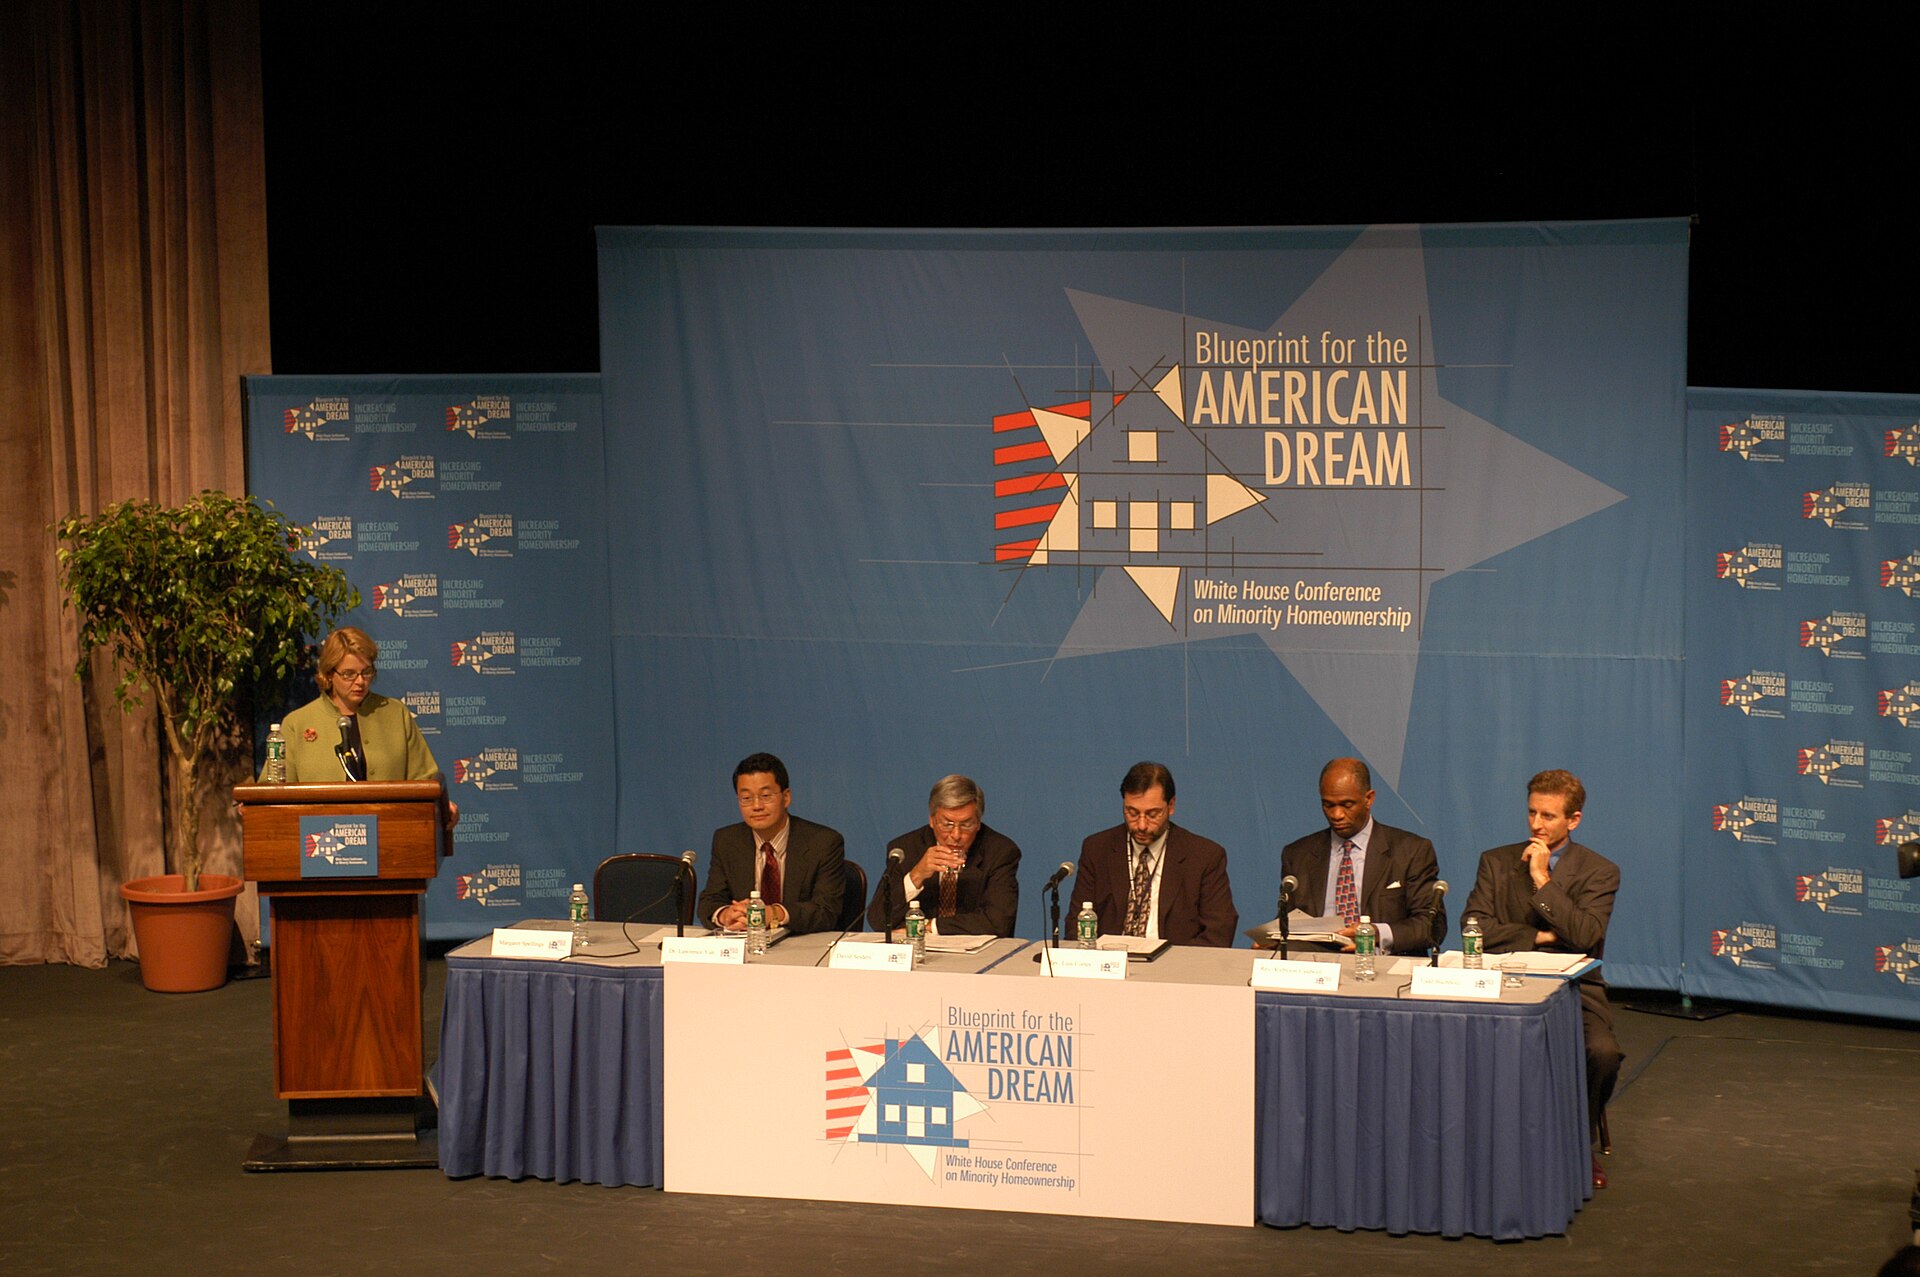
The national homeownership rate reached its all-time quarterly high of 69.2 percent in the second and fourth quarters of 2004, according to the HVS. HUD's timeline describes the 2000s as the decade of a record 69 percent rate in 2004. Federal policy encouraged it: in June 2002 President George W. Bush announced a goal of 5.5 million new minority homeowners by the end of the decade, and HUD held a White House Conference on Minority Homeownership on Oct. 15, 2002. Congress passed the American Dream Downpayment Act in December 2003; its grant authority expired at the end of 2011.15192930

Idaho peaked later than the nation
In the HVS, Idaho's rate climbed from 70.5 percent in 2000 to 74.4 percent in 2003 and stayed between 73.7 and 75.5 percent through 2009; its single highest year was 2009, at 75.5 percent. On a three-year average, Idaho's peak was 75.0 percent for 2007 to 2009, while the nation's peak was 68.9 percent for 2004 to 2006 (our calculations). The national rate was already falling in 2007; Idaho's survey figure did not drop until 2010, when it fell to 72.4 percent.3
Two cautions apply. First, the HVS and the ACS disagree sharply for those years: the ACS put Idaho at 69.6 percent in 2010, nearly 3 points below the HVS's 72.4 percent and close to the 2010 Census count of 69.9 percent. Second, the Idaho sample is small. What the survey can support is that Idaho's ownership rate held up through the late 2000s and then fell during the early 2010s; it cannot pin the peak to a single year.1493
How we figured it: three-year averages
Each point on the thick lines is the average of three published HVS annual rates ending in that year. Example for Idaho 2023 to 2025: (71.0 + 71.6 + 68.3) divided by 3 equals 70.3 percent. For the U.S.: (65.9 + 65.6 + 65.2) divided by 3 equals 65.6 percent. Where the Bureau published both an original and a revised rate for 1993 and 2002, we used the first published figure for each year; for Idaho in 2002 the two are the same. Averaging does not remove the survey's margin of error, but it reduces the year-to-year jumps.3
The delinquency wave
The Federal Reserve Bank of New York's credit panel, built from Equifax credit records, shows how hard the crisis hit Idaho borrowers. At the end of 2006, 0.71 percent of Idaho's mortgage debt balance was 90 or more days delinquent, below the national 1.28 percent. By the fourth quarter of 2009 the Idaho share had reached 6.60 percent; the national share peaked the same quarter at 8.66 percent. Idaho's share fell back below 1 percent by the end of 2016 (0.98 percent) and reached a low of 0.16 percent at the end of 2021. At the end of 2025 it was 0.74 percent, against 0.94 percent nationally.35
The same New York Fed file shows that Idaho borrowers carry more mortgage debt per person than the national average: $50,320 per consumer with a credit file at the end of 2025, against $44,300 nationally, after being below the national figure in every year from 2003 through 2019. Foreclosure counts and the housing slump that followed are covered in Part A, Idaho Since 1979: The Long View.35
Washington's response came in July 2008. The Housing and Economic Recovery Act, signed July 30, 2008, created the Federal Housing Finance Agency and gave it power to place Fannie Mae and Freddie Mac in conservatorship, which it did with their boards' consent on Sept. 6, 2008. FHFA says the two companies continue to operate under conservatorship. Their rules on down payments and credit scores apply to every conventional loan they buy, including loans Idaho lenders sell to them.31
The 2010s low point
Ownership bottomed out in the mid-2010s in every source. The national quarterly rate hit 62.9 percent in the second quarter of 2016, matching the lowest readings in the series, from 1964 and 1965. Idaho's HVS three-year average fell to 69.9 percent for 2016 to 2018 and 2017 to 2019. The ACS, with its much larger sample, put Idaho at 68.0 percent in 2014, its lowest reading from 2010 through 2025.15314
| Year | Idaho, ACS 1-year | U.S., ACS 1-year | Idaho, HVS annual | U.S., HVS annual |
|---|---|---|---|---|
| 2010 | 69.6% | 65.4% | 72.4% | 66.9% |
| 2012 | 68.4% | 63.9% | 73.0% | 65.4% |
| 2014 | 68.0% | 63.1% | 69.6% | 64.5% |
| 2016 | 68.5% | 63.1% | 70.5% | 63.4% |
| 2018 | 70.7% | 63.9% | 69.2% | 64.4% |
| 2019 | 71.6% | 64.1% | 70.6% | 64.6% |
| 2021 | 71.9% | 65.4% | 71.0% | 65.5% |
| 2022 | 72.3% | 65.2% | 71.3% | 65.8% |
| 2023 | 72.5% | 65.2% | 71.0% | 65.9% |
| 2024 | 71.7% | 65.3% | 71.6% | 65.6% |
| 2025 | 71.1% | 65.3% | 68.3% | 65.2% |
Sources: ACS 1-year table B25003 (rates are our calculation; the Census Bureau did not release standard 1-year ACS estimates for 2020); HVS Annual Statistics 2025, Table 15. The 2025 HVS figures rest on 11 months of data.143
The two surveys tell different stories for the 2020s. The ACS shows Idaho rising to 72.5 percent in 2023 and easing to 71.1 percent in 2025; the HVS shows Idaho flat near 71 percent and then dropping to 68.3 percent in 2025. Neither shows the sharp 2020 to 2022 dip some accounts describe. The ACS's much larger sample makes it the better guide to the level; the HVS is the only source that comes out every quarter.
The 2020s squeeze, 2020 to 2026
Idaho's homeownership rate barely moved in the 2020s. What changed was the cost of joining it. Part A of this series tracks prices and rents against inflation in detail in Prices and Rents vs. Inflation; this section shows only what the change means for a household trying to buy.
Rates, prices and incomes
Freddie Mac's weekly Primary Mortgage Market Survey shows the average 30-year fixed rate falling to a record low of 2.65 percent in the week of Jan. 7, 2021, averaging 2.96 percent for 2021, then rising to an average of 5.34 percent in 2022, 6.81 percent in 2023, 6.72 percent in 2024 and 6.60 percent in 2025 (annual averages of the weekly figures, our calculation). In the week of Nov. 19, 2026, the average was 7.28 percent. Freddie Mac is a government-sponsored enterprise in federal conservatorship; its survey is the standard national rate series.731
Over the same years Idaho home values rose much faster than incomes. In the ACS, the median value of an owner-occupied Idaho home was $255,200 in 2019 and $457,800 in 2025, a 79.4 percent increase; median household income rose from $60,999 to $84,234, a 38.1 percent increase (our calculations; neither figure is adjusted for inflation). Nationally the 2025 medians were $371,100 and $84,780. Idaho's median home value was 5.43 times its median household income in 2025, against 4.38 nationally; in 2019 the Idaho ratio was 4.18.6
How we figured it: the hypothetical payment
This is a hypothetical example to show scale, not an estimate of what any buyer pays. Inputs: the ACS median value of owner-occupied homes in Idaho (table B25077: $165,100 in 2010, $255,200 in 2019, $457,800 in 2025); a 10 percent down payment, so the loan is 90 percent of value ($148,590, $229,680 and $412,020); a 30-year fixed loan at that year's average Freddie Mac rate (4.69, 3.94 and 6.60 percent); and the standard amortization formula, payment = loan x r / (1 minus (1 + r) to the power of minus 360), where r is the annual rate divided by 12. Results: $770, $1,089 and $2,631 a month in principal and interest. Each payment is divided by the ACS median household income for that year divided by 12 (table B19013: $43,490, $60,999 and $84,234). Results: 21.2, 21.4 and 37.5 percent. At the Nov. 19, 2026, rate of 7.28 percent the 2025 loan would cost $2,819 a month, 40.2 percent of 2025 median income. The same method with U.S. 2025 medians ($371,100 value, $84,780 income) gives $2,133, or 30.2 percent. The payment excludes property taxes, insurance, mortgage insurance and any HOA dues, so a real payment would be higher. The median value is for all owner-occupied homes, not homes for sale, and the median household includes owners who already own.67
The numbers explain a pattern reporters hear often: owners who bought or refinanced before 2022 locked in low rates and stay put, while first-time buyers face both higher prices and higher rates. A household at the median income could carry the median home on about a fifth of its income in 2019 and needs well over a third in 2025 under the same assumptions. Rent, wage and price comparisons by county are in Part A, Idaho vs. the United States, and the buyer's side of a purchase is in Part C, Buying a Home in a Growing Area. The 2026 Legislature's starter-home and accessory dwelling laws, aimed partly at lowering the cost of new homes, are in Part B, The 2026 Housing Laws.
Did ownership fall in 2025?
The HVS says Idaho's rate fell from 71.6 percent in 2024 to 68.3 percent in 2025, a drop of 3.3 points, the largest one-year fall in the Idaho series, which starts in 1984 (the next largest was 3.1 points, from 2009 to 2010). The ACS for 2025 says 71.1 percent, down 0.6 points from 71.7 percent in 2024. The HVS quarterly figures for 2026 so far (70.7, 67.5 and 70.0 percent) have margins of about 3 points.31411
The evidence supports a small decline at most. The ACS's owner count for Idaho rose from 538,468 in 2024 to 544,227 in 2025, while total households rose faster, from 751,181 to 765,200, so the share slipped. In other words, more Idaho households owned in 2025 than in 2024, but renter households grew faster. The HVS figure for 2025 also lacks October data. A careful statement for 2025 is "about 71 percent in the ACS, with the smaller HVS survey showing a lower figure."143
First-time buyers: older and fewer
No government survey publishes an annual first-time buyer share for Idaho. The most cited national figure comes from the National Association of Realtors, an industry group, whose annual Profile of Home Buyers and Sellers surveys recent buyers. The 2026 profile, released Nov. 5, 2026, covers purchases from July 2025 to June 2026. NAR reported that first-time buyers were 22 percent of purchases, up from a record low of 21 percent the year before; their median age was 40, matching the record; repeat buyers' median age was 62; and first-time buyers' median down payment was 9 percent. NAR mailed its survey to 228,250 recent buyers and received 7,125 responses, a 3.1 percent adjusted response rate.8
The Census data fit the same story from a different angle. The HVS shows the national ownership rate for householders under 35 at 43.1 percent in 2004, 34.5 percent in 2016 and 37.0 percent in 2025.36
Who owns and who does not: gaps by age, income and ethnicity
The statewide rate averages very different groups. The ACS lets us split Idaho households by the age, income and race or Hispanic origin of the householder, the person in whose name the home is owned or rented.
By age
Ownership rises steeply with age. In 2025, Idaho's rate was 14.3 percent for householders 15 to 24, 48.9 percent for those 25 to 34, 69.6 percent for 35 to 44, 73.4 percent for 45 to 54, 84.2 percent for 55 to 59, 82.8 percent for 60 to 64, 85.8 percent for 65 to 74, 87.5 percent for 75 to 84 and 72.9 percent for 85 and over. Idaho is above the national rate at every age from 25 up. The 25 to 34 group shows the biggest gap: 48.9 percent in Idaho against 39.3 percent nationally.4
Two cautions. First, the ACS age split for a single year has margins of error of a few thousand households for each Idaho age group (for example, plus or minus 3,914 owners aged 25 to 34). Second, the data do not say why Idaho's young-adult rate is higher than the nation's, and a higher rate does not mean young Idahoans find buying easy today. The household definition also matters: young adults who live with parents are not counted as renters or owners.4
By income
Ownership rises with income. In 2025, 52.4 percent of Idaho households with incomes under $35,000 owned, against 89.3 percent of those with $150,000 or more. Idaho's rate is higher than the nation's in every income band. The lowest band includes many retired owners with paid-off homes and low current income: of Idaho's householders 65 and over, 85.2 percent owned in 2025.374
Income limits for assistance programs are measured against area median income, not these bands; lesson 02 explains how HUD sets those limits, and lesson 09 lists the limits for Idaho's buyer programs.
By race and Hispanic origin
The ACS 2020 to 2024 five-year estimates give the most reliable Idaho split by race and Hispanic origin, because single-year samples for small groups are thin. Among white non-Hispanic householders, 74.5 percent owned (442,252 of 593,736). Among Hispanic or Latino householders of any race, 59.7 percent owned (42,139 of 70,532). American Indian and Alaska Native householders owned at 63.2 percent, Asian householders at 58.3 percent, householders of two or more races at 63.7 percent and householders of some other race at 59.7 percent. Black or African American householders, a small group in Idaho (3,816 households, plus or minus 376), owned at 31.1 percent.5
The gap between white non-Hispanic and Hispanic householders was 14.8 points in Idaho and 22.1 points nationally in the same ACS period (73.1 against 51.0 percent). The national HVS series shows the same order: for 2025, 74.3 percent for non-Hispanic white householders, 48.5 percent for Hispanic householders and 44.7 percent for Black householders. The national Hispanic rate rose from 41.2 percent in 1994 to 48.5 percent in 2025.538
The data describe gaps; they do not explain them. Income, age, family size, time in the country, location and credit history all differ between groups, and the ACS tables do not control for any of them. Lending data that can test for differences in loan denials by race at the same income are covered in lesson 10. Tribal housing programs on Idaho's reservations are covered in lesson 04.
How we figured it: rates by group
Age: ACS 2025 1-year table B25007 (tenure by age of householder), owner count divided by owner plus renter count for each age group; combined groups (under 35, 55 to 64, 65 and over) add the published counts first. Example: under 35 in Idaho = (5,547 + 58,212) owners divided by (5,547 + 58,212 + 33,135 + 60,712) households = 40.5 percent. Income: ACS 2025 1-year table B25118, adding the published income bands into four groups (under $35,000; $35,000 to $74,999; $75,000 to $149,999; $150,000 or more). Race and Hispanic origin: ACS 2020 to 2024 5-year tables B25003A (white alone), B25003B (Black alone), B25003C (American Indian and Alaska Native alone), B25003D (Asian alone), B25003F (some other race alone), B25003G (two or more races), B25003H (white alone, not Hispanic) and B25003I (Hispanic or Latino). Hispanic householders may be of any race, so the groups overlap and do not add to the total.4375


Counties and towns
Below the state level only the ACS 5-year estimates are reliable, and each one pools five years of interviews. Comparing three non-overlapping periods, 2010 to 2014, 2015 to 2019 and 2020 to 2024, shows which counties gained owners as a share of households.133940
| County | 2010 to 2014 | 2015 to 2019 | 2020 to 2024 | Change, first to last period (points) | Households, 2020 to 2024 |
|---|---|---|---|---|---|
| Ada | 67.3% | 69.3% | 70.8% | plus 3.5 | 202,543 |
| Canyon | 68.9% | 69.5% | 75.5% | plus 6.6 | 86,069 |
| Twin Falls | 66.5% | 68.9% | 70.5% | plus 4.0 | 34,754 |
| Jerome | 63.5% | 64.9% | 75.2% | plus 11.7 | 8,277 |
| Gooding | 68.9% | 70.5% | 70.8% | plus 1.9 | 5,702 |
| Lincoln | 73.0% | 68.2% | 78.9% | plus 5.9 | 1,848 |
| Minidoka | 72.8% | 73.4% | 69.2% | minus 3.6 | 8,107 |
| Cassia | 69.6% | 70.3% | 68.6% | minus 1.0 | 8,495 |
| Blaine | 67.0% | 70.1% | 73.5% | plus 6.5 | 10,413 |
| Bonneville | 73.2% | 69.6% | 71.7% | minus 1.5 | 44,184 |
| Bannock | 68.9% | 67.5% | 69.5% | plus 0.6 | 33,590 |
| Kootenai | 70.2% | 70.4% | 71.3% | plus 1.1 | 71,172 |
| Nez Perce | 69.3% | 72.8% | 70.4% | plus 1.1 | 17,270 |
| Latah | 54.5% | 54.3% | 58.7% | plus 4.2 | 16,270 |
| Madison | 48.4% | 44.6% | 40.2% | minus 8.2 | 13,326 |
Source: Census Bureau, ACS 5-year table B25003 for each period; rates and changes are our calculations from the published counts.133940
Three patterns stand out. Canyon and Jerome counties made the biggest gains. Canyon added about 21,500 households between the first and last periods, and owners made up nearly all of the increase (owners rose by 20,540). Jerome County's owner count rose from 4,884 to 6,228 while its total households rose only from 7,686 to 8,277, so its rate jumped from the lowest of the Magic Valley counties to one of the highest. Margins of error matter for smaller counties: Jerome's 2020 to 2024 owner count carries a margin of plus or minus 294, and Lincoln County's 1,458 owners carry plus or minus 96, enough to move its rate several points.1339
College counties sit far below the state. Madison County was at 40.2 percent and Latah County at 58.7 percent in 2020 to 2024, and the cities of Rexburg (23.0 percent) and Moscow (40.0 percent) were lower still. The tables do not separate students from other renters, but both counties are home to large universities: Brigham Young University-Idaho in Rexburg and the University of Idaho in Moscow. Ada County, the state's largest, gained 3.5 points; Boise itself is well below the county rate, while its suburbs are well above it.1341
The county grid in Pictures, Numbers and Infographics, below, shows these counties arranged roughly north to south.
Magic Valley towns and big cities
| City | Owner households | All households | Homeownership rate | Margin on owner count |
|---|---|---|---|---|
| Jerome | 3,035 | 4,148 | 73.2% | plus or minus 245 |
| Twin Falls | 13,353 | 20,828 | 64.1% | plus or minus 693 |
| Kimberly | 1,425 | 1,723 | 82.7% | plus or minus 262 |
| Gooding | 792 | 1,305 | 60.7% | plus or minus 174 |
| Buhl | 1,385 | 1,816 | 76.3% | plus or minus 195 |
| Hagerman | 555 | 650 | 85.4% | plus or minus 155 |
| Boise | 63,910 | 101,178 | 63.2% | plus or minus 1,287 |
| Meridian | 35,839 | 48,038 | 74.6% | plus or minus 1,071 |
| Nampa | 27,478 | 39,134 | 70.2% | plus or minus 870 |
| Caldwell | 15,759 | 21,573 | 73.0% | plus or minus 676 |
| Eagle | 10,779 | 12,812 | 84.1% | plus or minus 493 |
| Kuna | 7,591 | 9,203 | 82.5% | plus or minus 575 |
| Star | 4,235 | 5,251 | 80.7% | plus or minus 364 |
| Idaho Falls | 15,873 | 24,728 | 64.2% | plus or minus 579 |
| Pocatello | 14,517 | 22,510 | 64.5% | plus or minus 636 |
| Coeur d'Alene | 14,250 | 23,963 | 59.5% | plus or minus 747 |
| Post Falls | 10,261 | 16,009 | 64.1% | plus or minus 670 |
| Lewiston | 9,604 | 14,235 | 67.5% | plus or minus 414 |
Source: Census Bureau, ACS 2020 to 2024 5-year table B25003 for incorporated places; rates are our calculations.41
The pattern holds across Idaho: regional centers with apartments, colleges and hospitals (Boise, Twin Falls, Idaho Falls, Pocatello, Coeur d'Alene) run in the low 60s, while the newer suburbs around them (Eagle, Kuna, Star, Meridian) and small towns like Kimberly and Hagerman run in the 70s and 80s. In the Magic Valley, Twin Falls is the rental center at 64.1 percent, while nearby Kimberly is at 82.7 percent. For Gooding and Hagerman, the margins of error are large compared with the counts: Hagerman's 555 owners could be as few as 400 or as many as 710, so its rate should be read as "high," not as exactly 85.4 percent. Part A's lesson Magic Valley Case Study covers the region's growth.41
Idaho vs. the United States and its neighbors
Idaho has had a higher homeownership rate than the nation in every census since 1900 and in every HVS year since 1984. Among its six neighbors, it led in 1900 and 2000 and ranks third, behind Wyoming and Montana, in the HVS three-year average for 2023 to 2025. In the 2025 ACS, Idaho's 71.1 percent was the highest of the seven states and 11th in the country.132
| State | 1900 census | 2000 census | HVS 2023 to 2025 average | ACS 2025 |
|---|---|---|---|---|
| Idaho | 71.6% | 72.4% | 70.3% | 71.1% |
| Montana | 56.6% | 69.1% | 71.2% | 69.4% |
| Wyoming | 55.2% | 70.0% | 73.9% | 69.8% |
| Utah | 67.8% | 71.5% | 69.0% | 68.7% |
| Oregon | 58.7% | 64.3% | 63.7% | 63.1% |
| Washington | 54.5% | 64.6% | 64.8% | 62.8% |
| Nevada | 66.2% | 60.9% | 60.6% | 61.1% |
| United States | 46.5% | 66.2% | 65.6% | 65.3% |
Sources: Historical Census of Housing Tables; HVS Annual Statistics 2025, Table 15 (averages are our calculation); ACS 2025 1-year table B25003 (rates are our calculation).132
The table shows why one source is never enough. Wyoming leads in the HVS average but trails Idaho in the ACS; Montana is above Idaho in one and below in the other. The differences between Idaho, Montana, Wyoming and Utah are within the margins of error of the HVS, and the ACS rankings among them could change with a different sample. What is solid is the grouping: the interior Mountain West states (Idaho, Montana, Wyoming, Utah) run about 3 to 8 points above the nation in both surveys, and Oregon, Washington and Nevada run at or below it.3112
Nationally, the 2025 ACS leaders were West Virginia (74.7 percent), Delaware (74.7 percent) and Michigan (74.1 percent).2
Pictures, Numbers and Infographics
The key figures from this lesson, each with its year and source.
| Measure | Idaho | U.S. or other states | Place or year | Source |
|---|---|---|---|---|
| Homeownership rate, census | 71.6% | U.S. 46.5%; North Dakota 80.0% | 1900 | 1 |
| Lowest census rate | 57.0% (1930) | U.S. 43.6% (1940) | 1900 to 2020 | 1 |
| Homeownership rate, census | 72.4% | U.S. 66.2% | 2000 | 1 |
| Homeownership rate, census | 70.4% | U.S. 63.1% | 2020 | 10 |
| Homeownership rate, ACS 1-year | 71.1% (544,227 of 765,200) | U.S. 65.3%; Idaho 11th of 51 | 2025 | 2 |
| Homeownership rate, HVS | 68.3% | U.S. 65.2% | 2025 (11 months) | 3 |
| HVS 3-year average | 70.3% | U.S. 65.6% | 2023 to 2025 | 3 |
| HVS highest year | 75.5% (2009) | U.S. quarterly high 69.2% (2004) | 1984 to 2025 | 315 |
| Owners under 35 | 40.5% | U.S. 34.5% | 2025 | 4 |
| Owners 65 and over | 85.2% | U.S. 78.7% | 2025 | 4 |
| Owners, income under $35,000 | 52.4% | U.S. 45.0% | 2025 | 37 |
| Owners, white non-Hispanic vs. Hispanic | 74.5% vs. 59.7% | U.S. 73.1% vs. 51.0% | 2020 to 2024 | 5 |
| Jerome County rate | 63.5% to 75.2% | Twin Falls County 66.5% to 70.5% | 2010 to 2014 vs. 2020 to 2024 | 1339 |
| Median home value / median income | 5.43 | U.S. 4.38 | 2025 | 6 |
| Hypothetical payment share of median income | 21.4% (2019) to 37.5% (2025) | U.S. 30.2% (2025) | Our calculation | 67 |
| 30-year mortgage rate | 2.65% (Jan. 7, 2021 low); 6.60% (2025 average); 7.28% (Nov. 19, 2026) | U.S. | 7 | |
| Mortgage debt 90+ days delinquent | 6.60% peak (Q4 2009); 0.74% (Q4 2025) | U.S. 8.66%; 0.94% | Fourth quarters | 35 |
| First-time buyer share and median age | 22% of purchases; median age 40 (national only; industry survey) | July 2025 to June 2026 | 8 | |
The line chart near the top of the lesson shows the 1900 to 2025 trend; the survey chart in the boom and bust section shows why the HVS needs averaging; the age, income and ethnicity bars are in the gaps section; and the payment chart is in the 2020s section.
Common mistakes
- Reading the rate as the share of people who own. The homeownership rate is a share of households (occupied homes), not of residents or adults. A family of six counts once. Adult children living with parents are not counted at all, so the rate can hold steady while fewer young adults live on their own.10
- Reporting a one-year HVS change for Idaho as news. The HVS state sample is small and Idaho's quarterly margins of error are about 3 points. The 3.3-point HVS drop from 2024 to 2025 was not matched by the ACS, which showed a 0.6-point dip and a rise in the number of owners. Averaging three years, or checking the ACS, avoids a false headline.31114
- Mixing sources in one trend line. Putting the 2009 HVS figure (75.5 percent) next to the 2010 Census count (69.9 percent) suggests a 5.6-point collapse in a year. Most of that gap is the difference between the two sources; the HVS itself showed 72.4 percent for 2010.39
- Repeating that "only 1 in 10 households owned homes" before FHA. HUD's FHA history page says this, but the census counted 47.8 percent of U.S. households as owners in 1930 and 43.6 percent in 1940, and Idaho's rate was 57.0 percent in 1930. Cite the census tables for ownership levels before 1934.171
- Treating the 2020 Census national rate as the trend. The 2020 count's 63.1 percent U.S. rate is well below the 2019 ACS and the 2020 HVS. The Census Bureau has not fully reconciled the difference (a 2021 working paper found pandemic changes in who answered likely pushed the 2020 HVS rate up), so compare 2020 Census figures with 2010 Census figures, not with survey numbers.1014343
- Comparing a 1-year ACS state figure with 5-year county figures. The 2025 statewide 71.1 percent and Jerome County's 2020 to 2024 75.2 percent come from different time windows. Compare counties with counties from the same 5-year release.213
- Reading a small town's rate to the decimal. Hagerman's 85.4 percent rests on 555 owner households with a margin of plus or minus 155. Report small-town rates as approximate and give the margin.41
- Treating NAR's first-time buyer share as a government statistic. It comes from a mailed survey of recent buyers by an industry group, with a 3.1 percent adjusted response rate, and it is national only. Label it and do not apply it to Idaho.8
- Calling unadjusted price and income changes "real." The ACS dollar figures in this lesson are in each year's dollars. Part A's lesson on prices and rents adjusts for inflation; use those figures when the question is purchasing power.6
What we know, what we don't, and what the data can show
What we know
- Idaho's homeownership rate has been above the national rate in every census since 1900, ranging from 57.0 percent (1930) to 72.4 percent (2000), and was 70.4 percent in the 2020 Census.110
- The 2025 ACS put Idaho at 71.1 percent, 11th among the states and the District of Columbia; the smaller HVS put it at 68.3 percent for 2025, with a 2023 to 2025 average of 70.3 percent.23
- Idaho's ownership rate is higher than the nation's in every age group from 25 up and every income band, and its gap between white non-Hispanic and Hispanic householders (14.8 points) is smaller than the national gap (22.1 points).4375
- A hypothetical median-income household would need about 38 percent of its income for principal and interest on the median Idaho home at 2025 rates, against about 21 percent in 2019.67
- Idaho's share of seriously delinquent mortgage debt peaked at 6.60 percent at the end of 2009 and was 0.74 percent at the end of 2025.35
What we don't know
- Why the 2020 Census national rate (63.1 percent) is so far below the survey figures for the same period; the Census Bureau has offered partial explanations (timing differences, and pandemic changes in who answered the 2020 HVS) but no full reconciliation.
- How many Idaho buyers each year are first-time buyers, and their median age; no public Idaho source publishes it.
- Whether Idaho's ownership rate actually fell in 2025, given the HVS's small sample and missing October data; the 2026 ACS 1-year estimates, expected in 2027, will help.
- How many Idaho homes were lost to foreclosure from 2007 to 2012 by county in a consistent government series; foreclosure counts are mostly published by private data firms.
- How much the federal mortgage interest deduction and Idaho's own tax rules change Idaho households' decisions to buy; no Idaho study measures it.
- Why Jerome County's ownership rate jumped about 12 points between the 2010 to 2014 and 2020 to 2024 ACS periods, beyond the published counts; possible factors include new subdivisions and changes in who lives there, but the tables do not say.
What the data can show
- Ownership by county and town over time: ACS 5-year table B25003, comparing non-overlapping periods, with the margins of error.13
- Ownership by age, income and race in any county: ACS tables B25007, B25118 and B25003A to B25003I at the county level (5-year estimates).4375
- Owners with and without a mortgage: 2020 Census DHC table H4, which splits owners into "owned with a mortgage or a loan" (324,717 in Idaho) and "owned free and clear" (151,546).10
- Quarterly changes with margins: HVS Table 3 for Idaho, used only with three-year averaging.11
- Payment burden over time: ACS median value (B25077) and median income (B19013) with Freddie Mac's weekly rate series, as in this lesson's methods box.67
- Mortgage stress: the New York Fed's state household debt file, updated each year, for mortgage debt per person and delinquency.35
Questions people ask
Is homeownership falling in Idaho?
Not much, if at all. The ACS shows 72.5 percent in 2023, 71.7 percent in 2024 and 71.1 percent in 2025, a small slide while the number of owner households kept rising. The HVS showed a sharper 2025 drop to 68.3 percent, but with a small sample and a missing month. Over 125 years the rate has stayed within about 57 to 76 percent in every source.1431
Why is Idaho's rate higher than the national rate?
The data show the gap but not its causes. The gap dates to at least 1900 and is shared with other interior West states such as Utah, Montana and Wyoming. Idaho's rate is higher than the nation's even within each age group and each income band, so age and income alone do not explain it.1437
Which number should I use for Idaho?
For the level, the newest ACS 1-year estimate (71.1 percent for 2025). For a long trend, the decennial census. For a quarterly change, the HVS with a three-year average. Always say which source and year.213
When did Idaho's homeownership peak?
In the census counts, 2000 (72.4 percent). In the HVS, 2009 (75.5 percent), with the three-year average highest for 2007 to 2009 (75.0 percent). In the ACS, which starts its standard 1-year series in 2005 but is available from 2010 in the tables we used, the highest reading was 72.5 percent in 2023.1314
Where can I find my town's rate?
On data.census.gov, search table B25003 and pick your city or county with the ACS 5-year estimates. Divide owner-occupied by total occupied. Check the margin of error column: if the margin is a large share of the count, the rate is rough.4113
Are young Idahoans shut out of owning?
Young Idaho householders still own at higher rates than young Americans: 48.9 percent of 25 to 34-year-old Idaho householders owned in 2025, against 39.3 percent nationally. But the payment needed for the median Idaho home rose from about 21 percent of median income in 2019 to about 38 percent in 2025 in our hypothetical example, and the national first-time buyer median age is 40 in NAR's survey. Help that exists for first-time buyers is described in lesson 09.4678
Do manufactured homes count as owned homes?
Yes. Tenure is about who owns the home, not its type, so a household that owns a manufactured home counts as an owner even if it rents the lot. Lesson 11 covers how manufactured homes are financed and titled.10
Hard questions
Should government promote homeownership?
The case for. Ownership lets households build equity, and a fixed-rate loan fixes the principal and interest payment for the life of the loan. Congress has backed it since 1932 through FHA, VA, USDA and the secondary market, and Idaho created its own housing finance agency in 1972 to finance housing for low-income residents.1820212226
The case against pushing too hard. Owning concentrates a household's savings in one asset in one place. The 2002 national goal for new minority homeowners came a few years before the mortgage crisis, when Idaho's share of seriously delinquent mortgage debt rose from 0.71 percent at the end of 2006 to 6.60 percent at the end of 2009.2935
What the evidence shows. The data in this lesson show the timing of the push and the delinquency wave, not cause and effect. Lesson 10 looks at research on down-payment assistance and loan performance.
Is the mortgage interest deduction good housing policy?
For. It lowers the after-tax cost of owning for itemizers, and Congress made the $750,000 limit permanent in 2025 and restored the deduction for mortgage insurance premiums starting in 2026.3332
Against. It helps only owners who itemize, so it gives the most to households with larger loans and higher incomes, and does nothing for renters.32
What the evidence shows. We found no Idaho-specific estimate of who claims the deduction; IRS Statistics of Income data by state could answer part of that question.
Does a high homeownership rate mean housing is affordable?
Yes, in part. A high rate means most households have secured a home they own, and Idaho's owners include many with paid-off homes: the 2020 Census counted 151,546 Idaho households owning free and clear.10
No, for newcomers. The rate measures people already in homes. Idaho's ratio of median home value to median income, 5.43 in 2025, is higher than the nation's 4.38, and the hypothetical payment share nearly doubled from 2019 to 2025.6
What the evidence shows. The rate and affordability can move in opposite directions. Lesson 02 explains the cost-burden measures that track affordability directly.
Is the gap between Hispanic and non-Hispanic white households closing?
Signs it is. Nationally, the HVS Hispanic ownership rate rose from 41.2 percent in 1994 to 48.5 percent in 2025, while the non-Hispanic white rate rose less.38
Signs it is not. The national gap in 2025 was still 25.8 points in the HVS, and Idaho's gap in the 2020 to 2024 ACS was 14.8 points.385
What the evidence shows. Idaho has no long published series by ethnicity at the state level from the HVS; comparing the ACS 2010 to 2014 and 2020 to 2024 B25003H and B25003I tables would show the Idaho trend.
For reporters and advocates
Records and data that exist. Census Bureau: the Historical Census of Housing Tables (1900 to 2000), 2010 and 2020 Census tenure tables, the HVS annual and quarterly state tables with margins of error, and ACS tables B25003, B25007, B25118, B25077 and B19013 for any county or city. The Federal Reserve Bank of New York's state household debt file. Freddie Mac's weekly rate series. IHFA's annual reports and bond disclosures, which may report how many first-mortgage and down-payment loans it made (covered in lessons 06 and 09). County assessor records of homeowner exemptions, which show owner-occupied homes parcel by parcel (see Part B on property tax).131113357
Questions to ask.
- To the Idaho Housing and Finance Association: how many first-time buyer loans and down-payment loans did it make last year by county, including Jerome, Twin Falls and Gooding counties, and what were the median buyer income and price?
- To county assessors: how many homeowner exemptions are on the rolls this year compared with five and ten years ago?
- To city planners: how many new homes are built for sale versus for rent, and how many are priced within reach of a household at the county's median income?
- To lenders and the Idaho Department of Finance: what share of recent Idaho mortgages were FHA, VA, USDA or conventional?
- To the Census Bureau's state data center partners: when will the 2026 ACS 1-year release come out, and what does it show for Idaho?
Public records. Assessor, city and IHFA records can be requested under the Idaho Public Records Act, Idaho Code Title 74, Chapter 1 (see Idaho Public Records Requests). Federal data need no request; they are downloadable. Lesson 12, How to Report on Affordable Housing, has the full workflow.
The Magic Valley angle. Jerome County's ownership rate rose from 63.5 to 75.2 percent between the 2010 to 2014 and 2020 to 2024 ACS periods, the largest gain of any county in this lesson, while Twin Falls city stayed a rental center at 64.1 percent and nearby Kimberly reached 82.7 percent. Ask who bought the new homes, at what prices, and whether the gain shows in Jerome County's homeowner exemption counts. Check the margins of error before comparing small towns like Gooding and Hagerman.133941
Where to go next
- data.census.gov (U.S. Census Bureau): Free. Search table B25003 to get owner and renter counts for any Idaho county, city or census tract; choose ACS 5-year for small places and note the margin of error column.
- Census Bureau Housing Vacancies and Homeownership (HVS): Free. Quarterly national homeownership releases and state tables with margins of error; average three years before reporting a state change.
- Historical Census of Housing Tables: Free. Homeownership rates for every state from 1900 to 2000 in one text file, with a short Census Bureau summary.
- New York Fed Household Debt and Credit: Free. Quarterly national report and an annual state file with mortgage debt per person and delinquency rates, useful for tracking mortgage stress in Idaho.
- Idaho Housing and Finance Association homebuyer programs: Free information from Idaho's state housing finance agency about its first-mortgage and down-payment loan programs and homebuyer education; program rules and limits change, and lesson 09 describes them.
- Find a housing counselor (Consumer Financial Protection Bureau): Free federal search tool that lists HUD-approved housing counseling agencies by ZIP code, including Idaho agencies that offer homebuyer education; many services are free or low cost.
Still being checked (6 items)
These points could not be fully confirmed against a primary source when this lesson was written and fact checked in November 2026. The text above states each one as uncertain.
- A full reconciliation of the 2020 Census U.S. homeownership rate (63.1 percent) with the 2019 ACS (64.1 percent) and 2020 HVS (66.6 percent): the Census Bureau's 2020 housing brief (C2020BR-09) cites timing differences between census and surveys in general, and its working paper SEHSD WP2021-04 says pandemic nonresponse likely raised the 2020 HVS rate, but we found no Bureau study that reconciles the three figures; we treat 2020 Census figures as comparable only with other census counts.
- HUD's FHA history page says only 1 in 10 households owned homes before 1934; the census tables show 47.8 percent in 1930, so we treat the HUD sentence as inaccurate.
- The causes of Idaho's fall from 71.6 percent (1900) to 57.0 percent (1930); the census tables do not explain it and we found no Idaho study.
- Whether Idaho's homeownership actually fell in 2025: the HVS shows 68.3 percent but the ACS shows 71.1 percent with more owner households than in 2024.
- The original loan terms of the first FHA-insured mortgages (maximum term and down payment); HUD's page does not state them, so the lesson does not.
- The specific reasons for Jerome County's 11.7-point rise between the 2010 to 2014 and 2020 to 2024 ACS periods.
Last verified November 20, 2026. General education, not legal, tax, financial or real estate advice; every figure names its source and year in the Notes and Sources below. Data is revised: check the newest release before relying on any number.
Notes
- U.S. Census Bureau, Historical Census of Housing Tables: Homeownership Rates, rates for the United States and each state, 1900 to 2000 (text file owner-tab.txt) (read Nov. 20, 2026). Read it online. ↩
- U.S. Census Bureau, American Community Survey 2025 1-year estimates, Table B25003, Tenure, for the United States, Idaho and all states. Idaho: 765,200 occupied units, 544,227 owner-occupied (margin of error 8,165); U.S. 134,063,422 and 87,511,734. Rates and state ranking (50 states and D.C.) are our calculation (read Nov. 20, 2026). Read it online. ↩
- U.S. Census Bureau, Current Population Survey/Housing Vacancy Survey, Annual Statistics 2025, Table 15, Homeownership Rates by State: 1984 to 2025, released March 24, 2026. Footnote to the table: October 2025 was not collected because of a lapse in federal funding, and annual 2025 estimates are based on 11 months. Three-year averages are our calculation (read Nov. 20, 2026). Read it online. ↩
- U.S. Census Bureau, American Community Survey 2025 1-year estimates, Table B25007, Tenure by Age of Householder, Idaho and United States. Rates by age group are our calculation from the published owner and renter counts (read Nov. 20, 2026). Read it online. ↩
- U.S. Census Bureau, American Community Survey 2020 to 2024 5-year estimates, Tables B25003A, B25003B, B25003C, B25003D, B25003E, B25003F, B25003G, B25003H and B25003I, Tenure by race and Hispanic origin of householder, Idaho and United States. Rates are our calculation (read Nov. 20, 2026). Read it online. ↩
- U.S. Census Bureau, American Community Survey 1-year estimates for 2010, 2019 and 2025, Table B25077, Median Value (Dollars), and Table B19013, Median Household Income, Idaho and United States. Idaho: $165,100 and $43,490 (2010); $255,200 and $60,999 (2019); $457,800 and $84,234 (2025). U.S. 2025: $371,100 and $84,780. Ratios, changes and the hypothetical payment are our calculation (read Nov. 20, 2026). Read it online. ↩
- Freddie Mac (a government-sponsored enterprise), Primary Mortgage Market Survey, historical weekly data, U.S. average 30-year fixed rate, 1971 to Nov. 19, 2026. Annual averages of the weekly figures are our calculation: 2010 4.69%, 2019 3.94%, 2021 2.96%, 2022 5.34%, 2023 6.81%, 2024 6.72%, 2025 6.60%; low of 2.65% the week of Jan. 7, 2021; 7.28% the week of Nov. 19, 2026 (read Nov. 20, 2026). Read it online. ↩
- National Association of Realtors (an industry group), "First-Time Home Buyer Share Inches Up to 22%, Median Age Remains at Record High of 40," news release on the 2026 Profile of Home Buyers and Sellers, Nov. 5, 2026; covers purchases July 2025 to June 2026; 7,125 responses from 228,250 surveys, 3.1% adjusted response rate (read Nov. 20, 2026). Read it online. ↩
- U.S. Census Bureau, 2010 Census Summary File 1, Table H4, Tenure, Idaho (579,408 occupied units; 286,971 owned with a mortgage or loan; 117,932 owned free and clear) and United States. Rates are our calculation (read Nov. 20, 2026). Read it online. ↩
- U.S. Census Bureau, 2020 Census Demographic and Housing Characteristics File, Table H4, Tenure, Idaho (676,206 occupied units; 324,717 owned with a mortgage or a loan; 151,546 owned free and clear; 199,943 renter occupied) and United States (126,817,580 occupied; 53,403,127 and 26,648,231 owners). Rates are our calculation (read Nov. 20, 2026). Read it online. ↩
- U.S. Census Bureau, Housing Vacancies and Homeownership, Table 3, Homeownership Rates by State: 2005 to 2026, quarterly, with margins of error; Idaho 2025: 69.3, 66.7, 67.9, 70.0; 2026 first three quarters: 70.7, 67.5, 70.0 (read Nov. 20, 2026). Read it online. ↩
- U.S. Census Bureau, Housing Vacancies and Homeownership, Frequently Asked Questions: homeownership rates published for the U.S., regions and states; about 72,000 housing units selected for the Current Population Survey each month (read Nov. 20, 2026). Read it online. ↩
- U.S. Census Bureau, American Community Survey 2020 to 2024 5-year estimates, Table B25003, Tenure, Idaho counties, with margins of error. Rates are our calculation (read Nov. 20, 2026). Read it online. ↩
- U.S. Census Bureau, American Community Survey 1-year estimates, Table B25003, Tenure, Idaho and United States, 2010 to 2019 and 2021 to 2025 (standard 1-year estimates were not released for 2020). Idaho owners 538,468 of 751,181 (2024). Rates are our calculation (read Nov. 20, 2026). Read it online. ↩
- U.S. Census Bureau, Housing Vacancies and Homeownership, Historical Table 14, Homeownership Rates for the U.S. and Regions: 1964 to Present (quarterly), source dated Oct. 28, 2026; U.S. high 69.2% (second and fourth quarters of 2004); 62.9% in 1964, 1965 and the second quarter of 2016; 65.5% third quarter 2026; note on the fourth quarter of 2025 (read Nov. 20, 2026). Read it online. ↩
- U.S. Census Bureau, Historical Census of Housing Tables: Homeownership, summary page describing trends from 1900 to 2000, including the 1940 national low and North Dakota's 80 percent in 1900 (read Nov. 20, 2026). Read it online. ↩
- U.S. Department of Housing and Urban Development, "The Federal Housing Administration (FHA)," history page: Congress created FHA in 1934; pre-FHA loans limited to 50 percent of value, three to five years, balloon payment; FHA became part of HUD's Office of Housing in 1965 (read Nov. 20, 2026). Read it online. ↩
- Federal Home Loan Bank Act, 12 U.S.C. 1421, source credit July 22, 1932, ch. 522, 47 Stat. 725 (read Nov. 20, 2026). Read it online. ↩
- HUD Office of Policy Development and Research, HUD timeline, entries for 1932, 1933, 1934, 1938, 1949, 1965, 1968, 1970, 1975, 1977, 2003 and 2008 (read Nov. 20, 2026). Read it online. ↩
- National Housing Act, 12 U.S.C. 1702, source credit June 27, 1934, ch. 847, title I, 48 Stat. 1246 (read Nov. 20, 2026). Read it online. ↩
- U.S. Department of Veterans Affairs, "History and Timeline of the GI Bill": signed June 22, 1944; guarantee not to exceed 50 percent of loans; nearly 2.4 million home loans for World War II veterans, 1944 to 1952 (read Nov. 20, 2026). Read it online. ↩
- 42 U.S.C. 1472, rural housing loans (Section 502), source credit July 15, 1949, ch. 338, title V, sec. 502; loan term up to 33 years under subsection (a) (read Nov. 20, 2026). Read it online. ↩
- Fair Housing Act, 42 U.S.C. 3601, source credit Pub. L. 90-284, title VIII, sec. 801, April 11, 1968, 82 Stat. 81; short title note for the Fair Housing Amendments Act of 1988, Pub. L. 100-430, Sept. 13, 1988 (read Nov. 20, 2026). Read it online. ↩
- U.S. Department of Justice, Civil Rights Division, "The Fair Housing Act," overview of covered entities and protected classes (read Nov. 20, 2026). Read it online. ↩
- Federal Home Loan Mortgage Corporation Act, 12 U.S.C. 1451, source credit Pub. L. 91-351, title III, July 24, 1970, 84 Stat. 451 (read Nov. 20, 2026). Read it online. ↩
- Idaho Code 67-6201, Purpose, Idaho Housing and Finance Association Act; history: added 1972, ch. 324; amended 1974, 1976, 1997, 2000, 2005 and 2007 (read Nov. 20, 2026). Read it online. ↩
- Home Mortgage Disclosure Act, 12 U.S.C. 2801, source credit Pub. L. 94-200, title III, Dec. 31, 1975, 89 Stat. 1125; purpose in subsection (b) (read Nov. 20, 2026). Read it online. ↩
- Community Reinvestment Act of 1977, 12 U.S.C. 2901, source credit Pub. L. 95-128, title VIII, Oct. 12, 1977, 91 Stat. 1147 (read Nov. 20, 2026). Read it online. ↩
- HUD archives, "Blueprint for the American Dream: 5.5 Million New Minority Homeowners by the End of the Decade," October 2002, describing the goal announced in June 2002 and the Oct. 15, 2002, White House Conference on Minority Homeownership (read Nov. 20, 2026). Read it online. ↩
- 42 U.S.C. 12821 (omitted), downpayment assistance initiative as amended by the American Dream Downpayment Act, Pub. L. 108-186, title I, sec. 102, Dec. 16, 2003; authority expired Dec. 31, 2011 (read Nov. 20, 2026). Read it online. ↩
- Federal Housing Finance Agency, "Conservatorship": Housing and Economic Recovery Act signed July 30, 2008; Fannie Mae and Freddie Mac placed in conservatorship with their boards' consent Sept. 6, 2008, and continue to operate under conservatorship (read Nov. 20, 2026). Read it online. ↩
- Internal Revenue Service, Publication 936, Home Mortgage Interest Deduction: $750,000 limit ($375,000 married filing separately) for debt taken out after Dec. 15, 2017; $1 million for debt from Oct. 14, 1987, to Dec. 15, 2017; statement that the mortgage insurance premium deduction had expired (read Nov. 20, 2026). Read it online. ↩
- Public Law 119-21, approved July 4, 2025, section 70108, Extension and modification of limitation on deduction for qualified residence interest, amending 26 U.S.C. 163(h)(3)(F), effective for taxable years beginning after Dec. 31, 2025 (read Nov. 20, 2026). Read it online. ↩
- 26 U.S.C. 163(h), interest deduction, qualified residence interest (read Nov. 20, 2026). Read it online. ↩
- Federal Reserve Bank of New York, State Level Household Debt Statistics 2003 to 2025 (February 2026), New York Fed Consumer Credit Panel/Equifax: mortgage debt balance per capita and percent of mortgage debt balance 90+ days delinquent, fourth quarter of each year, Idaho and U.S. (read Nov. 20, 2026). Read it online. ↩
- U.S. Census Bureau, Housing Vacancies and Homeownership, Annual Statistics 2025, Table 17, Homeownership Rates for the United States by Age of Householder and by Family Status: 1982 to 2025; householders under 35: 43.1% (2004), 34.5% (2016), 37.0% (2025) (read Nov. 20, 2026). Read it online. ↩
- U.S. Census Bureau, American Community Survey 2025 1-year estimates, Table B25118, Tenure by Household Income in the Past 12 Months, Idaho and United States. Grouped rates are our calculation (read Nov. 20, 2026). Read it online. ↩
- U.S. Census Bureau, Housing Vacancies and Homeownership, Annual Statistics 2025, Table 22, Homeownership Rates by Race and Ethnicity of Householder: 1994 to 2025; 2025: non-Hispanic white alone 74.3%, Black alone 44.7%, Hispanic or Latino 48.5%; Hispanic 41.2% in 1994 (read Nov. 20, 2026). Read it online. ↩
- U.S. Census Bureau, American Community Survey 2010 to 2014 5-year estimates, Table B25003, Tenure, Idaho counties. Rates are our calculation (read Nov. 20, 2026). Read it online. ↩
- U.S. Census Bureau, American Community Survey 2015 to 2019 5-year estimates, Table B25003, Tenure, Idaho counties. Rates are our calculation (read Nov. 20, 2026). Read it online. ↩
- U.S. Census Bureau, American Community Survey 2020 to 2024 5-year estimates, Table B25003, Tenure, Idaho incorporated places (Jerome, Twin Falls, Kimberly, Gooding, Buhl, Hagerman, Boise, Meridian, Nampa, Caldwell, Eagle, Kuna, Star, Idaho Falls, Pocatello, Coeur d'Alene, Post Falls, Lewiston, Rexburg, Moscow), with margins of error. Rates are our calculation (read Nov. 20, 2026). Read it online. ↩
- Molly Cromwell and Christopher Mazur, U.S. Census Bureau, Housing Characteristics: 2020, 2020 Census Briefs C2020BR-09, September 2023: national homeownership rate 63.1 percent in 2020, down from 65.1 percent in 2010, the lowest since 1970; note that census and survey estimates can differ, partly because of the reference date (read Nov. 20, 2026). Read it online. ↩
- Jonathan Spader, Daniel Truver, Peter Mateyka, Patricia Holley and Robert Callis, U.S. Census Bureau, "Is Homeownership Actually Rising and Vacancy Falling? Understanding Housing Vacancy Survey Estimates for 2020," Working Paper SEHSD WP2021-04, Feb. 18, 2021 (read Nov. 20, 2026). Read it online. ↩
Check yourself
1. What did the census count as Idaho's homeownership rate in 1900?
The Census Bureau's Historical Census of Housing Tables give Idaho 71.6 percent in 1900; 46.5 percent was the U.S. rate and 80.0 percent was North Dakota's.
2. In which census year did Idaho record its lowest homeownership rate?
The Historical Census of Housing Tables show Idaho at 57.0 percent in 1930, its lowest; the national low was 43.6 percent in 1940.
3. What does the homeownership rate divide owner-occupied homes by?
Census tenure tables such as 2020 Census DHC table H4 and ACS table B25003 divide owner-occupied units by all occupied units.
4. The ACS 2025 1-year estimate counted how many Idaho owner households out of 765,200 occupied homes?
ACS 2025 1-year table B25003 shows 544,227 owner-occupied units of 765,200, or 71.1 percent (our calculation).
5. Why should a one-year change in Idaho's Housing Vacancy Survey rate be read with caution?
Census HVS Table 3 lists Idaho quarterly margins of error of roughly 3 points, and the 2025 annual figure rests on 11 months because October 2025 was not collected.
6. Which 1934 law created the Federal Housing Administration?
The National Housing Act of June 27, 1934 (12 U.S.C. 1702) created the FHA, according to the U.S. Code source credit and HUD's FHA history.
7. What did Public Law 119-21, section 70108, do to the mortgage interest deduction?
Section 70108 of Public Law 119-21 (signed July 4, 2025) struck the 2026 end date of the $750,000 limit and added mortgage insurance premiums as interest for tax years beginning after Dec. 31, 2025.
8. In the 2025 ACS, what share of Idaho householders under 35 owned their homes?
ACS 2025 1-year table B25007 gives 63,759 owners among 157,606 Idaho householders under 35, or 40.5 percent (our calculation); 34.5 percent is the U.S. figure.
9. Which county in this lesson had the biggest gain in its ownership rate between the 2010 to 2014 and 2020 to 2024 ACS periods?
ACS 5-year table B25003 shows Jerome County rising from 63.5 to 75.2 percent, a gain of 11.7 points (our calculation).
10. Using this lesson's hypothetical (10 percent down, 30-year fixed at the year's average rate), about what share of Idaho's median household income would principal and interest on the median home take in 2025?
With ACS 2025 median value $457,800 and income $84,234 (tables B25077 and B19013) and Freddie Mac's 6.60 percent 2025 average, the payment is $2,631 a month, 37.5 percent of monthly income (our calculation).
Terms in this lesson
- Homeownership rate
- The number of occupied homes lived in by their owners divided by all occupied homes (households), as a percent.
- Tenure
- The Census Bureau's term for whether a household owns or rents the home it lives in.
- Household
- The people who live in one occupied housing unit; the unit of count for the homeownership rate.
- Owned free and clear
- An owner-occupied home with no mortgage or loan against it, a category in census tenure tables.
- Decennial census
- The full count of the population and housing taken every ten years; it has no sampling error.
- Housing Vacancy Survey (HVS)
- A Census Bureau supplement to the monthly Current Population Survey that produces quarterly national and annual state homeownership rates.
- American Community Survey (ACS)
- The Census Bureau's large annual survey that publishes 1-year estimates for states and large places and 5-year estimates for small towns and counties.
- Margin of error
- The range around a survey estimate that the Census Bureau publishes to show sampling uncertainty, at the 90 percent confidence level for the ACS.
- Three-year average
- The plain average of three annual survey rates, used to smooth year-to-year jumps in small state samples.
- Federal Housing Administration (FHA)
- The federal agency created in 1934 that insures home loans made by approved lenders; part of HUD since 1965.
- Conservatorship
- Control of Fannie Mae and Freddie Mac by the Federal Housing Finance Agency since Sept. 6, 2008.
- Mortgage interest deduction
- The federal income tax deduction for interest on a home loan, in 26 U.S.C. 163(h), limited to the first $750,000 of debt taken out after Dec. 15, 2017.
- Seriously delinquent
- A loan balance 90 or more days past due, the measure the New York Fed uses for state mortgage delinquency.
Sources
- U.S. Census Bureau, Historical Census of Housing Tables: Homeownership Rates, 1900 to 2000 (2026-11-20) checked 2026-11
- U.S. Census Bureau, Housing Vacancies and Homeownership, Annual Statistics 2025, Table 15: Homeownership Rates by State, 1984 to 2025 (2026-11-20) checked 2026-11
- U.S. Census Bureau, HVS Table 3: Homeownership Rates by State, 2005 to 2026 (quarterly, with margins of error) (2026-11-20) checked 2026-11
- U.S. Census Bureau, American Community Survey 2025 1-year, Table B25003: Tenure (2026-11-20) checked 2026-11
- U.S. Census Bureau, American Community Survey 2020 to 2024 5-year, Table B25003: Tenure (counties and places) (2026-11-20) checked 2026-11
- U.S. Census Bureau, 2020 Census Demographic and Housing Characteristics, Table H4: Tenure (2026-11-20) checked 2026-11
- Federal Reserve Bank of New York, State Level Household Debt Statistics 2003 to 2025 (2026-11-20) checked 2026-11
- Freddie Mac, Primary Mortgage Market Survey historical weekly data (2026-11-20) checked 2026-11
- Public Law 119-21 (July 4, 2025), section 70108 (2026-11-20) checked 2026-11
- Idaho Code 67-6201, Idaho Housing and Finance Association Act, purpose (2026-11-20) checked 2026-11
- HUD, The Federal Housing Administration (FHA) history (2026-11-20) checked 2026-11
- U.S. Department of Veterans Affairs, History and Timeline of the GI Bill (2026-11-20) checked 2026-11