Lesson 5 of 12 · about 55 minutes · Updated November 20, 2026
Who Is Served: The People in Idaho's Subsidized Housing
You'll be able to
- Read HUD's Picture of Subsidized Households for Idaho, a housing authority, a county or a single property, using HUD's own column definitions.
- Describe who lives in Idaho's HUD-assisted housing by income, age, disability, household type, race and ethnicity, and how that changed from 2010 to 2025.
- Compare Idaho's assisted households with the United States and with Idaho's general population without mixing household heads and residents or 62 and 65.
- Explain the wait and tenure figures and why they do not measure waiting lists.
- Use HUD's LIHTC tenant tables and USDA's multifamily occupancy statistics to cover the programs the Picture leaves out, and state their gaps.
- Identify the public records that could explain the patterns, including the Hispanic gap in the Magic Valley.
Start here: the short version
- About 11,200 Idaho households live in HUD-assisted homes. HUD's Picture of Subsidized Households: 2025 (snapshot Dec. 31, 2025) counts 12,942 subsidized units in Idaho, 11,165 of them occupied, holding 21,229 people. That is about 1.6 percent of Idaho's 713,005 households (our calculation).12
- Vouchers are most of it. Housing Choice Vouchers account for 8,065 of the 12,942 units (62 percent), project-based Section 8 buildings 3,807 (29 percent), public housing 610 (5 percent), Section 202 senior housing 358 and Section 811 disability housing 103 (our shares).1
- The typical assisted household is very poor, small and often older or disabled. Average household income was $17,469 a year, 24 percent of the local area median; 75 percent had incomes below 30 percent of median; 45 percent were headed by someone 62 or older; 36 percent of all people in these homes had a disability; 73 percent had no children.13
- Older than the nation's, whiter than the nation's. Idaho's assisted households are more often headed by someone 62 or older (45 percent vs. 43 percent nationally) and far less often by a person of color (18 percent vs. 67 percent). Ten percent of Idaho's assisted household heads are Hispanic, compared with 14.8 percent of Idaho residents.45
- The wait averaged 20 months for people admitted recently. New admissions to Idaho's voucher and public housing programs had waited an average of 20 months; agency averages ran from 8 months at Pocatello's Housing Alliance and Community Partnerships to 30 months at the Southwestern Idaho Cooperative Housing Authority. Once in, households had stayed an average of 84 months.16
- The Magic Valley gap. In Jerome County, 42.3 percent of residents are Hispanic but 12 percent of HUD-assisted household heads are; in Gooding County the figures are 34.3 and 2 percent. The data show the gap; they do not show the reason.75
- Big programs are missing from the Picture. The Low-Income Housing Tax Credit (about 10,000 Idaho units) and USDA's rural Section 515 apartments (3,585 Idaho households in October 2023) report tenants separately and less completely, and nobody publishes a statewide count of people on waitlists.8910
Data: HUD Picture of Subsidized Households 2025 (snapshot Dec. 31, 2025, files posted Feb. 18, 2026), with 2010, 2015 and 2020 editions for trends; HUD 2024 LIHTC tenant tables (posted October 2026); USDA Rural Development Multi-Family Housing occupancy statistics as of October 2023; Census Bureau Vintage 2025 population estimates and 2020 to 2024 American Community Survey; federal statutes and HUD rules as in effect Nov. 20, 2026. Checked Nov. 20, 2026. HUD posts a new Picture every year; check the newest release.
Every year HUD takes a snapshot of the people who live in the homes it pays for. The Picture of Subsidized Households draws on the tenant certification forms that housing authorities and building owners must file for each assisted household (Form HUD-50058 for public housing and vouchers, Form HUD-50059 for privately owned HUD buildings), adds up the results and publishes them for the nation, each state, county, city, Census tract, housing authority and project.118 It is the best public record of who is actually served by federal rental aid in Idaho, and it answers questions that come up at every city council hearing on affordable housing: Who lives there? How poor are they? Are they working? How long did they wait? How long do they stay? How much do they pay, and how much does the government pay?
This lesson reads the 2025 Picture for Idaho line by line, program by program and housing authority by housing authority, compares it with the United States and with Idaho's general population, and follows the numbers back to 2010. It then turns to the two big programs the Picture leaves out, the Low-Income Housing Tax Credit and USDA's rural rental housing, and to what none of these datasets can show, starting with the people still waiting. It is written for renters and applicants, housing authority commissioners and staff, landlords, city and county officials, legislators, reporters and advocates. It explains public data; it does not tell anyone whether they qualify or what to do.
It builds on lesson 02, What "Low Income" and "Affordable" Mean, which defines area median income, income limits and the 30 percent rule; lesson 03, Low-Income Housing Issues in Idaho, on the shortage and waitlists; and lesson 04, Idaho's Housing Authorities, which explains who runs each program. How to pull these files yourself is in lesson 12, How to Report on Affordable Housing. The general population figures used for comparison come from Part A of this series, Who Idahoans Are Now, and the statistics basics (averages, percentages, margins of error) from the site's Data and Statistics course.
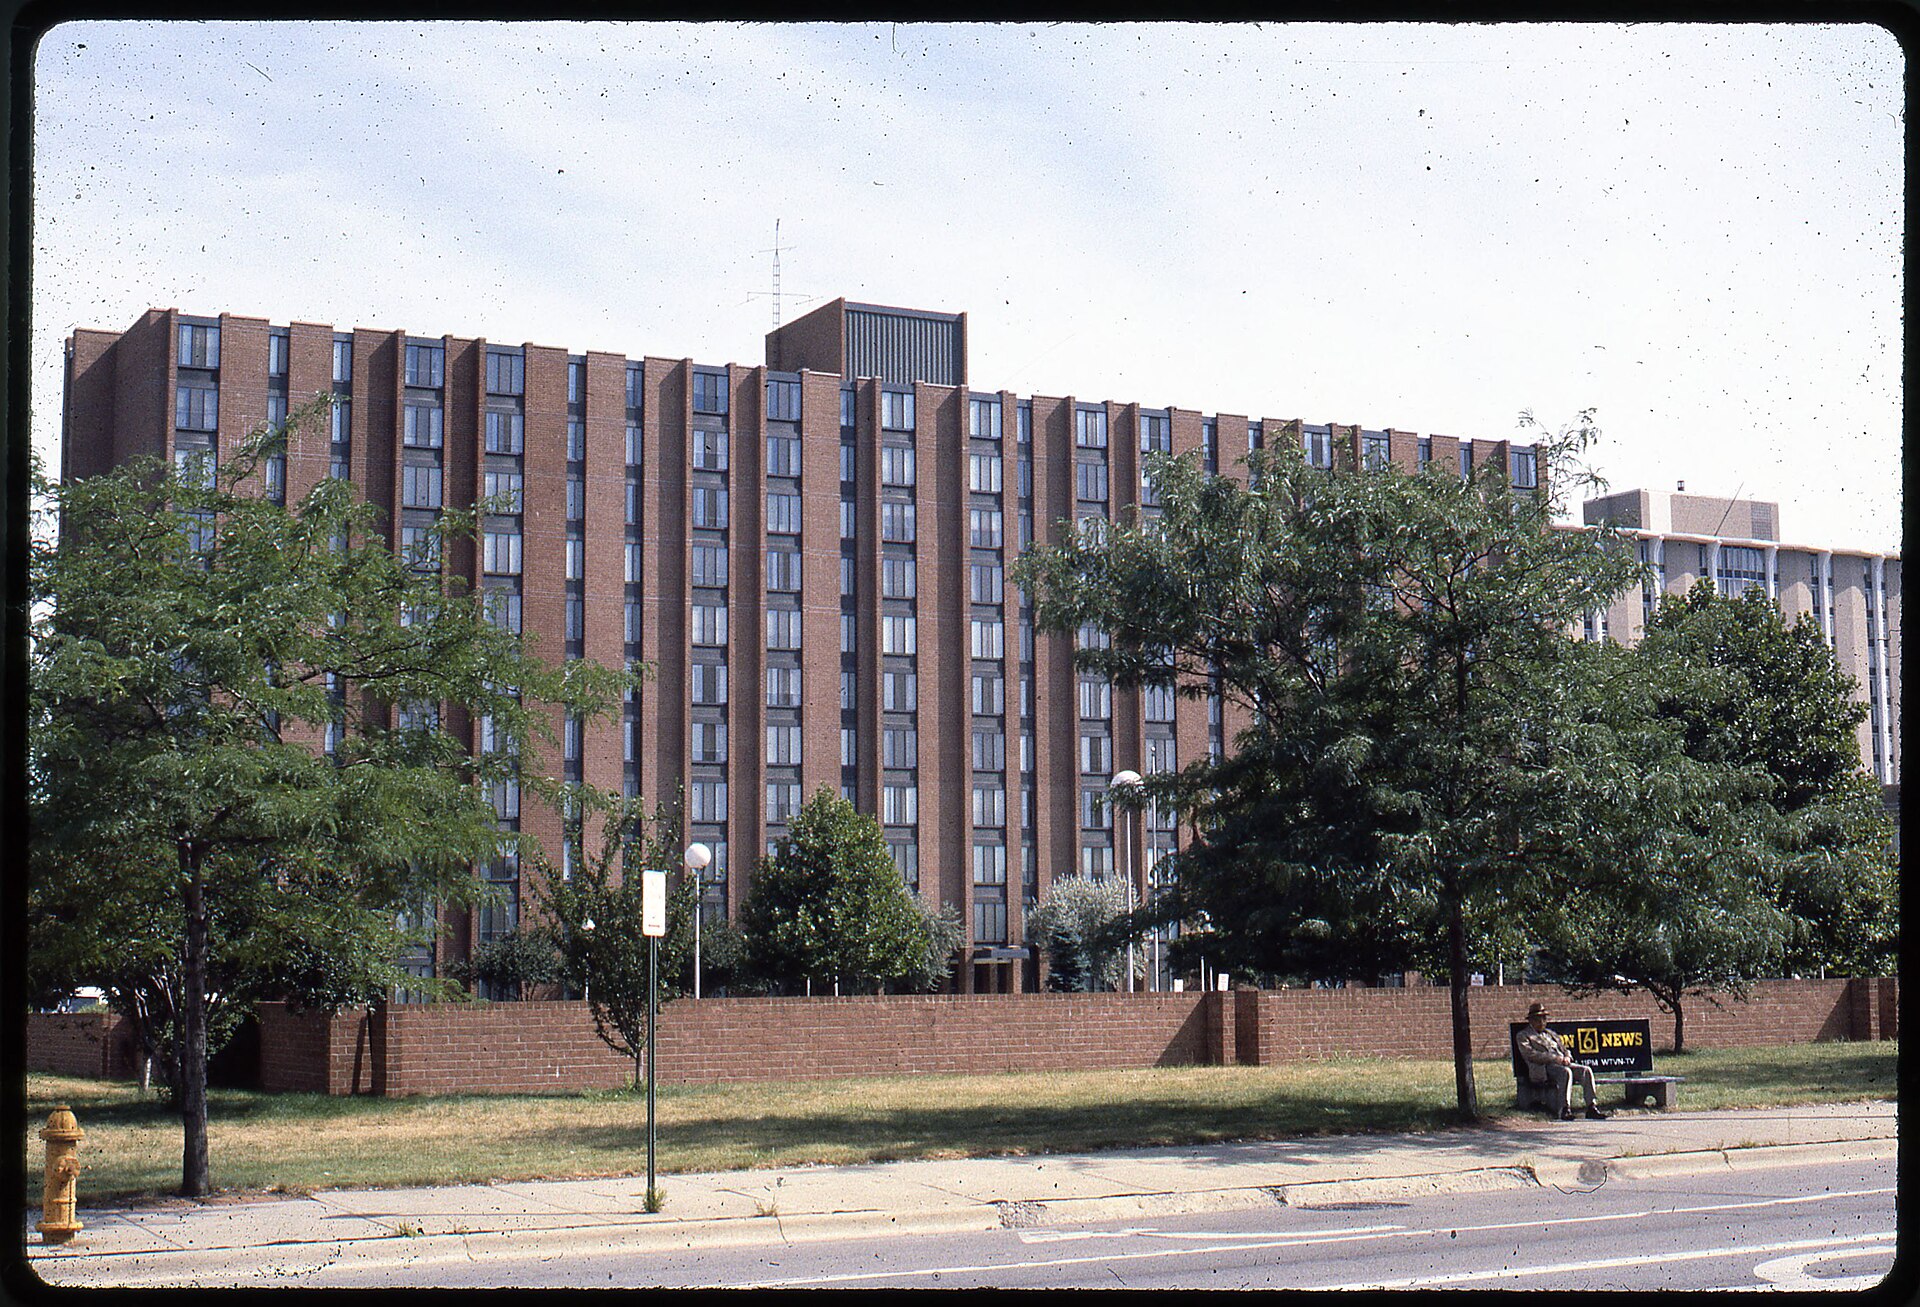

What the Picture of Subsidized Households is
Where the numbers come from
Federal law requires every household in HUD rental assistance to have its income and family makeup certified, at least yearly, because rent depends on income. Under 42 U.S.C. 1437a, a family in public housing, a voucher or most project-based Section 8 homes pays the highest of 30 percent of monthly adjusted income, 10 percent of monthly gross income, or a welfare rent, with a minimum rent that a housing authority may set at up to $50 a month.12 The forms that record those certifications (HUD-50058 for programs run by public housing agencies, HUD-50059 for privately owned HUD-assisted buildings) carry each household's income, sources of income, ages, disability status, race, ethnicity, admission date and, for agency programs, the date the family joined the waiting list.11
HUD's Office of Policy Development and Research rolls those forms up into the Picture. The 2025 edition is a snapshot dated Dec. 31, 2025; the data dictionary says reports are "reported as of December of this year with effective dates spanning the prior 18 months," so a few households' information is more than a year old.3 HUD posted the 2025 files on Feb. 18, 2026.1 Files go back to 1993 (with gaps before 2004), with an archival file from the 1970s, and the newest years are also available through an application programming interface.813
Which programs are in it, and which are not
HUD's program list in the Picture is:
- Public housing: apartments owned and run by a local public housing agency under the U.S. Housing Act of 1937.
- Housing Choice Vouchers (Section 8 of the 1937 Act, 42 U.S.C. 1437f(o)): the household rents from a private landlord and the housing authority pays part of the rent. The Picture splits these into tenant-based vouchers, which move with the family, and project-based vouchers, which a housing authority attaches to particular units.14
- Moderate Rehabilitation, an older Section 8 program (none reported in Idaho in 2025).
- Project-based Section 8: privately owned buildings with a HUD rental assistance contract for some or all units.
- Section 236 and below-market-interest-rate buildings and the old Rent Supplement and Rental Assistance Payment programs (none reported in Idaho in 2025).
- Section 202 with project rental assistance contracts (202/PRAC): housing for very low-income people 62 or older under 12 U.S.C. 1701q.15
- Section 811 with project rental assistance contracts (811/PRAC): housing for very low-income adults with disabilities under 42 U.S.C. 8013.16
HUD's download page says the Picture "does not cover other housing subsidy programs," naming the U.S. Department of Agriculture's rural rental programs, and that Indian Housing, HOME and Community Development Block Grants are also excluded.8 So tribal housing on the Nez Perce, Fort Hall, Coeur d'Alene, Duck Valley and Kootenai lands, funded under the Native American Housing Assistance and Self-Determination Act and covered in lesson 04, is not in these numbers. Neither are apartments built with Low-Income Housing Tax Credits unless the household also holds a voucher or the building also has a Section 8 contract. Those programs have their own, thinner tenant data, covered later in this lesson.
How to read the columns
The Picture has more than 80 columns. The ones this lesson uses, with HUD's own definitions from the 2025 data dictionary:3
| Column | HUD definition (2025 dictionary) | Watch out for |
|---|---|---|
| Subsidized units available | "Number of units under contract for federal subsidy and available for occupancy" | For vouchers this is a count of voucher slots, not apartments |
| Occupied, % occupied | Occupied units under contract, and occupied as a percent of available | For vouchers, a low number can mean unused vouchers, not empty apartments |
| Average family expenditure per month | "Average gross household contribution towards rent per month (includes payment toward rent and utilities)" | Includes utilities the tenant pays |
| Average HUD expenditure per month | "Average federal spending per unit-month"; for vouchers, the housing assistance payment plus an administrative cost amount | Public housing figures include operating and capital subsidy |
| Average household income | "Average total household income per year" | An average, pulled up by a few higher incomes |
| % of local median | Average household income as a percent of HUD's area median family income | Area median, not the household's own county median income |
| % 62 or older | Households in which the older of the head or spouse is 62 or older | HUD's elderly line is 62, the Census Bureau usually reports 65 |
| % with disability (all) | "Percentage of all persons in assisted households who have a disability" | Persons, not households |
| % female head with children | Households headed by a woman with children | Not limited to single parents |
| Months on waiting list | Average months between the date entered on the waiting list and admission; excludes programs that do not report waitlist dates | Only people who got in; blank for project-based Section 8, 202 and 811 |
| Months since moved in | Average months between admission and the snapshot date | People still in the program only |
| Codes -1, -4, -5 | Missing; suppressed where fewer than 11 families reported; non-reporting where under half reported | Never average these codes as numbers |
Idaho in 2025, program by program
The table below is the 2025 Picture's Idaho state file, one row per program. Every number is HUD's except the program shares, which are ours.1
| Measure (Idaho, Dec. 31, 2025) | All HUD programs | Housing Choice Vouchers | Project-based Section 8 | Public housing | Section 202/PRAC | Section 811/PRAC |
|---|---|---|---|---|---|---|
| Subsidized units available | 12,942 | 8,065 | 3,807 | 610 | 358 | 103 |
| Share of all units (our calculation) | 100% | 62.3% | 29.4% | 4.7% | 2.8% | 0.8% |
| Occupied | 11,165 (86%) | 6,702 (83%) | 3,432 (90%) | 580 (95%) | 352 (98%) | 99 (96%) |
| People | 21,229 | 14,488 | 5,448 | 810 | 365 | 118 |
| People per household | 1.8 | 1.9 | 1.6 | 1.4 | 1.0 | 1.1 |
| Average household income | $17,469 | $17,811 | $16,667 | $18,849 | $16,520 | $14,900 |
| Income as % of area median | 24% | 23% | 24% | 28% | 25% | 22% |
| Below 30% of area median | 75% | 76% | 74% | 68% | 74% | 85% |
| Majority of income from wages | 18% | 20% | 17% | 13% | 1% | 6% |
| Head or spouse 62 or older | 45% | 40% | 50% | 51% | 100% | 23% |
| All persons with a disability | 36% | 37% | 31% | 52% | 13% | 89% |
| Under-62 households with disabled head or spouse | 56% | 56% | 50% | 79% | not applicable | 97% |
| Female head | 71% | 74% | 68% | 64% | 74% | 56% |
| Female head with children | 23% | 27% | 20% | 11% | none reported | 3% |
| No children in household | 73% | 69% | 76% | 87% | 100% | 95% |
| Hispanic head | 10% | 12% | 7% | 11% | 6% | 9% |
| Head of color (minority) | 18% | 20% | 14% | 15% | 9% | 13% |
| Months on waiting list (new admissions) | 20 | 20 | not reported | 14 | not reported | not reported |
| Months since moved in | 84 | 89 | 72 | 92 | 78 | 92 |
| Moved in within the past year | 14% | 14% | 16% | 13% | 11% | 12% |
| Household pays per month (rent and utilities) | $433 | $456 | $392 | $411 | $384 | $352 |
| HUD pays per unit per month | $808 | $946 | $682 | $326 | $292 | $491 |
The voucher column includes 201 project-based voucher units (182 occupied). Those households look different from tenant-based voucher holders: half are headed by someone 62 or older, 85 percent are below 30 percent of median, 22 percent are Hispanic, and they had waited an average of 9 months, compared with 20 for tenant-based vouchers. Every Idaho row in the file is coded "non-MTW," even though HUD's list of Moving to Work agencies, the demonstration that lets agencies set some of their own rules, includes two Idaho agencies: Pocatello's (designated 2021, in the cohort for smaller agencies) and the Twin Falls Housing Authority (designated 2022, in the asset building cohort). The data dictionary does not explain the coding, so the Picture cannot be used to tell which Idaho agencies are in Moving to Work.147
Income: very poor by any measure
The average Idaho household in HUD-assisted housing had $17,469 a year in income at the end of 2025, or $1,456 a month (our division). That was 24 percent of the area median family income HUD uses for the household's location, and three in four households (75 percent) were below 30 percent of that median, the "extremely low income" line defined in 42 U.S.C. 1437a as the higher of 30 percent of area median or the federal poverty guideline.112 For comparison, the median Idaho household of any kind had $77,800 in income over 2020 to 2024 (2024 dollars), about 4.5 times the assisted average (our ratio; the two figures are different measures, a median and a mean, from different years).217
Some of that concentration is required by law. Since the Quality Housing and Work Responsibility Act of 1998, at least 75 percent of families newly admitted to tenant-based vouchers each year, and at least 40 percent of newly available public housing units and of units turning over in each project-based Section 8 building, must go to extremely low-income families (42 U.S.C. 1437n).18 Idaho's voucher program, at 76 percent below 30 percent of median, sits just above the 75 percent floor for new admissions; public housing, at 68 percent, sits well above its 40 percent floor.1
Wages were the main source of income for 18 percent of Idaho's assisted households. For 78 percent the main source was what HUD classes as "other" income, neither wages nor welfare; HUD's "welfare" column (cash public assistance as the main source) rounds to 0 percent. The 2025 Picture shows 4 percent with no income at all and 40 percent with incomes between $10,000 and $15,000.1 (Lesson 06 covers how the money flows; Social Security and SSI amounts are outside this course.)
Age and disability
In 45 percent of Idaho's assisted households the head or spouse was 62 or older, and 3 percent were 85 or older. Of households under 62, 56 percent had a head or spouse with a disability, and 36 percent of all people living in assisted homes had a disability.1 Put the two together and only about one household in four is headed by someone who is under 62 and not disabled (our calculation, shown in the methods box below). That figure matters for the debate over work requirements and time limits in rental aid, taken up in the hard questions at the end of this lesson and, for Medicaid, in the site's lesson on the 2027 work requirements.
HUD's age line is 62 because the 1937 Act, as amended, defines an elderly person as "a person who is at least 62 years of age."12 The Census Bureau usually reports people 65 and older: 18.7 percent of Idahoans on July 1, 2025.5 The two shares are not directly comparable (one counts households by the older of head or spouse at 62, the other counts every resident at 65), but the direction is plain: older people are a much larger part of the assisted population than of the state.
Household size and children
Assisted households are small. The Idaho average was 1.8 people per unit against 2.64 people per household statewide, and 73 percent of assisted households had no children.12 Of the 27 percent with children, most were headed by a woman: 23 percent of all assisted households were female-headed with children, and 9 percent were female-headed with a child under 6. Women headed 71 percent of all assisted households, of every type.1 Bedroom counts follow: 46 percent of assisted units had one bedroom, 35 percent two and 19 percent three or more. HUD's file flags 23 percent of Idaho assisted households as "overhoused," which its dictionary defines as a household with more bedrooms than people; the Picture does not say why.13
Race and ethnicity
By the race and ethnicity of the head of household, Idaho's 2025 assisted population was 81 percent non-Hispanic white, 10 percent Hispanic (of any race), 4 percent non-Hispanic Black, 2 percent non-Hispanic Native American, 2 percent non-Hispanic Asian or Pacific Islander and 1 percent multiracial. HUD's combined "minority" share, everyone other than non-Hispanic white, was 18 percent.1 Idaho's residents in the Vintage 2025 estimates were 77.8 percent non-Hispanic white alone and 14.8 percent Hispanic (our sums).5 The county section below shows where the gap is largest. Two cautions apply before reading anything into it: HUD counts household heads, the Census Bureau counts every person including children, and Idaho's Hispanic population is younger on average than its non-Hispanic white population, so Hispanic residents are a smaller share of household heads than of people even before any program rule applies.
How we figured it: shares, monthly income and the "under 62 and not disabled" estimate
Program shares. Units by program divided by the Summary of All HUD Programs total, 12,942: vouchers 8,065 / 12,942 = 62.3 percent; project-based Section 8 3,807 / 12,942 = 29.4 percent; public housing 610 / 12,942 = 4.7 percent; 202/PRAC 358 / 12,942 = 2.8 percent; 811/PRAC 103 / 12,942 = 0.8 percent. The program rows add to 12,943, one more than HUD's total, because of HUD's rounding and suppression; the shares use HUD's total.
Share of Idaho households. 11,165 occupied assisted units / 713,005 Idaho households (ACS 2020 to 2024) = 1.57 percent. The household count is a five-year average, so the share is approximate. People: 21,229 / 2,029,733 residents (July 1, 2025) = 1.05 percent.
Monthly income and ratio. $17,469 / 12 = $1,456. $77,800 / $17,469 = 4.45.
Under 62 and not disabled. HUD reports that 55 percent of Idaho assisted households have a head under 62 (column pct_lt62_head) and that 56 percent of those under-62 households have a disabled head or spouse (pct_disabled_lt62). 0.55 x (1 - 0.56) = 0.242, or about 24 percent of all households, roughly one in four. For the United States the same columns are 57 and 33 percent: 0.57 x 0.67 = 0.38, or 38 percent. This counts only the head and spouse, not other adults, and does not tell whether anyone in the household works or could work.
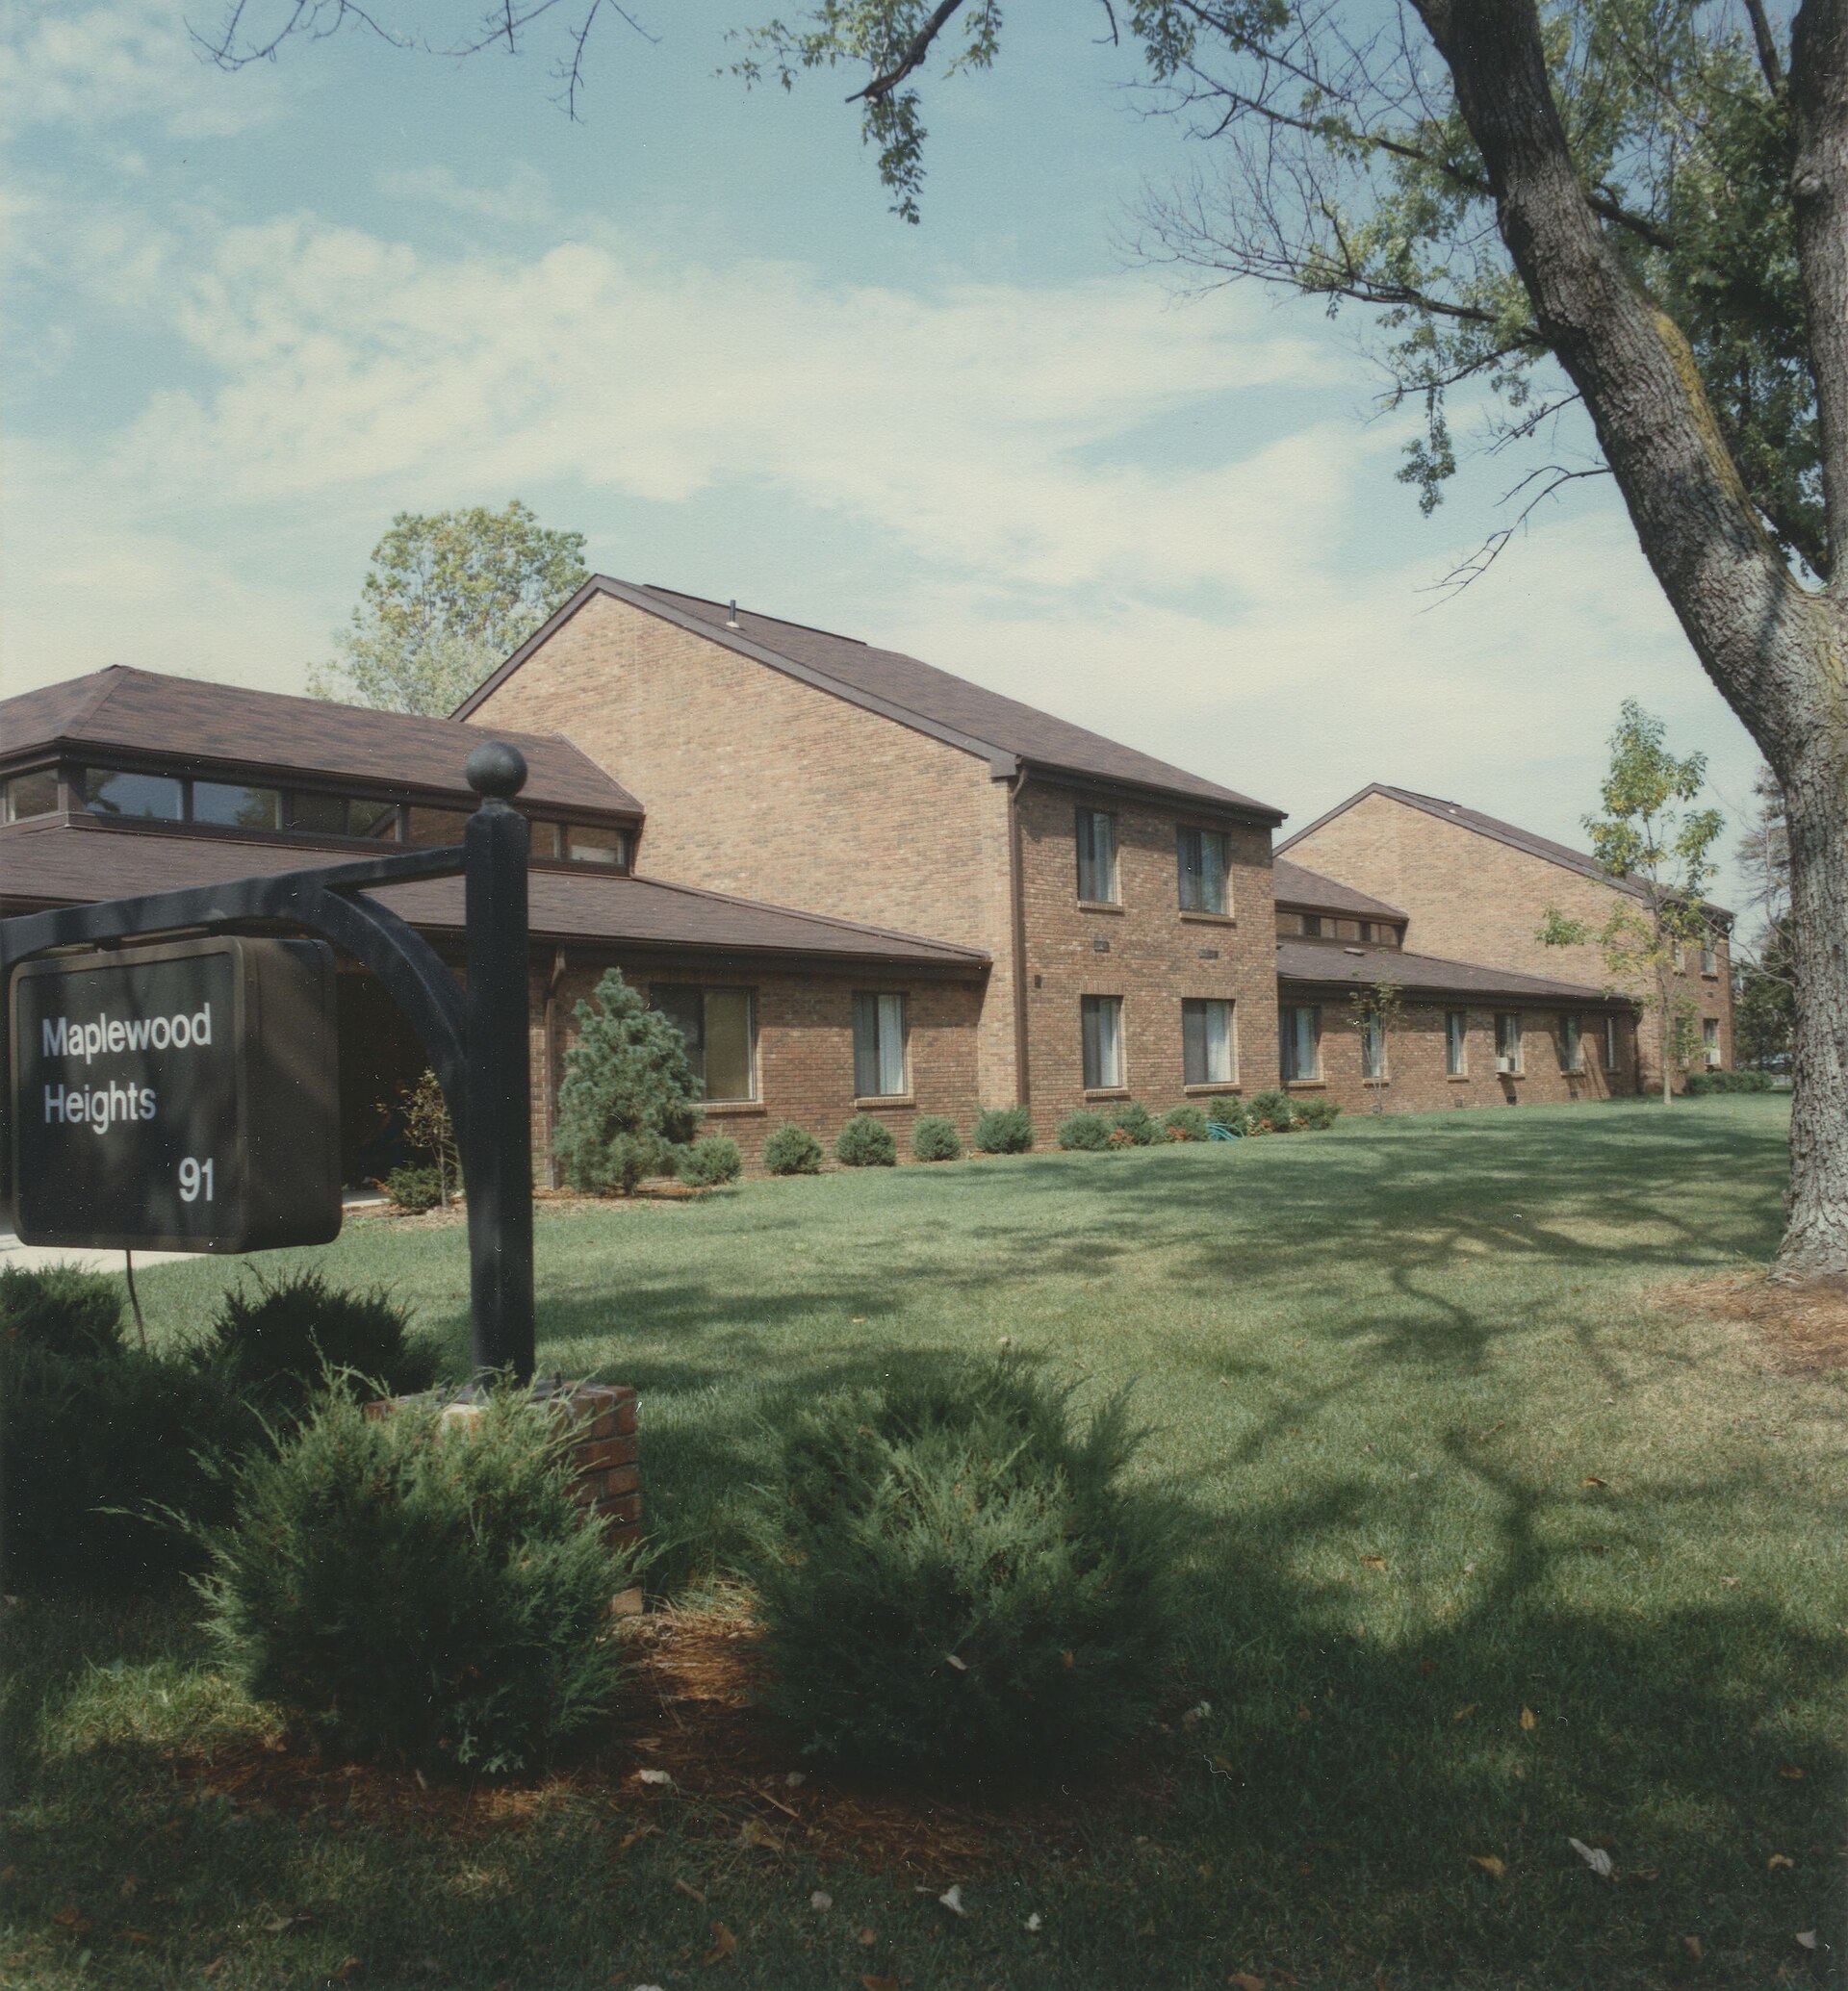

Idaho compared with the United States
Nationally, the 2025 Picture counts 5,132,918 subsidized units, 4,471,285 occupied, holding 8,860,364 people.4 Idaho's share of that, 12,942 units, is about 0.25 percent of the national total (our division). The table compares the two at the Summary of All HUD Programs level.
| Measure (all HUD programs, Dec. 31, 2025) | Idaho | United States | Difference (points or dollars) |
|---|---|---|---|
| Average household income | $17,469 | $18,483 | -$1,014 |
| Income as % of area median | 24% | 21% | +3 |
| Below 30% of area median | 75% | 79% | -4 |
| Majority of income from wages | 18% | 24% | -6 |
| Head or spouse 62 or older | 45% | 43% | +2 |
| All persons with a disability | 36% | 24% | +12 |
| Under-62 households with disabled head or spouse | 56% | 33% | +23 |
| Female head with children | 23% | 29% | -6 |
| Head of color (minority) | 18% | 67% | -49 |
| Hispanic head | 10% | 20% | -10 |
| Non-Hispanic Black head | 4% | 42% | -38 |
| Months on waiting list (new admissions) | 20 | 25 | -5 |
| Months since moved in | 84 | 123 | -39 |
| Moved in within the past year | 14% | 9% | +5 |
| Household pays per month | $433 | $452 | -$19 |
| HUD pays per unit per month | $808 | $1,135 | -$327 |
Sources: HUD Picture 2025, Idaho state rows and U.S. total rows; differences are our subtraction.14
Three differences stand out. First, disability: Idaho's assisted households are far more likely than the nation's to include a person with a disability, and among households under 62 the share with a disabled head or spouse is 56 percent against 33 percent nationally. Second, turnover: Idaho households have been in their homes an average of 84 months (7 years) against 123 months (about 10 years) nationally, and more of them moved in within the past year. Third, cost: HUD spends about $327 less per unit per month in Idaho than nationally, which likely reflects lower rents in most of Idaho than in high-cost metro areas; the Picture does not break the difference down (lesson 02 explains the fair market rents that set voucher costs).14 The racial makeup of the two differs because the populations differ: Idaho is a much whiter state than the nation, and 20.5 percent of U.S. residents are Hispanic compared with 14.8 percent of Idahoans.195
Why Idaho's assisted households are more often disabled is not answered by the Picture. Possible factors include a voucher program weighted toward smaller households, local preferences for elderly and disabled applicants in some authorities' plans, and the lower share of families with children noted above. Housing authority annual plans list each agency's admission preferences, as described in lesson 04 and lesson 12; the Picture shows only the result.2021
How Idaho's assisted households changed, 2010 to 2025
HUD has published the Picture in the same basic format since the late 1990s, so the state rows can be lined up across years. Program categories shifted a little (the 2010 file grouped Section 202, 811 and project-based buildings differently, and the 2022 and later files use 2020 Census geography), so the safest comparisons are at the Summary of All HUD Programs level.2223241
| Idaho, all HUD programs | 2010 | 2015 | 2020 | 2025 |
|---|---|---|---|---|
| Subsidized units available | 12,181 | 12,349 | 12,563 | 12,942 |
| % occupied | 95% | 93% | 89% | 86% |
| People | 24,192 | 24,182 | 21,545 | 21,229 |
| People per household | 2.1 | 2.0 | 1.9 | 1.8 |
| Average household income (current dollars) | $11,032 | $12,313 | $13,860 | $17,469 |
| Income as % of area median | 24% | 27% | 26% | 24% |
| Below 30% of area median | 72% | 66% | 70% | 75% |
| Majority of income from wages | 20% | 22% | 18% | 18% |
| Head or spouse 62 or older | 28% | 30% | 39% | 45% |
| All persons with a disability | 25% | 28% | 33% | 36% |
| Female head with children | 35% | 31% | 26% | 23% |
| Hispanic head | 9% | 10% | 10% | 10% |
| Head of color (minority) | 13% | 16% | 17% | 18% |
| Months on waiting list (new admissions) | 25 | 24 | 26 | 20 |
| Months since moved in | 55 | 71 | 79 | 84 |
| Household pays per month | $261 | $303 | $337 | $433 |
| HUD pays per unit per month | $463 | $503 | $552 | $808 |
Sources: HUD Picture of Subsidized Households, state files for 2010, 2015, 2020 and 2025, Idaho rows; the 2010 file reports some averages with decimals, rounded here by us.2223241
Older, more disabled, fewer children
In fifteen years the share of Idaho's assisted households headed by someone 62 or older rose from 28 to 45 percent, the share of people with a disability from 25 to 36 percent, and the share headed by a woman with children fell from 35 to 23 percent. The number of people in assisted homes fell from about 24,200 to about 21,200 even as the number of subsidized units rose by 761, because households got smaller (2.1 people to 1.8).221 The aging is not unique to subsidized housing: Idaho's median age and its 65-and-over share both rose over the same years, as Part A, Who Idahoans Are Now, shows. But the assisted population aged faster than the state as a whole.
Longer stays, shorter recorded waits
Average time in the program rose from 55 months in 2010 to 84 months in 2025, and the share who moved in within the past year fell from 16 to 14 percent. Longer stays mean fewer openings for people on waiting lists. The recorded wait for people who were admitted fell from 25 months to 20, but that figure describes only the people who got in, not those still waiting or those whose names were dropped (see the common mistakes section).2213
Income and cost in real dollars
Average household income rose 58 percent in current dollars, from $11,032 to $17,469. Adjusted for inflation with the Consumer Price Index, the 2010 average equals about $16,311 in December 2025 dollars, so the real gain was about 7 percent over fifteen years. HUD's average cost per occupied unit rose from $463 to $808 a month, or from about $684 to $808 in December 2025 dollars, a real increase of about 18 percent. The household's own monthly payment rose from about $386 to $433 in December 2025 dollars, about 12 percent.22125
The occupancy rate fell from 95 percent to 86 percent, mostly in the voucher program (96 percent occupied in 2010)22, where 6,702 of 8,065 voucher "units" were occupied at the end of 2025 (83 percent). The data dictionary does not define "available" and "occupied" separately for vouchers. One plausible reading is the gap between the vouchers a housing authority is authorized to use and the vouchers actually leased, which can fall when funding does not cover every authorized voucher or when holders cannot find a unit; the Picture does not say which. Each agency's own leasing reports and annual plan are the place to check, as lesson 06 and lesson 12 explain.13
How we figured it: 2010 and 2015 amounts in December 2025 dollars
Index. CPI-U, U.S. city average, all items, not seasonally adjusted (series CUUR0000SA0): December 2010 = 219.179; December 2015 = 236.525; December 2025 = 324.054. We use December values because each Picture is a December snapshot.
Factors. 324.054 / 219.179 = 1.4785 (2010 to 2025). 324.054 / 236.525 = 1.3701 (2015 to 2025).
Income. $11,032 x 1.4785 = $16,311. $17,469 / $16,311 = 1.071, a real gain of 7.1 percent. 2015: $12,313 x 1.3701 = $16,870; $17,469 / $16,870 = 1.036, a real gain of 3.6 percent. Nominal 2010 to 2025: $17,469 / $11,032 = 1.583, a 58.3 percent rise.
HUD cost per unit-month. HUD's 2010 file shows $462.79; x 1.4785 = $684.24; $808 / $684.24 = 1.181, an 18 percent real rise. Household payment. $261.36 x 1.4785 = $386.42; $433 / $386.42 = 1.121, a 12 percent real rise.
Limits. The CPI-U is a national index; Idaho rents rose faster than the national CPI in parts of this period (see Part A, lesson 09). Averages also shift when the mix of programs and households changes.
Housing authority by housing authority
The 2025 Picture lists nine Idaho public housing agencies with households: four small city authorities that run only public housing (Twin Falls, Buhl, Jerome and American Falls), the Boise City Housing Authority and the Ada County Housing Authority (separate HUD agencies run from the same office at 1001 S. Orchard St. in Boise), the Southwestern Idaho Cooperative Housing Authority in Middleton, Pocatello's Housing Alliance and Community Partnerships, and the Idaho Housing and Finance Association, which runs vouchers only (lesson 04 describes each agency's service area).626 Pocatello's agency, HUD code ID005, was listed in the 2020 Picture as the Housing Authority of the City of Pocatello; its website says it was formerly known by that name and as the Pocatello Housing Authority.2728 HUD's contact list also names a Nampa Housing Authority (ID002, low-rent), which had 67 units in the 2020 Picture but no rows in the 2025 file; lesson 04 covers what happened to each agency.2627
| Agency (HUD code) | Programs in the 2025 Picture | Units | Occupied | Avg. income | % of area median | 62 or older | Persons with disability | Female head, children | Hispanic head | Months waited | Months since move-in | Household pays / HUD pays per month |
|---|---|---|---|---|---|---|---|---|---|---|---|---|
| Idaho Housing and Finance Association (ID901) | Vouchers (21 project-based) | 4,017 | 3,150 (78%) | $17,069 | 24% | 42% | 39% | 25% | 9% | 22 | 85 | $441 / $836 |
| Boise City Housing Authority (ID013) | 160 public housing, 1,406 vouchers (64 project-based) | 1,566 | 1,369 (87%) | $18,919 | 23% | 42% | 42% | 23% | 8% | 17 | 96 | $474 / $1,054 |
| Southwestern Idaho Cooperative Housing Authority (ID016) | 42 public housing, 1,086 vouchers (115 project-based) | 1,128 | 1,069 (95%) | $18,345 | 22% | 42% | 33% | 31% | 29% | 30 | 97 | $454 / $1,035 |
| Housing Alliance and Community Partnerships, Pocatello (ID005) | 72 public housing, 752 vouchers | 824 | 697 (85%) | $15,247 | 21% | 24% | 31% | 32% | 11% | 8 | 71 | $396 / $641 |
| Ada County Housing Authority (ID021) | 10 public housing (details suppressed), 804 vouchers | 814 | 688 (85%) | $20,539 | 24% | 39% | 36% | 28% | 10% | 18 | 97 | $520 / $1,130 |
| Twin Falls Housing Authority (ID001) | 196 public housing | 196 | 186 (95%) | $19,299 | 30% | 50% | 45% | 16% | 10% | 23 | 100 | $441 / $359 |
| Housing Authority of the City Jerome (ID011) | 50 public housing | 50 | 47 (94%) | $18,019 | 31% | 74% | 55% | none | 13% | 12 | 72 | $404 / $386 |
| Housing Authority of the City of Buhl (ID010) | 40 public housing | 40 | 38 (95%) | $20,679 | 34% | 86% | 41% | none | 3% | 9 | 86 | $428 / $462 |
| Housing Authority of the City of American Falls (ID012) | 40 public housing | 40 | 38 (95%) | $22,337 | 33% | 50% | 39% | 21% | 18% | 19 | 91 | $470 / $520 |
Source: HUD Picture 2025, PHA file, Summary of All HUD Programs rows, with program detail from the program rows. "None" means HUD reports the item as missing (code -1), which for these two all-adult senior and disabled complexes means no households with children were reported.63
Agency totals add to 8,675 units: all 610 public housing units and all 8,065 vouchers in Idaho. The other 4,267 units in the state total (12,942 minus 8,675; the project-based Section 8, 202 and 811 rows themselves add to 4,268 because of HUD's rounding) belong to private and nonprofit owners under contract with HUD's multifamily office, not to housing authorities (our sums).61 That is why a housing authority's waitlist is never the whole story: an applicant can also apply building by building to project-based Section 8 and 202 properties, each with its own list, as lesson 07, Getting Help: A Step-by-Step Guide for Renters, explains.
What the agency numbers say
- Two kinds of agencies. The four small city authorities run senior-heavy public housing complexes. Buhl's 40 units were 86 percent elderly-headed and Jerome's 50 units 74 percent, with no families with children reported. The voucher agencies serve a younger mix: 24 percent elderly in Pocatello, 39 to 42 percent elsewhere.6
- The Middleton-based authority serves the most Hispanic households. The Southwestern Idaho Cooperative Housing Authority, based in Middleton in Canyon County, reported 29 percent Hispanic heads, close to Canyon County's 27.0 percent Hispanic population share; its households were tied with Ada County's for the largest (2.1 people), and 31 percent were female-headed with children, second only to Pocatello's 32 percent.65
- Waits vary almost fourfold. Average months waited by recent admissions ranged from 8 at Pocatello's agency to 30 at the Southwestern Idaho Cooperative Housing Authority (33 months for its tenant-based vouchers). In 2020, the Southwestern agency's average had been 55 months.627
- Voucher use differs. The share of voucher "units" occupied ranged from 78 percent at the Idaho Housing and Finance Association to 95 percent at the Southwestern Idaho Cooperative Housing Authority, with Boise City at 86 percent and Ada County at 84 percent. The Picture does not explain the differences.6
- Public housing costs HUD less per unit. Twin Falls's 196 public housing units cost HUD an average of $359 a month and Jerome's $386, compared with $691 to $1,166 per occupied voucher at the five voucher agencies, because public housing subsidy covers operating and capital gaps in buildings the agency already owns, while a voucher pays the difference between a market rent and the tenant's share.63
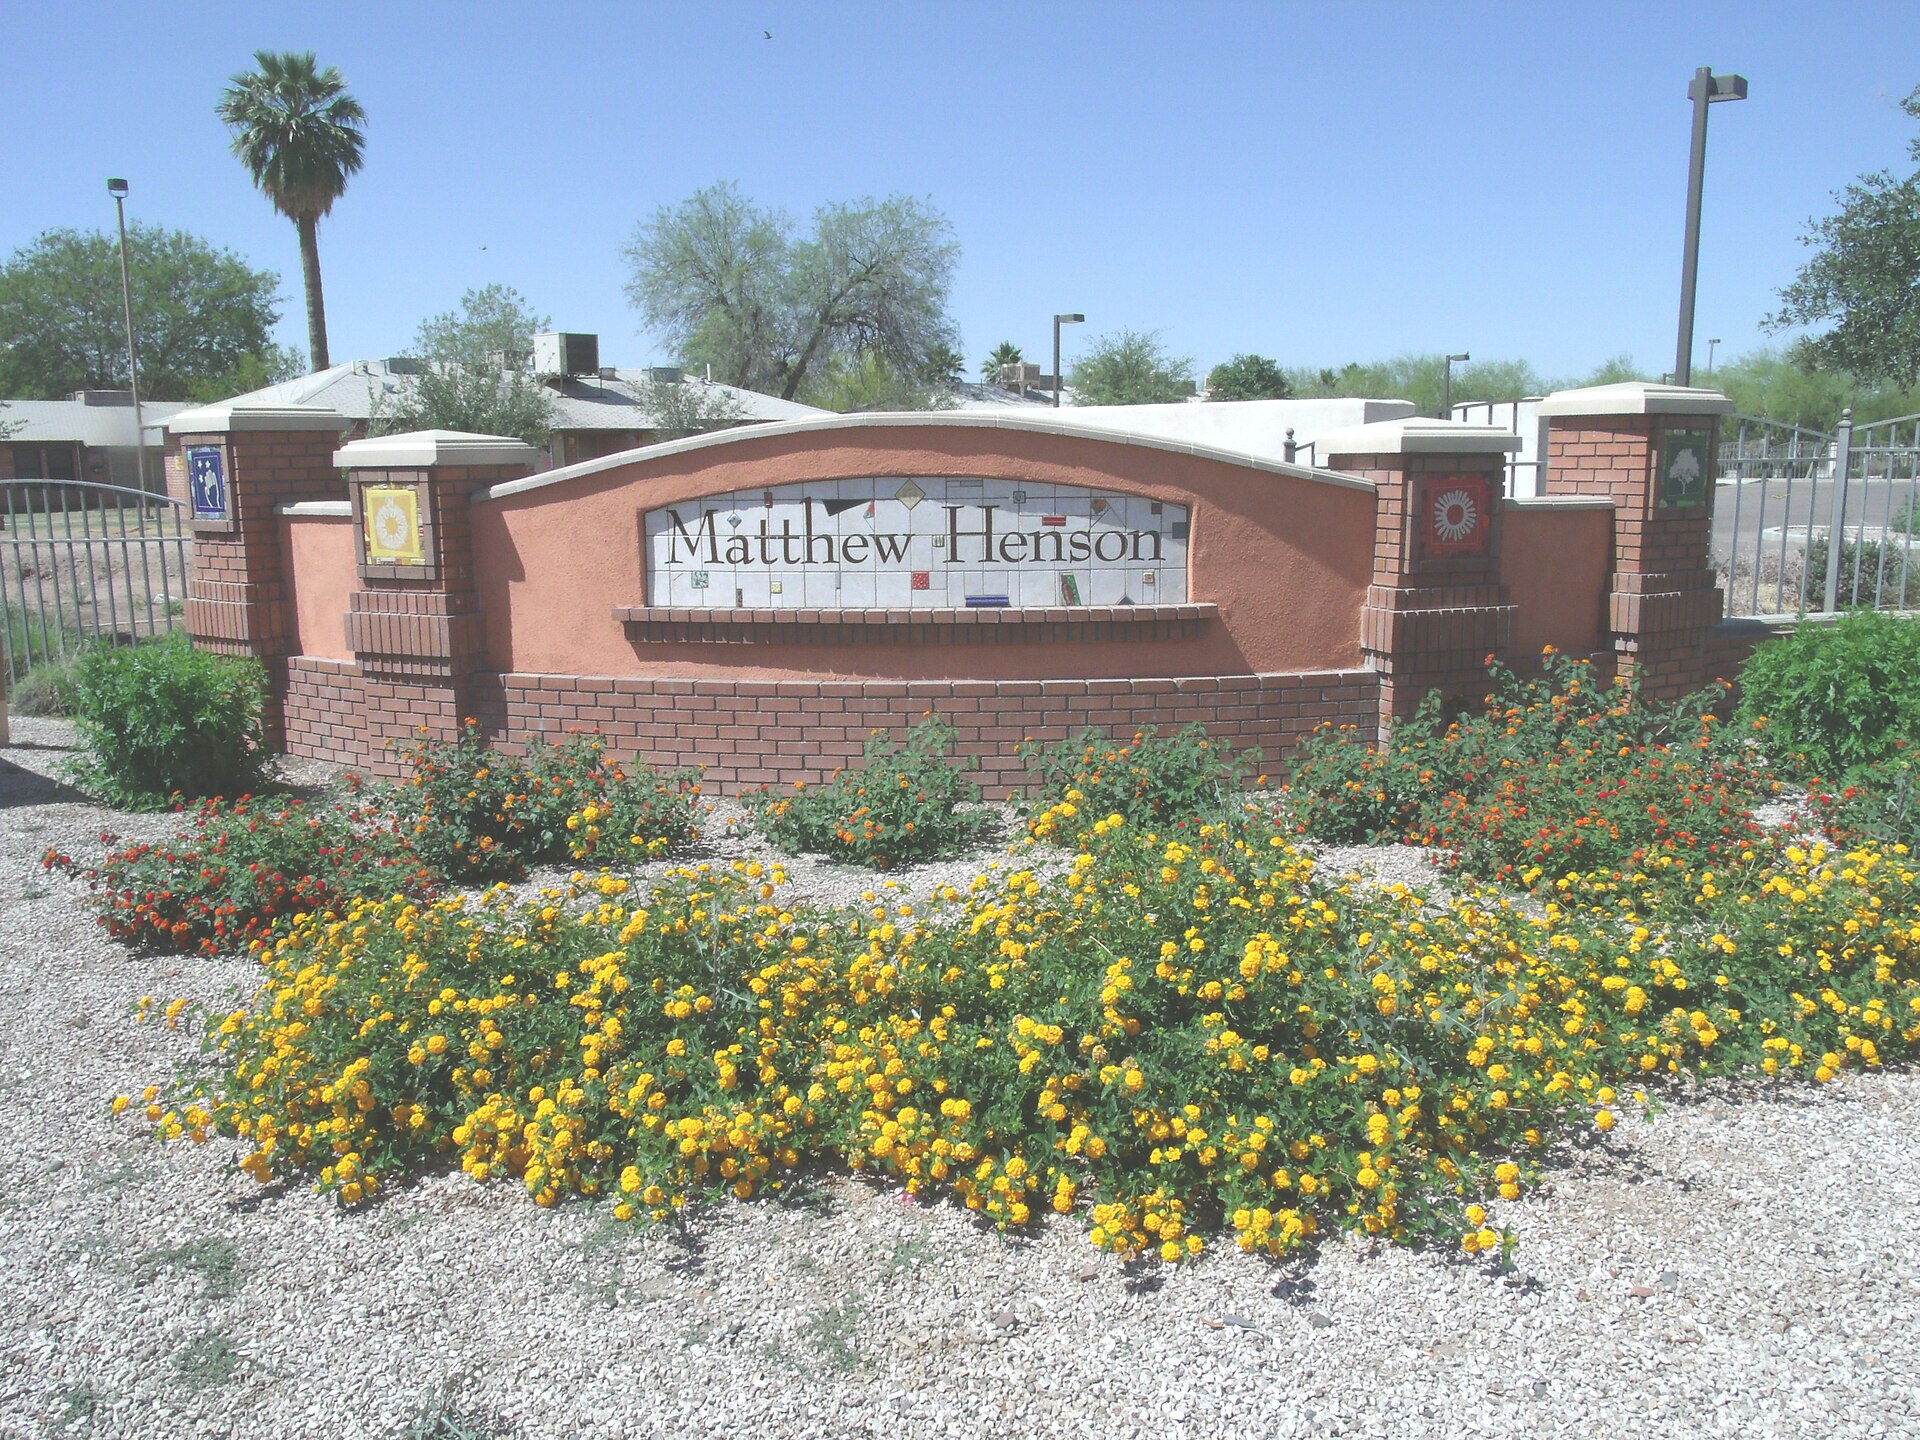

County by county, and the Magic Valley
The Picture's county file assigns every assisted household to the county where it lives, whichever agency or owner serves it. That makes it the best way to see the Magic Valley, where public housing comes from small city authorities and vouchers from the agencies described in lesson 04.7
| County (2025) | Units | Occupied | Avg. income | 62 or older | Persons with disability | Female head, children | Hispanic head (HUD) | Hispanic residents (Census, July 1, 2025) | Months waited |
|---|---|---|---|---|---|---|---|---|---|
| Twin Falls | 976 | 828 | $17,936 | 46% | 33% | 26% | 14% | 19.6% | 14 |
| Jerome | 153 | 135 | $17,306 | 58% | 32% | 22% | 12% | 42.3% | 13 |
| Gooding | 42 | 39 | $16,238 | 70% | 53% | 7% | 2% | 34.3% | 17 |
| Lincoln | 22 | 21 | $17,502 | 81% | 31% | 5% | 0% | 33.5% | not reported |
| Minidoka | 90 | 83 | $16,574 | 52% | 64% | 8% | 19% | 38.3% | 16 |
| Cassia | 152 | 129 | $17,546 | 52% | 32% | 20% | 27% | 32.3% | 15 |
| Blaine | 69 | 59 | $24,343 | 31% | 13% | 39% | 51% | 24.9% | 24 |
| Ada | 3,310 | 2,895 | $18,868 | 47% | 38% | 21% | 7% | 10.9% | 17 |
| Canyon | 1,307 | 1,221 | $17,768 | 43% | 33% | 29% | 27% | 27.0% | 30 |
| Kootenai | 1,702 | 1,421 | $17,614 | 57% | 36% | 17% | 5% | 6.4% | 30 |
| Bonneville | 1,200 | 975 | $16,622 | 32% | 33% | 30% | 13% | 15.5% | 23 |
| Bannock | 1,124 | 964 | $15,436 | 31% | 33% | 29% | 10% | 11.3% | 10 |
| Nez Perce | 761 | 637 | $16,681 | 52% | 46% | 16% | 2% | 5.0% | 20 |
| Idaho | 12,942 | 11,165 | $17,469 | 45% | 36% | 23% | 10% | 14.8% | 20 |
Sources: HUD Picture 2025, county file, Summary of All HUD Programs rows; Hispanic resident shares are our calculation from the Census Bureau's Vintage 2025 county estimates. HUD's Hispanic figure is for heads of household; the Census figure counts every resident, including children.75
The Hispanic gap in the Magic Valley
Across most of the state, the Hispanic share of assisted household heads runs a few points below the Hispanic share of residents, which is what the age difference alone would predict. In the Magic Valley's rural counties the gap is far larger: 12 percent of assisted heads against 42.3 percent of residents in Jerome County, 2 against 34.3 in Gooding County, 0 against 33.5 in Lincoln County, and 19 against 38.3 in Minidoka County. Canyon County is the exception, at 27 percent in both columns, and Blaine County runs the other way (51 percent of a small assisted population of 69 units).75
The data do not explain the gap, and several explanations fit it. Each can be checked against records:
- Age. Household heads are adults, and the Magic Valley's Hispanic population is much younger than its non-Hispanic population. In Jerome County on July 1, 2025, 31.4 percent of Hispanic residents were under 15 and 4.6 percent were 65 or older; for non-Hispanic residents the figures were 18.0 and 22.2 percent (our calculation). In a county where 58 percent of assisted households are headed by someone 62 or older, that age difference alone pulls the Hispanic share of assisted heads well below the Hispanic share of residents.57
- What is available. Jerome County's public housing (Heritage Homes, 50 units) is 74 percent elderly-headed with no families with children reported, and the Gooding County total of 42 units is 70 percent elderly. A county whose assisted stock is mostly senior housing will serve an older, and in the Magic Valley a less Hispanic, population.297
- Immigration status rules. Under 42 U.S.C. 1436a, HUD rental assistance is limited to citizens and noncitizens with eligible immigration status, and a "mixed family" with some ineligible members receives prorated assistance under 24 CFR 5.520. These rules apply to every program in the Picture; how many Magic Valley households they affect is not published.3031
- Other programs. Farmworker families are more likely to live in USDA Section 514 farm labor housing or Section 515 rural apartments, which are outside the Picture. In USDA's October 2023 report, 61.7 percent of Idaho's 149 Section 514 households and 13.4 percent of its 3,585 Section 515 households were Hispanic.3233
- Who applies. Applications, outreach, language access and landlord acceptance of vouchers all affect who ends up assisted. No public dataset measures them for Idaho counties; housing authority waitlist records, if requested, can show applicants by ethnicity.
Magic Valley properties by name
The Picture's project file lists each public housing development and each privately owned HUD-assisted building. Under the Twin Falls core-based statistical area code (46300), the 2025 file shows these properties in Twin Falls, Jerome, Buhl and Kimberly and nearby:29
| Property (program) | Town (HUD place code) | Units | % occupied | Avg. income | 62 or older | Persons with disability | Hispanic head | Months since move-in | Household pays / HUD pays |
|---|---|---|---|---|---|---|---|---|---|
| Duvall (public housing, Twin Falls Housing Authority) | Twin Falls | 196 | 95% | $19,299 | 50% | 45% | 10% | 100 | $441 / $359 |
| Heritage Homes (public housing, Jerome Housing Authority) | Jerome | 50 | 94% | $18,019 | 74% | 55% | 13% | 72 | $404 / $386 |
| Lincoln Courts (public housing, Housing Authority of the City of Buhl) | Buhl | 40 | 95% | $20,679 | 86% | 41% | 3% | 86 | $428 / $462 |
| Valley Vista Village (project-based Section 8) | Twin Falls | 60 | 97% | $15,741 | 95% | 41% | 7% | 74 | $374 / $582 |
| South Meadow Apartments (project-based Section 8) | Twin Falls | 41 | 85% | $20,358 | 15% | 18% | 24% | 51 | $477 / $570 |
| Cherrywood (project-based Section 8) | Twin Falls | 40 | 85% | $19,324 | 24% | 12% | 16% | 40 | $455 / $798 |
| Windwood (project-based Section 8) | Jerome | 30 | 92% | $14,575 | 17% | 12% | 17% | 60 | $351 / $716 |
| Kimberly Sunset Manor (project-based Section 8) | Kimberly | 24 | 98% | $14,796 | 92% | 38% | 8% | 69 | $342 / $783 |
| Meadowbrook (project-based Section 8) | Buhl | 20 | 88% | $18,696 | 6% | 22% | 0% | 31 | $446 / $561 |
| Syringa Estates (project-based Section 8) | outside a Census place | 20 | 96% | $19,124 | 89% | 58% | 5% | 79 | $442 / $684 |
| Balanced Rock Townhouses (project-based Section 8) | not stated here | 8 | Details suppressed (fewer than 11 reported families) | ||||||
Source: HUD Picture 2025, project file, Idaho rows coded to core-based statistical area 46300; towns are from HUD's place codes (82810 Twin Falls, 41320 Jerome, 10810 Buhl, 43570 Kimberly; 99999 means outside any Census place).29 Gooding County properties do not appear under that code, and USDA and tax credit properties are not in the file at all. The pattern is plain even at this scale: the buildings where most households are headed by someone 62 or older (Valley Vista Village, Kimberly Sunset Manor, Syringa Estates, Lincoln Courts, Heritage Homes) have Hispanic shares of 3 to 13 percent, while three with few older tenants (South Meadow, Cherrywood, Windwood) are 16 to 24 percent Hispanic. Meadowbrook in Buhl, also with few older tenants (6 percent), reported no Hispanic heads, so the pattern is not uniform.
The tax credit tenants: what HUD's LIHTC tables show
The Low-Income Housing Tax Credit, the largest producer of new affordable apartments in Idaho, is not a rental subsidy and is not in the Picture. Since the Housing and Economic Recovery Act of 2008, 42 U.S.C. 1437z-8 has required each state's credit agency (in Idaho, the Idaho Housing and Finance Association) to send HUD, at least once a year, the race, ethnicity, family makeup, age, income, rental assistance, disability status and rent of the households in each credit property.34 HUD publishes the results as state tables; the 2024 tables were posted in October 2026. HUD warns that the data came from state compliance systems and that "some HFAs have not fully adopted HUD's standards for collecting demographic information."359
| LIHTC tenant measure (2024 tables) | Idaho | United States |
|---|---|---|
| Units in tenant submission | 9,961 (232 properties) | 2,545,189 (34,631 properties) |
| Median household income | $26,000 | $18,600 |
| Above 0 and at or below 30% of area median (of households with limits reported; another 0.9% Idaho and 1.4% U.S. reported zero income) | 53.9% | 54.3% |
| Households with income, limit and restriction reported | 25.6% | 54.2% |
| At least one member under 18 | 34.8% | 28.9% |
| Head of household 62 or older | 38.6% | 37.6% |
| Head non-Hispanic white alone | 65.4% | 19.7% |
| Head Hispanic (any race) | 10.2% | 10.4% |
| Race or ethnicity not reported | 18.5% | 44.3% |
| Paying more than 30% of income in rent (our sum) | 37.7% | 41.6% |
| Paying more than 50% of income in rent | 8.3% | 15.4% |
| Receiving any rental assistance | 44.3% | 47.9% |
| Disability status reported (at least one member) | 7.5% | 77.8% |
Sources: HUD 2024 LIHTC Tenant Tables 1, 4, 5, 7, 8, 9, 10 and 11.936373839404142
Read against the Picture, tax credit tenants in Idaho have higher incomes (a median of $26,000), include more families with children, and pay a larger share of their income in rent: 37.7 percent pay more than 30 percent of income (our sum of HUD's columns). That fits how the program works. A tax credit apartment has a fixed rent set from the area median income limit for the unit, not from the tenant's income, so a tenant with no voucher pays the same rent whatever their income, as lesson 02 and lesson 06 explain. Of Idaho tax credit households with federal rental assistance, 44.9 percent used a tenant-based voucher, 21.2 percent project-based Section 8 and 21.9 percent USDA Section 521 rental assistance, which links all three datasets in this lesson.4142
The gaps matter as much as the figures. Idaho reported disability status for only 7.5 percent of tax credit households, so the tables cannot say how many tax credit tenants have a disability. Income limits were reported for only a quarter of households. The race and ethnicity of 18.5 percent of household heads was not reported, better than the national 44.3 percent but enough to move any comparison by several points.374036
USDA rural rental housing tenants
USDA Rural Development's Section 515 program financed apartments in rural towns, and Section 521 rental assistance lowers the rent for many of their tenants; Section 514 and 516 finance farm labor housing. USDA does not appear in HUD's Picture.8 Its own Multi-Family Housing occupancy statistics, sent to Rural Development staff by Rural Housing Service Administrator Joaquin Altoro in a memo dated Feb. 20, 2024, describe tenants as of October 2023. The Housing Assistance Council, a national rural housing nonprofit, posted the report; the figures below come from USDA's tables in it.1043
| Idaho, USDA multifamily (as of October 2023) | Section 515 rural rental | Section 514 farm labor |
|---|---|---|
| Projects | 150 | 6 |
| Units / occupied households | 3,728 / 3,585 | 159 / 149 |
| Occupancy rate | 96.76% | 96.13% |
| Tenants and co-tenants | 4,107 | 223 |
| Average adjusted household income | $15,529 | $26,165 |
| Households with Section 521 rental assistance | 3,317 (92.5%, our calculation) | not used here |
| Elderly, disabled or handicapped households | 2,402 (67.0%) | 34 (22.8%) |
| Hispanic households | 482 (13.4%) | 92 (61.7%) |
| Single-person households | 2,212 (61.7%) | not used here |
| Female-headed households | 2,446 (68.2%, our sum) | not used here |
Sources: USDA Rural Development Multi-Family Housing Occupancy Statistics as of October 2023, Section 515 and Section 514 tables, Idaho rows.1044334532
The rural Section 515 portfolio, about 3,600 households in 150 Idaho projects, looks much like HUD's assisted population: very low incomes (an average adjusted income of $15,529), two-thirds elderly or disabled, mostly one-person households and mostly headed by women. Its 13.4 percent Hispanic share is a little above the HUD Picture's 10 percent. The six farm labor projects are different: family households (257 minors among 149 households), higher incomes, and a Hispanic majority. Lesson 03 covers farmworker housing and the expiring USDA mortgages that threaten some of these properties.4532 USDA's income figure is adjusted income (after deductions), while HUD's Picture reports total income, so the two averages are not directly comparable.46
How we figured it: what households pay and what HUD spends
Share of income paid. Idaho, all programs: $433 x 12 = $5,196 a year; $5,196 / $17,469 average income = 29.7 percent. United States: $452 x 12 = $5,424; $5,424 / $18,483 = 29.3 percent. This compares an average payment with an average income, so it is not any household's rent burden; the law sets rent at 30 percent of adjusted income, which is lower than total income, so a household paying exactly 30 percent of adjusted income pays less than 30 percent of total income.
Rough annual HUD spending in Idaho. $808 per occupied unit-month x 11,165 occupied units x 12 months = $108,255,840, about $108 million a year. This is an order-of-magnitude estimate from an average, not a budget figure; lesson 06 traces the actual appropriations.
Chart totals. Household plus HUD amounts, for example vouchers $456 + $946 = $1,402.
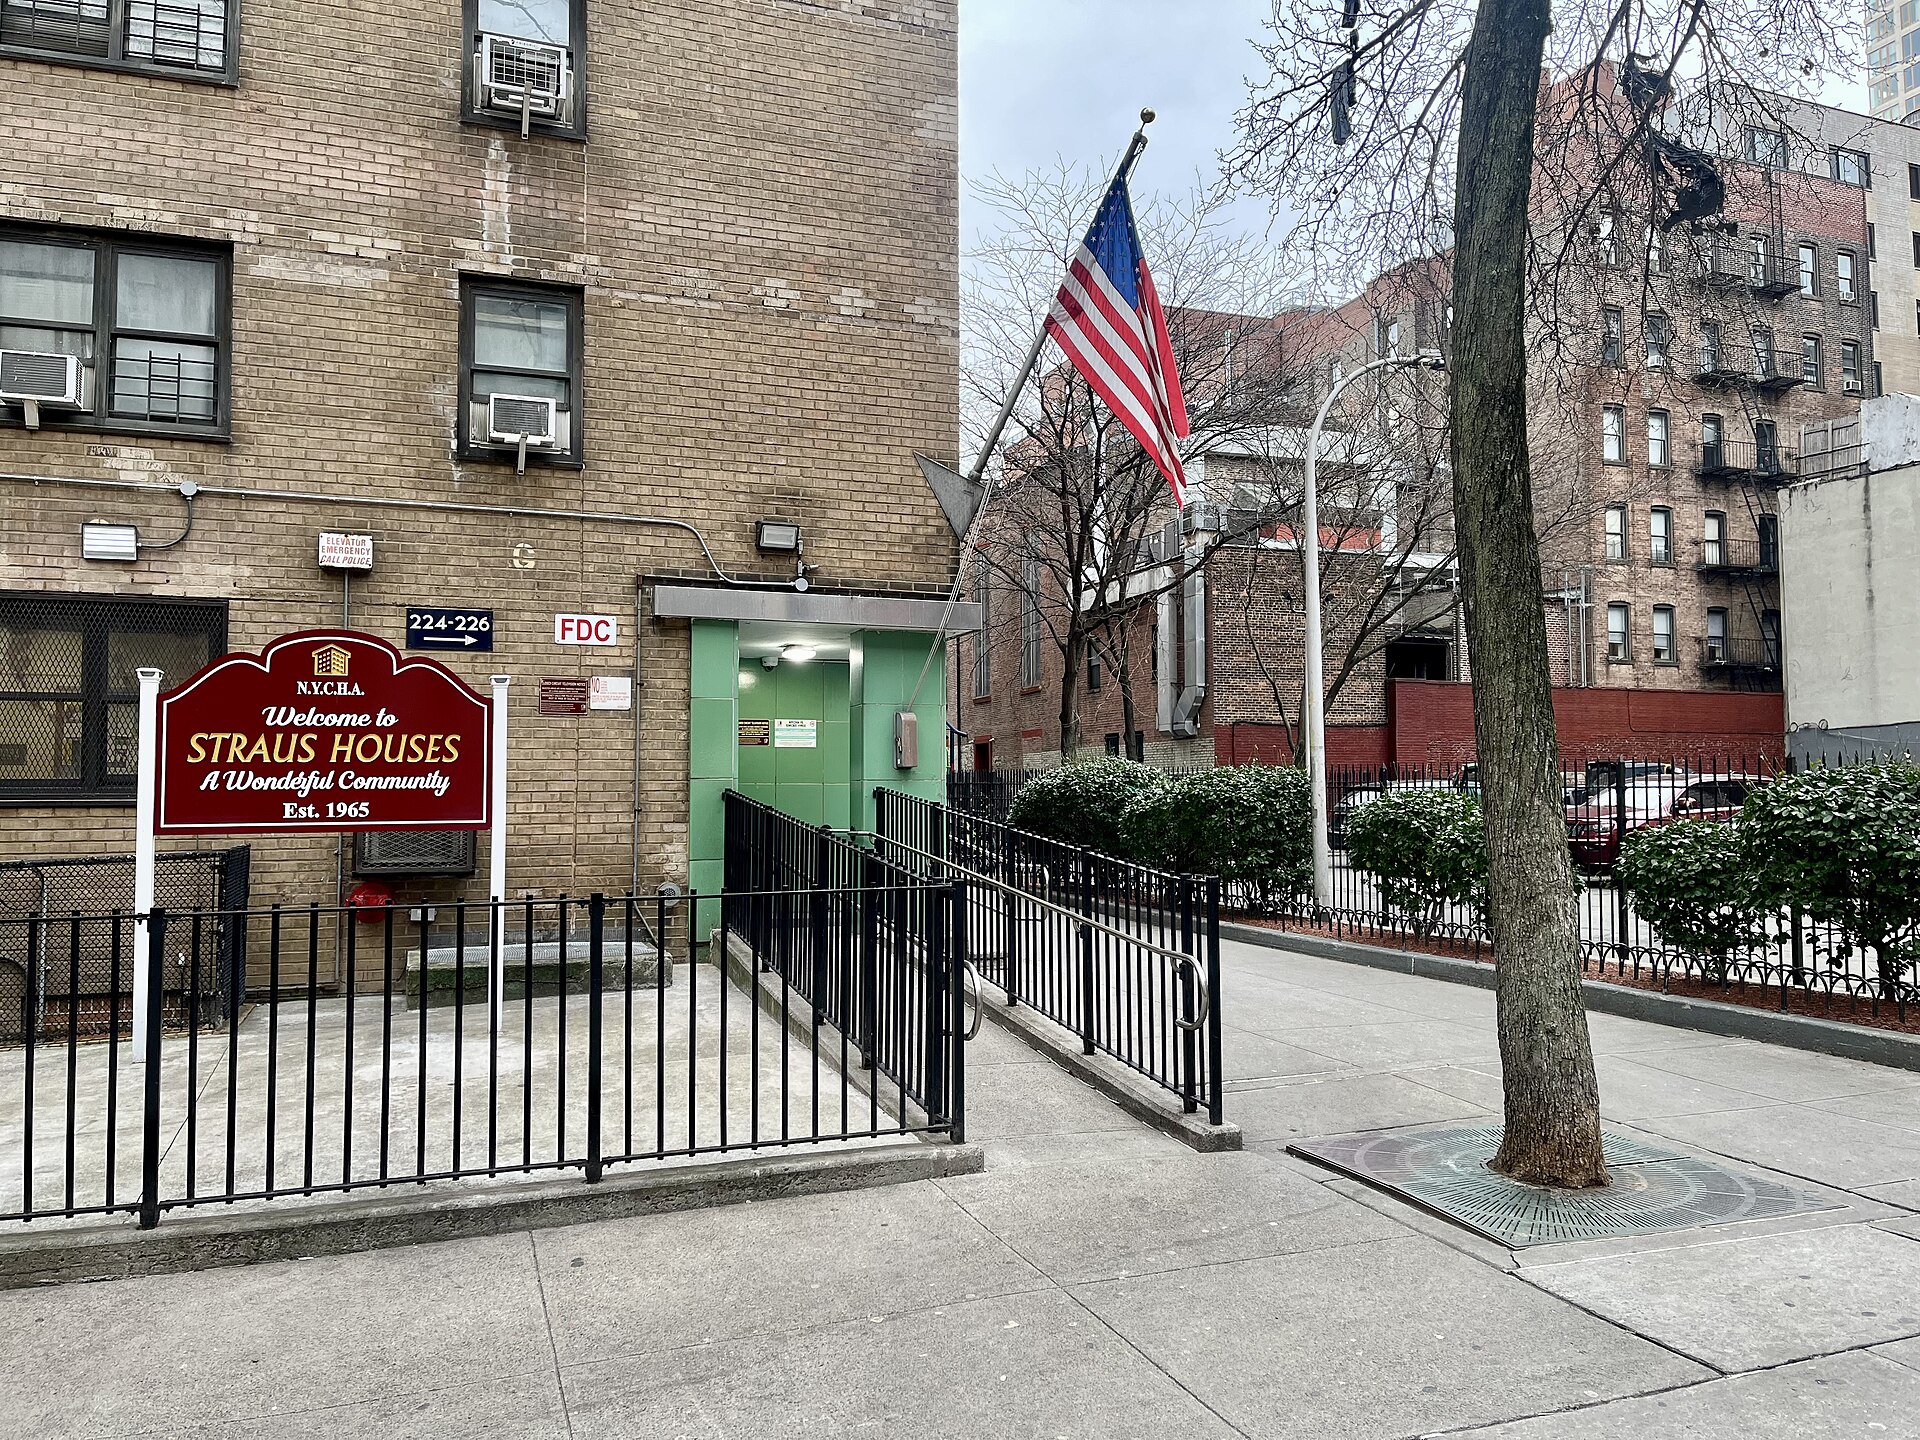

What none of these datasets show
The people still waiting
The Picture's "months on waiting list" is an average for households that were admitted, computed from "the 'date entered waiting list' and the new admission date."3 It says nothing about the people still on a list, the people whose names were removed for not answering a letter, or the people who never applied because a list was closed. Housing authorities manage their own lists under HUD rules (24 CFR 982.204 for vouchers, 24 CFR 960.206 for public housing preferences); they may close a list when it is long enough, purge it by mail, and give preferences to local residents, the elderly, people with disabilities, veterans or others as their plans state.2021 No Idaho agency is required to publish a count, and the counts that are published are not comparable, as lesson 03 explains. A short average wait can mean a short list, a list that was recently purged, or a list that was closed for years.
People turned away, and people who leave
The Picture counts households on the snapshot date. It does not count applicants found ineligible, voucher holders whose vouchers expired before they found a landlord (lesson 07 covers the search term), or households that left, whether for a better job, a nursing home, an eviction or a death. Move-out reasons are recorded on HUD forms but not published in the Picture. The only turnover signal is the share who moved in within the past year (14 percent in Idaho in 2025) and the average time since move-in (84 months).1
Programs outside HUD and USDA
Tribal housing under the Native American Housing Assistance and Self-Determination Act, HOME-funded rental units without other subsidy, city-funded units such as those built on Boise's housing land trust, permanent supportive housing funded through the Continuum of Care, and emergency rental aid are all outside the Picture.8 Lesson 08 covers homelessness programs and lesson 06 the money behind each program. A full count of "everyone served by affordable housing in Idaho" does not exist in any one public dataset, and adding the datasets together double counts households that hold a voucher in a tax credit or USDA property.42
Pictures, Numbers and Infographics
The lesson's main numbers in one table, with the matching national or comparison figure.
| Measure | Idaho | U.S. or comparison | Place, year | Source |
|---|---|---|---|---|
| HUD-subsidized units available | 12,942 | 5,132,918 (U.S.) | Dec. 31, 2025 | HUD Picture 202514 |
| Occupied units (households) | 11,165 | 4,471,285 | Dec. 31, 2025 | HUD Picture 202514 |
| People in HUD-assisted homes | 21,229 | 8,860,364 | Dec. 31, 2025 | HUD Picture 202514 |
| Assisted households as share of all households (our calculation) | 1.6% | not computed | Idaho, 2025 and 2020 to 2024 | HUD Picture; ACS12 |
| Vouchers' share of HUD-assisted units | 62.3% | 54.5% (2,797,793 of 5,132,918, our division) | 2025 | HUD Picture 202514 |
| Average household income | $17,469 | $18,483 | 2025 | HUD Picture 202514 |
| Below 30% of area median | 75% | 79% | 2025 | HUD Picture 202514 |
| Head or spouse 62 or older | 45% | 43% | 2025 | HUD Picture 202514 |
| Same, 2010 | 28% | Idaho 2025: 45% | Idaho | HUD Picture 201022 |
| All persons with a disability | 36% | 24% | 2025 | HUD Picture 202514 |
| Hispanic head, assisted / Hispanic residents | 10% / 14.8% | U.S.: 20% / 20.5% | 2025 | HUD Picture; Census Vintage 20251519 |
| Jerome County Hispanic head / residents | 12% / 42.3% | Canyon County: 27% / 27.0% | 2025 | HUD county file; Census75 |
| Months waited (new admissions) | 20 | 25 | 2025 | HUD Picture 202514 |
| Months since move-in | 84 | 123 | 2025 | HUD Picture 202514 |
| HUD pays per unit per month | $808 | $1,135 | 2025 | HUD Picture 202514 |
| Real change in average income, 2010 to 2025 (our calculation) | +7.1% | nominal +58.3% | Idaho, December 2025 dollars | HUD Picture; BLS CPI-U2225 |
| LIHTC tenant median income | $26,000 | $18,600 | 2024 tables | HUD LIHTC tables39 |
| LIHTC heads with race or ethnicity not reported | 18.5% | 44.3% | 2024 tables | HUD LIHTC tables36 |
| USDA Section 515 households, average adjusted income | 3,585, $15,529 | Section 514: 149, $26,165 | Idaho, October 2023 | USDA occupancy statistics1032 |
Common mistakes
- Reading the wait as the waitlist. The Picture's 20-month average is for people admitted; it is not the length of anyone's list and it leaves out everyone still waiting. HUD's dictionary defines it from the date entered on the list to the admission date.3
- Treating voucher "units" as apartments. For vouchers, "units available" counts voucher slots under contract and "occupied" counts those in use. An 83 percent "occupancy" in the voucher program does not mean 17 percent of apartments sat empty.13
- Comparing heads with people. HUD reports the race, ethnicity and age of household heads (and spouses for age); the Census Bureau counts every resident. Comparing 10 percent Hispanic heads with 14.8 percent Hispanic residents overstates the gap, because children are a larger share of Idaho's Hispanic population (27.7 percent of Hispanic Idahoans were under 15 on July 1, 2025, compared with 17.3 percent of non-Hispanic Idahoans, our calculation).15
- Mixing 62 and 65. HUD's elderly line is 62; most Census tables use 65. A "45 percent elderly" HUD figure and an "18.7 percent 65-plus" Census figure are not the same measure.125
- Treating income as a percent of median as a county median. The "24 percent of median" column is average household income as a percent of HUD's area median family income for the household's area, which is a family median adjusted by HUD, not the county's median household income from the Census.3
- Averaging suppressed codes. The values -1, -4 and -5 in HUD's files mean missing, suppressed or non-reporting. Ada County Housing Authority's 10 public housing units show -4 in every column; averaging those as numbers produces nonsense.36
- Assuming the Picture counts every subsidized home. Tax credit, USDA, tribal, HOME and city-funded units are outside it, and a voucher holder in a tax credit apartment is counted once, as a voucher household.842
- Comparing averages across years without inflation. Average income rose 58 percent from 2010 to 2025 in current dollars but about 7 percent after inflation.2225
- Reading the LIHTC tables as complete. Idaho reported disability status for 7.5 percent of tax credit households and income limits for 25.6 percent; percentages calculated from those few cases may not describe the whole program.3740
What we know, what we don't, and what the data can show
What we know
- At the end of 2025, 11,165 Idaho households (21,229 people) lived in HUD-assisted homes, in 12,942 subsidized units; 62 percent of the units were vouchers.1
- Those households averaged $17,469 in income, 24 percent of area median; 75 percent were below 30 percent of median; 18 percent lived mainly on wages.1
- 45 percent were headed by someone 62 or older, up from 28 percent in 2010; 36 percent of the people in them had a disability, up from 25 percent.221
- New admissions had waited an average of 20 months, from 8 months at Pocatello's agency to 30 months at the Southwestern Idaho Cooperative Housing Authority.6
- In Jerome, Gooding, Lincoln and Minidoka counties, Hispanic households are a far smaller share of HUD-assisted heads than Hispanic people are of residents; in Canyon County the shares match.75
- Idaho's 3,585 USDA Section 515 households in October 2023 were two-thirds elderly or disabled, with an average adjusted income of $15,529.1044
What we don't know
- How many Idahoans are on housing waiting lists, and how many are on more than one; no agency or state office publishes a combined count.
- Why Idaho's voucher program shows 1,363 fewer occupied "units" than available ones (8,065 minus 6,702, our subtraction), and how much of that is funding, landlord acceptance or the search term.1
- Why the Hispanic share of assisted heads is so low in the rural Magic Valley counties, and how much each candidate explanation contributes.
- How many tax credit tenants in Idaho have a disability, because the state reported disability status for 7.5 percent of households.37
- Where households go when they leave assisted housing and why; HUD does not publish move-out reasons in the Picture.
- How many households appear in more than one dataset (for example a voucher holder in a tax credit or USDA property).
What the data can show
- Who lives in each building. The Picture's project file gives income, age, disability, ethnicity and tenure for every public housing development and HUD multifamily property, as in the Magic Valley table above.29
- Trends by agency. The PHA files from 2004 on let anyone follow one housing authority's waits, turnover and household mix year by year.827
- Who is served compared with who is poor. Pair the Picture's county file with Census Bureau county estimates and ACS poverty tables to compare the assisted population with the eligible population, with the head-versus-person caution.75
- Rent burden in tax credit housing. HUD's LIHTC Table 10 shows how many tax credit tenants pay more than 30 or 50 percent of income in rent, by state and year.41
- Rural assisted tenants. USDA's annual occupancy statistics give Section 515 and 514 tenants by state, including race, age, gender and rental assistance.10
- Waitlist reality, by request. Housing authority waitlist records (counts by bedroom size, preference category and date applied) can be requested under the Idaho Public Records Act, as lesson 12 explains.
Questions people ask
Is subsidized housing in Idaho mostly families with children?
No. In 2025, 73 percent of Idaho's HUD-assisted households had no children, and 45 percent were headed by someone 62 or older. Families with children were 27 percent, most of them headed by women (23 percent of all households). Vouchers serve more families than other programs (31 percent with children), and Section 202 serves none by design.115
Do people in subsidized housing work?
Wages were the main source of income for 18 percent of Idaho's assisted households in 2025, compared with 24 percent nationally. That figure counts only households where wages are the majority of income, so households with part-time or seasonal work alongside benefits are not counted. With 45 percent of households headed by someone 62 or older and 56 percent of the under-62 households including a disabled head or spouse, roughly one household in four is headed by someone under 62 without a reported disability (our estimate).14
How long do people stay?
The average Idaho household in HUD-assisted housing at the end of 2025 had been there 84 months, or 7 years: 92 months in public housing, 89 in vouchers, 72 in project-based Section 8. Nationally the average was 123 months. These are averages for people still in the program; people who left after a short stay are not in the snapshot, so the figure overstates how long a typical new household will stay.14
How much do tenants pay, and how much does HUD pay?
The average Idaho household paid $433 a month toward rent and utilities at the end of 2025, and HUD paid an average of $808 per occupied unit. For vouchers the split was $456 and $946; for public housing $411 and $326.1 Rent rules are set by 42 U.S.C. 1437a: the highest of 30 percent of adjusted income, 10 percent of gross income or the welfare rent, with a minimum rent of up to $50.12 Lesson 02 works through a sample rent calculation.
Why does my county look so different from the state?
Because of what was built there. A county whose HUD units are mostly senior complexes, like Gooding (70 percent elderly-headed) or Lincoln (81 percent), will look old and small; one with more vouchers, like Canyon or Bonneville, will have more families with children. Check the county's project list in the Picture's project file before drawing conclusions.729
Where can I get these numbers for my own city or housing authority?
HUD's Picture of Subsidized Households page offers the files for the nation, states, metro areas, counties, cities, ZIP codes, Census tracts, housing authorities and individual projects, plus a query tool and an API. The files are free and need no account; the API requires a free account and access token.813 Lesson 12 walks through downloading and filtering them, and the site's Data and Statistics course covers working with averages and percentages.
Are undocumented immigrants in subsidized housing?
Federal law limits HUD rental assistance to citizens and noncitizens with eligible immigration status (42 U.S.C. 1436a). A "mixed family" with at least one eligible member can live in assisted housing, but its assistance is prorated so that ineligible members are not subsidized (24 CFR 5.520).3031 The Picture does not report immigration status.
Hard questions
Should rental aid come with work requirements or time limits?
The case for: Supporters argue that rental aid should be temporary help for working-age adults, that work expectations raise earnings and free up assistance for people on waiting lists, and that Idaho's 20-month average wait and 84-month average stay show how few openings turn over each year. The case against: Opponents argue that most assisted households are elderly or disabled and already exempt from any reasonable work rule, that the paperwork of proving exemptions can push eligible people out, and that rent already rises with earnings at 30 percent of adjusted income. What the evidence shows: In Idaho's 2025 Picture, about 24 percent of assisted households were headed by someone under 62 without a disabled head or spouse (our estimate from HUD's columns), and 18 percent lived mainly on wages. The Picture cannot say how many of the remaining households could work or how many already do part-time. The Medicaid course's lesson on the 2027 work requirements shows how a similar rule is being set up in Idaho's health coverage program.1
Is the shift toward seniors and people with disabilities the right one?
One view: Older and disabled Idahoans on fixed incomes have the fewest ways to raise their income, and Section 202, Section 811 and senior public housing were built for them. Another view: Families with children face the largest rent increases for larger units and the most harm from unstable housing, yet their share of assisted households fell from 35 percent female-headed with children in 2010 to 23 percent in 2025. What the evidence shows: The mix is set partly by Congress (which programs get money), partly by what was built decades ago, and partly by each authority's admission preferences in its annual plan. The data show the shift; the plans show the choices.22120
Is the Magic Valley's Hispanic gap a fair housing problem?
One view: A gap as large as 12 percent of assisted heads against 42.3 percent of residents in Jerome County deserves a look at outreach, language access, preferences and landlord acceptance of vouchers. Another view: Age structure (only 4.6 percent of Jerome County's Hispanic residents were 65 or older in 2025, against 22.2 percent of non-Hispanic residents, our calculation), a senior-heavy assisted stock, federal immigration-status rules and the presence of USDA farm labor housing could explain much of the gap without any unfair treatment. What the evidence shows: The published data can establish the size of the gap but not its cause. Waitlist records by ethnicity, which are requestable, would show whether Hispanic households apply in proportion and whether they are admitted at the same rate as other applicants.753032
Vouchers or buildings?
For vouchers: They let households choose where to live and move with the family, and they are most of Idaho's HUD aid (62 percent of units). For buildings: Project-based Section 8, public housing and 202 properties guarantee units in towns where landlords may not accept vouchers, and they cost HUD less per unit per month in Idaho ($326 for public housing and $682 for project-based Section 8, against $946 for vouchers). What the evidence shows: The Picture's per-unit costs are not full costs (public housing figures cover current operating and capital subsidy for buildings paid for long ago, and many buildings also carry costs the Picture does not count, such as tax credits), and voucher utilization below 100 percent means some authorized aid is not reaching households. Lesson 06 compares the funding streams.13
For reporters and advocates
Records that exist. HUD's Picture of Subsidized Households files for 1993, 1996 to 1998, 2000 and every year since 2004, at the state, county, city, tract, housing authority and project level; the data dictionaries for each year; HUD's LIHTC tenant tables by state; USDA's annual multifamily occupancy statistics; each housing authority's annual and five-year plans, which list admission preferences and waitlist status; board packets and minutes; and audits on the Federal Audit Clearinghouse.83510 Lesson 04 lists each Idaho agency, and lesson 12 explains how to read the plans and audits.
Questions to ask.
- To each housing authority: how many households are on each waiting list today, by program, bedroom size, preference and ethnicity, when the list last opened and closed, and how many names were removed in the last purge?
- To the Idaho Housing and Finance Association: why were 3,150 of its 4,017 voucher slots in use at the end of 2025, and what is the current lease-up rate and average search time?
- To the Southwestern Idaho Cooperative Housing Authority: what changed between 2020 (55-month average wait) and 2025 (30 months)?
- To Magic Valley housing providers: what share of applicants are Hispanic, what share are admitted, and what language access is offered?
- To the owners of Valley Vista Village, Kimberly Sunset Manor and other project-based buildings: when do their HUD contracts expire, and what happens to tenants if a contract is not renewed? (Lesson 03 covers expiring contracts.)
- To the Idaho Housing and Finance Association as the tax credit agency: why is disability status reported for only 7.5 percent of tax credit households, and can the agency publish property-level tenant data?
Getting records. Housing authorities are public agencies, and their waitlist statistics, plans and board records can be requested under the Idaho Public Records Act, Idaho Code Title 74, Chapter 1 (see the site's course on Idaho Public Records Requests). Ask for counts, not names: applicant and tenant identities are private, and stories should never identify a voucher holder or tenant without consent. Federal records from HUD can be requested under the Freedom of Information Act, and lesson 12 and Part C, How to Report on Housing, cover both.
The Magic Valley angle. The Twin Falls area's HUD-assisted stock is small and named: three public housing complexes (Duvall in Twin Falls, Heritage Homes in Jerome, Lincoln Courts in Buhl) and eight project-based Section 8 buildings, plus households using vouchers.29 Jerome County, where 42.3 percent of residents are Hispanic and 12 percent of assisted household heads are, is the clearest case in Idaho of a gap that public records could explain. HUD's contact list gives the same contact email and phone number for the Jerome and Twin Falls authorities; ask whether the two are managed together and how their waitlists work.2657
Where to go next
- HUD User: Assisted Housing, National and Local (Picture of Subsidized Households): Free HUD download page and query tool for the Picture at every level from the nation to a single property; no account needed. Pick a year and level, download the XLSX, and filter to Idaho.
- HUD User: Picture of Subsidized Households API: Programmatic access to recent Picture years for people who build data tools; the page explains how to get access.
- HUD User: LIHTC Tenant Data: Free state-by-state tables on tax credit tenants for 2018, 2019 and 2021 to 2024, with documentation of what each state reported.
- Census Bureau QuickFacts: Idaho: Free one-page profile of population, age, race and Hispanic origin, income and housing for Idaho and its counties, for comparison with the assisted population.
- Housing Assistance Council: USDA Multi-Family Fair Housing Occupancy Reports: A national rural housing nonprofit that posts USDA's annual occupancy statistics for Section 515 and 514 housing by state; free.
- HUD PHA Contact Information report, Idaho: Free HUD list of every Idaho public housing agency with its HUD code, address, phone and program type; use it to find the agency behind a row in the Picture.
Still being checked (6 items)
These points could not be fully confirmed against a primary source when this lesson was written and fact checked in November 2026. The text above states each one as uncertain.
- The 2025 data dictionary does not define subsidized units available and occupied separately for vouchers; the lesson's reading of the voucher gap (6,702 occupied of 8,065) as vouchers in use versus vouchers under contract is stated as a plausible interpretation, not a HUD statement, and its causes are not confirmed.
- Why the Nampa Housing Authority (ID002), listed in HUD's January 2025 contact report and in the 2020 Picture with 67 units, has no rows in the 2025 Picture was not confirmed; lesson 04 covers each agency's status.
- The date and reason for the Pocatello agency's name change to Housing Alliance and Community Partnerships were not confirmed; its website confirms only the former names.
- The town for Balanced Rock Townhouses (HUD place code 13240) and the counties covered by HUD's CBSA code 46300 were not confirmed; the lesson does not name them.
- The USDA October 2023 occupancy statistics were read from the copy posted by the Housing Assistance Council; a copy on a USDA website was not located. The meaning of the USDA elderly table's middle columns (labeled ELD/DISABLED and ELD H/C) is taken from their labels.
- Reasons for the Hispanic gap in the Magic Valley (age, program mix, immigration status rules, other programs, who applies) are presented as possible explanations; no source measures their contributions.
Last verified November 20, 2026. General education, not legal, tax, financial or real estate advice; every figure names its source and year in the Notes and Sources below. Data is revised: check the newest release before relying on any number.
Notes
- U.S. Department of Housing and Urban Development (HUD), Office of Policy Development and Research, Picture of Subsidized Households: 2025, state file STATE_2025_2020census.xlsx, rows for Idaho (state code 16), snapshot dated 31DEC2025, programs 1 (Summary of All HUD Programs), 2 (Public Housing), 3 (Housing Choice Vouchers, tenant-based and project-based), 5 (Project Based Section 8), 8 (202/PRAC) and 9 (811/PRAC); file dated Feb. 18, 2026 on the HUD server. Shares and conversions in the text are our calculations from these rows (read Nov. 20, 2026). Read it online. ↩
- U.S. Census Bureau, QuickFacts, Idaho: households, 2020 to 2024, 713,005; median household income (in 2024 dollars), 2020 to 2024, $77,800; persons per household 2.64 (American Community Survey 5-year estimates) (read Nov. 20, 2026). Read it online. ↩
- HUD, Picture of Subsidized Households 2025: Data Dictionary (definitions of subsidized units available, occupied, average family expenditure, average HUD expenditure per unit-month, percent of local median, months on waiting list, months since moved in, and the codes -1 missing, -4 suppressed for fewer than 11 reported families, -5 non-reporting) (read Nov. 20, 2026). Read it online. ↩
- HUD, Picture of Subsidized Households: 2025, U.S. total file US_2025_2020census.xlsx, all program rows, snapshot 31DEC2025 (read Nov. 20, 2026). Read it online. ↩
- U.S. Census Bureau, Vintage 2025 county population estimates by age, sex, race and Hispanic origin, Idaho, file CC-EST2025-ALLDATA-16, YEAR 7 (July 1, 2025): TOT_POP, H_MALE plus H_FEMALE (Hispanic), NHWA (non-Hispanic white alone) and age groups 14 to 18 (65 and over). Shares are our calculation; Idaho total 2,029,733 residents (read Nov. 20, 2026). Read it online. ↩
- HUD, Picture of Subsidized Households: 2025, public housing agency file PHA_2025_2020census.xlsx, Idaho agencies ID001, ID005, ID010, ID011, ID012, ID013, ID016, ID021 and ID901, all program and sub-program rows, snapshot 31DEC2025 (read Nov. 20, 2026). Read it online. ↩
- HUD, Picture of Subsidized Households: 2025, county file COUNTY_2025_2020census.xlsx, Summary of All HUD Programs rows for Ada (16001), Bannock (16005), Blaine (16013), Bonneville (16019), Canyon (16027), Cassia (16031), Gooding (16047), Jerome (16053), Kootenai (16055), Lincoln (16063), Minidoka (16067), Nez Perce (16069) and Twin Falls (16083) counties (read Nov. 20, 2026). Read it online. ↩
- HUD User, "Assisted Housing: National and Local" (Picture of Subsidized Households download page, revised Feb. 17, 2026): the three categories of HUD assistance; "Picture of Subsidized Households does not cover other housing subsidy programs" such as the U.S. Department of Agriculture's Rural Housing Service; Indian Housing, HOME and CDBG are also excluded; files for 1993, 1996 to 1998, 2000 and 2004 to 2025, plus a 1970s archive; the API requires an account and access token (read Nov. 20, 2026). Read it online. ↩
- HUD, 2024 LIHTC Tenant Tables (posted October 2026), Tables 1 and 2: Idaho, 236 active properties with 10,071 units in the placed-in-service database and 232 properties with 9,961 units in the tenant submission; 89.4 percent of properties matched (read Nov. 20, 2026). Read it online. ↩
- USDA Rural Development, Rural Housing Service, Multi-Family Housing Occupancy Statistics Report as of October 2023, transmitted to Rural Development employees by Administrator Joaquin Altoro by memo dated Feb. 20, 2024: Section 515 Housing, Adjusted Income/Household and Adjusted Income/Unit and Occupancy Rate tables, Idaho (150 projects, 3,728 units, 3,585 households, 4,107 tenants, average adjusted income $15,529, 3,317 rental assistance households, average rental assistance household income $14,063, occupancy 96.76 percent). Copy posted by the Housing Assistance Council, a national nonprofit (read Nov. 20, 2026). Read it online. ↩
- HUD, Picture of Subsidized Households 2021: Data Dictionary: "# Reported" is the number of households for which Form HUD-50058 or Form HUD-50059 reports were received; program codes include Public Housing, Housing Choice Vouchers, Moderate Rehabilitation, Project Based Section 8, RentSup/RAP, S236/BMIR, 202/PRAC and 811/PRAC (read Nov. 20, 2026). Read it online. ↩
- 42 U.S.C. 1437a: (a)(1) rent is the highest of 30 percent of monthly adjusted income, 10 percent of monthly income, or the welfare rent; (a)(3) minimum rent of not more than $50 a month with hardship exemptions; (b)(2)(C) extremely low-income families have incomes at or below the higher of the poverty guideline or 30 percent of area median income; (b)(3)(D) an elderly person is at least 62 (read Nov. 20, 2026). Read it online. ↩
- HUD User, Picture of Subsidized Households application programming interface (API) page (read Nov. 20, 2026). Read it online. ↩
- 42 U.S.C. 1437f (Section 8 of the U.S. Housing Act of 1937), including subsection (o), the Housing Choice Voucher program, and its limit that a family's share of rent at initial lease-up may not exceed 40 percent of monthly adjusted income when the gross rent exceeds the payment standard (read Nov. 20, 2026). Read it online. ↩
- 12 U.S.C. 1701q, Supportive Housing for the Elderly (Section 202 of the Housing Act of 1959, as amended), including project rental assistance contracts for very low-income elderly persons (read Nov. 20, 2026). Read it online. ↩
- 42 U.S.C. 8013, Supportive Housing for Persons with Disabilities (Section 811 of the Cranston-Gonzalez National Affordable Housing Act of 1990) (read Nov. 20, 2026). Read it online. ↩
- U.S. Census Bureau, American Community Survey 2020 to 2024 5-year estimates, Table DP03, Selected Economic Characteristics: median household income, United States $80,734 and Idaho $77,800 (2024 dollars), as used in Part A, lesson 08 (read Nov. 20, 2026). Read it online. ↩
- 42 U.S.C. 1437n (income targeting, added by Pub. L. 105-276, the Quality Housing and Work Responsibility Act of 1998, section 513): at least 40 percent of public housing units made available each fiscal year go to extremely low-income families; at least 75 percent of families newly admitted to tenant-based vouchers each fiscal year must be extremely low income; at least 40 percent of units that become available in each project-based Section 8 project go to extremely low-income families (read Nov. 20, 2026). Read it online. ↩
- U.S. Census Bureau, Vintage 2025 state population estimates by age, sex, race and Hispanic origin, file SC-EST2025-ALLDATA6 (released June 2026): United States 65-and-over share 18.9 percent and Hispanic share 20.5 percent on July 1, 2025, as summed and fact checked for Part A, lesson 08 of this series (read Nov. 20, 2026). Read it online. ↩
- 24 CFR 982.204, Housing Choice Voucher waiting list: administration of waiting list, selection, preferences and removal of applicants (read Nov. 20, 2026). Read it online. ↩
- 24 CFR 960.206, public housing waiting list: local preferences in admission (read Nov. 20, 2026). Read it online. ↩
- HUD, Picture of Subsidized Households: 2010, state file STATE_2010.xlsx, Idaho rows (Summary of All HUD Programs, Public Housing, Housing Choice Vouchers, Multi-Family Other); figures with decimals rounded by us (read Nov. 20, 2026). Read it online. ↩
- HUD, Picture of Subsidized Households: 2015, state file STATE_2015.xlsx, Idaho rows (read Nov. 20, 2026). Read it online. ↩
- HUD, Picture of Subsidized Households: 2020, state file STATE_2020.xlsx (Census 2010 geography), Idaho rows (read Nov. 20, 2026). Read it online. ↩
- U.S. Bureau of Labor Statistics, Consumer Price Index for All Urban Consumers (CPI-U), U.S. city average, all items, not seasonally adjusted, series CUUR0000SA0: December 2010 219.179, December 2015 236.525, December 2025 324.054, annual average 2025 321.943, retrieved through the BLS public data API (read Nov. 20, 2026). Read it online. ↩
- HUD Office of Public and Indian Housing, "PHA Contact Information" report for Idaho, drawn from the IMS/PIC system (file dated Jan. 10, 2025): lists ID001 Twin Falls Housing Authority, ID002 Nampa Housing Authority, ID005 Housing Alliance and Community Partnerships (Pocatello), ID010 Buhl, ID011 Jerome, ID012 American Falls, ID013 Boise City Housing Authority, ID016 Southwestern Idaho Cooperative Housing Authority (Middleton), ID021 Ada County Housing Authority and ID901 Idaho Housing and Finance Association, with program type (low-rent, Section 8 or combined) (read Nov. 20, 2026). Read it online. ↩
- HUD, Picture of Subsidized Households: 2020, public housing agency file PHA_2020.xlsx, Idaho agencies, Summary of All HUD Programs rows (includes Nampa Housing Authority, ID002, 67 units, and the Housing Authority of the City of Pocatello, ID005) (read Nov. 20, 2026). Read it online. ↩
- Housing Alliance and Community Partnerships, "About HACP": formerly known as the Housing Authority of the City of Pocatello and the Pocatello Housing Authority; founded 1968; serves the Pocatello and Chubbuck communities and southeast Idaho (read Nov. 20, 2026). Read it online. ↩
- HUD, Picture of Subsidized Households: 2025, project file PROJECT_2025_2020census.xlsx, Idaho projects in the Twin Falls core-based statistical area (CBSA 46300): Duvall (ID001000001), Lincoln Courts (ID010000001), Heritage Homes (ID011000001), Cherrywood, Kimberly Sunset Manor, Meadowbrook, South Meadow Apartments, Syringa Estates, Valley Vista Village, Windwood and Balanced Rock Townhouses (details suppressed). Idaho project rows: 112 project-based Section 8, 12 Section 202/PRAC and 7 Section 811/PRAC projects (read Nov. 20, 2026). Read it online. ↩
- 42 U.S.C. 1436a (Section 214 of the Housing and Community Development Act of 1980), restriction on use of assisted housing by noncitizens who are not in an eligible immigration status (read Nov. 20, 2026). Read it online. ↩
- 24 CFR 5.520, proration of assistance for "mixed families" in which some members have eligible immigration status and some do not (part 5, subpart E) (read Nov. 20, 2026). Read it online. ↩
- USDA Rural Development, Multi-Family Housing Occupancy Statistics Report as of October 2023, Section 514 Farm Labor Housing tables, Idaho: 6 projects, 159 units, 149 households, 223 tenants and co-tenants, 257 minors, average adjusted income $26,165, occupancy 96.13 percent, Hispanic 92 households (61.74 percent) (read Nov. 20, 2026). Read it online. ↩
- USDA Rural Development, Multi-Family Housing Occupancy Statistics Report as of October 2023, Section 515 Housing, National Origin Percentage table, Idaho: white 2,934 households (81.84 percent), Hispanic 482 (13.4 percent) (read Nov. 20, 2026). Read it online. ↩
- 42 U.S.C. 1437z-8, added by the Housing and Economic Recovery Act of 2008, Pub. L. 110-289, div. B, title VIII, section 2835(d): each state agency that administers tax credits under 26 U.S.C. 42 must furnish HUD, not less than annually, the race, ethnicity, family composition, age, income, use of rental assistance, disability status and monthly rental payments of households in each credit property (read Nov. 20, 2026). Read it online. ↩
- HUD User, "LIHTC Tenant Data" page: tenant tables by state for 2018, 2019 and 2021 to 2024; notes that most of the information was collected by state housing finance agencies for compliance and that some agencies have not fully adopted HUD's standards for demographic data (read Nov. 20, 2026). Read it online. ↩
- HUD, 2024 LIHTC Tenant Tables, Table 4, Race/Ethnicity of Heads of Household, Idaho and U.S. total (read Nov. 20, 2026). Read it online. ↩
- HUD, 2024 LIHTC Tenant Tables, Tables 5 and 6, Disability Status: Idaho reported disability status for at least one member in 7.5 percent of households (read Nov. 20, 2026). Read it online. ↩
- HUD, 2024 LIHTC Tenant Tables, Table 7, Family Composition: households with at least one member under 18, at least one member 62 or older, and head of household 62 or older, Idaho and U.S. total (read Nov. 20, 2026). Read it online. ↩
- HUD, 2024 LIHTC Tenant Tables, Table 8, Distribution of Annual Household Income: median income, Idaho $26,000, U.S. total $18,600 (read Nov. 20, 2026). Read it online. ↩
- HUD, 2024 LIHTC Tenant Tables, Table 9, Total Annual Household Income Relative to Derived Area Median Gross Income: Idaho income, income limit and restriction reported for 25.6 percent of households; U.S. 54.2 percent (read Nov. 20, 2026). Read it online. ↩
- HUD, 2024 LIHTC Tenant Tables, Table 10, Tenant-Paid Rent as Percentage of Annual Household Income, Idaho and U.S. total; the share over 30 percent is our sum of the 30.1 to 40, 40.1 to 50 and 50.1-or-greater columns (read Nov. 20, 2026). Read it online. ↩
- HUD, 2024 LIHTC Tenant Tables, Tables 11 and 12, Use of Rental Assistance and Use of Federal Rental Assistance by source, Idaho and U.S. total (read Nov. 20, 2026). Read it online. ↩
- Housing Assistance Council (a national nonprofit that works on rural housing), "USDA Multi-Family Fair Housing Occupancy Report FY 2023": summary of the USDA data as of October 2023, including that about two-thirds of units are occupied by elderly or disabled residents (read Nov. 20, 2026). Read it online. ↩
- USDA Rural Development, Multi-Family Housing Occupancy Statistics Report as of October 2023, Section 515 Housing, Elderly and Handicapped Households table, Idaho: elderly 1,150 (32.08 percent), elderly or disabled 877 (24.46 percent), handicapped 375 (10.46 percent), designated total 2,402 (67 percent), non-elderly 1,183 (33 percent) (read Nov. 20, 2026). Read it online. ↩
- USDA Rural Development, Multi-Family Housing Occupancy Statistics Report as of October 2023, Section 515 Housing, Gender Percentage and Household Members tables, Idaho: female single 1,444, female multi-person 1,002, total single-person 2,212 (61.7 percent); 1,405 minors and 1,657 elders among 4,107 tenants. The female-headed share is our sum (read Nov. 20, 2026). Read it online. ↩
- 24 CFR 5.611, adjusted income: deductions from annual income for dependents, elderly or disabled families, and certain medical, disability assistance and child care expenses (read Nov. 20, 2026). Read it online. ↩
- HUD Office of Public and Indian Housing, "Moving to Work (MTW) - Participating Agencies": Housing Authority of Pocatello (ID), designated 2021, MTW Flexibility for Smaller PHAs Cohort; Twin Falls Housing Authority (ID), designated 2022, Asset Building Cohort (read Nov. 20, 2026). Read it online. ↩
Check yourself
1. According to HUD's Picture of Subsidized Households 2025, about how many Idaho households lived in HUD-assisted units on Dec. 31, 2025?
The Idaho state row shows 12,942 subsidized units, of which 11,165 were occupied; 21,229 is the number of people, not households (HUD Picture 2025, Idaho state file).
2. Which program made up the largest share of Idaho's HUD-assisted units in 2025?
Vouchers were 8,065 of 12,942 units, 62.3 percent (our share from HUD Picture 2025, Idaho state file); public housing was 610 units.
3. What does the Picture's 'months on waiting list' column measure?
HUD's 2025 data dictionary defines it as average months on the waiting list using the date entered on the list and the new admission date, excluding programs that do not report waitlist dates.
4. What share of Idaho's HUD-assisted households in 2025 had a head or spouse 62 or older, and what was it in 2010?
HUD Picture state files: 28 percent in 2010, 30 in 2015, 39 in 2020 and 45 in 2025 for Idaho, Summary of All HUD Programs.
5. Why is comparing HUD's 10 percent Hispanic household heads with the Census Bureau's 14.8 percent Hispanic residents not a like-for-like comparison?
The Picture reports the head of household's ethnicity; the Vintage 2025 estimates count all residents. 27.7 percent of Hispanic Idahoans were under 15 in 2025 vs. 17.3 percent of non-Hispanic Idahoans (our calculation from CC-EST2025-ALLDATA-16).
6. In Jerome County, what were the Hispanic shares of HUD-assisted household heads (2025) and of all residents (July 1, 2025)?
HUD Picture 2025 county file shows 12 percent Hispanic heads in Jerome County; the Census Vintage 2025 county estimates give 42.3 percent Hispanic residents (our calculation). 2 and 34.3 are Gooding County.
7. Under 42 U.S.C. 1437n, at least what share of families newly admitted to tenant-based vouchers each year must be extremely low income?
42 U.S.C. 1437n(b)(1), added by the Quality Housing and Work Responsibility Act of 1998, sets 75 percent for vouchers; the public housing and project-based Section 8 floors are 40 percent.
8. Which program is NOT included in HUD's Picture of Subsidized Households?
HUD's download page says the Picture does not cover other subsidy programs such as USDA's Rural Housing Service, and also excludes Indian Housing, HOME and CDBG; USDA publishes its own occupancy statistics.
9. In HUD's 2024 LIHTC tenant tables, for what share of Idaho tax credit households was disability status reported for at least one member?
Table 5 shows 7.5 percent for Idaho (77.8 percent nationally), so the tables cannot say how many Idaho tax credit tenants have a disability.
10. Adjusted for inflation with the CPI-U, about how much did the average income of Idaho's HUD-assisted households change from 2010 to 2025?
$11,032 in 2010 equals about $16,311 in December 2025 dollars (CPI-U 324.054 / 219.179); $17,469 / $16,311 = 1.071. The 58 percent rise is in current dollars (HUD Picture 2010 and 2025; BLS CUUR0000SA0).
Terms in this lesson
- Picture of Subsidized Households
- HUD's annual dataset describing the households in HUD rental assistance programs (public housing, vouchers, project-based Section 8, Section 202 and 811 and older programs), compiled from tenant certification forms and published by state, county, city, tract, housing authority and project.
- Form HUD-50058
- The family report a public housing agency files for each household in public housing or the voucher program at admission, recertification and other actions; a main source of the Picture.
- Form HUD-50059
- The owner's certification of tenant eligibility, rent and assistance for households in privately owned HUD multifamily housing such as project-based Section 8 buildings; the other main source of the Picture.
- Project-based voucher
- A Housing Choice Voucher that a housing authority attaches to specific units under contract with an owner, so the assistance stays with the unit rather than moving with the family.
- Section 202 (PRAC)
- HUD's Supportive Housing for the Elderly program under 12 U.S.C. 1701q; newer properties receive project rental assistance contracts (PRAC). Households must include a very low-income person 62 or older.
- Section 811 (PRAC)
- HUD's Supportive Housing for Persons with Disabilities program under 42 U.S.C. 8013, financing rental housing with project rental assistance for very low-income adults with disabilities.
- Household head
- The person in whose name the lease or assistance is held; HUD reports race, ethnicity and sex by the head, and age by the older of head and spouse.
- Months since moved in
- In the Picture, the average number of months between a household's admission and the snapshot date, for households still assisted.
- Overhoused
- HUD's term in the Picture for a household with more bedrooms than people (the 2025 data dictionary's definition).
- Suppressed value (-4)
- A code HUD uses in the Picture where fewer than 11 families reported, to protect privacy; -1 means missing and -5 means fewer than half of households reported.
- Mixed family
- Under 24 CFR 5.520, a household in which some members have eligible immigration status and some do not; its HUD assistance is prorated.
- Section 515 and Section 521
- USDA Rural Development's rural rental housing loan program (515) and the rental assistance (521) that lowers rent for many of its tenants; reported in USDA occupancy statistics, not in HUD's Picture.
- Section 514 farm labor housing
- USDA loans (with Section 516 grants) for housing farmworkers and their families; Idaho had 6 such projects with 149 households in October 2023.
- Core-based statistical area (CBSA)
- A metropolitan or micropolitan area defined by the federal Office of Management and Budget around a core city; HUD's files code Twin Falls-area properties to CBSA 46300.
Sources
- HUD, Picture of Subsidized Households 2025, state file (Idaho rows) (2026-11-20) checked 2026-11
- HUD, Picture of Subsidized Households 2025, public housing agency file (2026-11-20) checked 2026-11
- HUD, Picture of Subsidized Households 2025, county file (2026-11-20) checked 2026-11
- HUD, Picture of Subsidized Households 2025, project file (2026-11-20) checked 2026-11
- HUD, Picture of Subsidized Households 2025, U.S. total file (2026-11-20) checked 2026-11
- HUD, Picture of Subsidized Households 2025 data dictionary (2026-11-20) checked 2026-11
- HUD, Picture of Subsidized Households state files 2010, 2015 and 2020 (download page) (2026-11-20) checked 2026-11
- HUD, 2024 LIHTC Tenant Tables (2026-11-20) checked 2026-11
- USDA Rural Development, Multi-Family Housing Occupancy Statistics as of October 2023 (posted by the Housing Assistance Council) (2026-11-20) checked 2026-11
- U.S. Census Bureau, Vintage 2025 county population estimates by age, sex, race and Hispanic origin, Idaho (2026-11-20) checked 2026-11
- U.S. Bureau of Labor Statistics, CPI-U series CUUR0000SA0 (2026-11-20) checked 2026-11
- HUD, PHA Contact Information report, Idaho (2026-11-20) checked 2026-11
- 42 U.S.C. 1437a and 1437n (rent, definitions and income targeting) (2026-11-20) checked 2026-11
- 42 U.S.C. 1437z-8 (LIHTC tenant data collection) (2026-11-20) checked 2026-11
- HUD, Moving to Work participating agencies (2026-11-20) checked 2026-11