Lesson 8 of 10 · about 23 minutes
Supply-Side Economics, Thomas Sowell and Walter Williams
You'll be able to
- Explain the supply-side claim about marginal tax rates and the logic of the Laffer curve
- Describe what the 1981 and 1986 tax laws did, with their votes and main provisions
- Summarize what Treasury, CBO and the Joint Committee on Taxation found about whether tax cuts pay for themselves
- Describe Thomas Sowell's constrained and unconstrained visions and his approach in Basic Economics and Knowledge and Decisions
- State Walter Williams's argument in The State Against Blacks about minimum wages and licensing, and the evidence for and against it
In a case at the National Museum of American History sits a white cloth napkin, fifteen inches square. Across it, in a looping hand, Arthur Laffer drew a curve and wrote: "If you tax a product less results. If you subsidize a product more results. We've been taxing work, output and income and subsidizing non-work, leisure and unemployment. The consequences are obvious!" At the bottom: "To Don Rumsfeld at our Two Continents Rendezvous 9/13/74 Art B. Laffer." The museum's credit line reads "Gift of Patricia Koyce Wanniski."1
It may be the most famous napkin in American politics. It may also be a souvenir made years after the fact. That small dispute is a good way into a large one, because supply-side economics has always been part sound idea and part legend, and the two take some work to tell apart. Two other economists of the same era, Thomas Sowell and Walter Williams, built careers on a related habit: asking what policies actually do to the people they are meant to help.
A napkin with a disputed date
The story as usually told goes like this. In 1974, at the Two Continents restaurant in the Hotel Washington, Laffer met with the financial journalist Jude Wanniski and with two advisers in the Ford White House, Donald Rumsfeld and Dick Cheney. To make his point about tax rates, Laffer took a marker and sketched his curve on a napkin.2
In October 2017 Binyamin Appelbaum of The New York Times took the museum's napkin apart. The original was paper, people who were there said, and this one is cloth. The date on it falls before the November 1974 midterm elections, while the meeting came after them. Grace-Marie Turner, then Grace-Marie Arnett, who attended, told him the meeting came after the elections and "I absolutely know that it was a paper cocktail napkin." Cheney's memoir also puts the meeting after the midterms. Wanniski, in an account published in June 2005, shortly before his death, wrote that the curve went on a cocktail napkin in December 1974 and specifically denied that Rumsfeld was present. His widow found the cloth napkin in a drawer after he died.3
Laffer himself was candid. "I believe that this is the napkin that Jude Wanniski asked me to do for him," he told Appelbaum, and of the original: "There was a napkin done and I don't know where it ended; I guess it was probably in the trash." Rumsfeld's 2011 memoir records a dinner with Laffer and Cheney on September 16, 1975, at which Laffer drew a curve on a napkin, which may explain the dedication. The museum's curator, Peter Liebhold, stood by the object: "As you know, oral history is wonderful but subject to problems."3 Laffer has also said, in an interview recounted by Smithsonian, that he remembered telling the officials that a tax cut might bring in more revenue than expected: "You may get 4 percent more revenue, you might get 3."2 Even in the legend, the claim was modest.
Mundell, Laffer and Wanniski
Supply-side economics came from a small circle in the early 1970s. Its most distinguished member was Robert Mundell, born October 24, 1932, in Kingston, Ontario. Mundell joined Columbia University's economics department in 1974 and stayed forty years. In the 1970s he developed what became known as supply-side economic policy, which the Reagan administration put into practice in the 1980s. He later became an important advocate of the euro, and he died in April 2021 at 88.4 The Nobel committee gave him the 1999 prize "for his analysis of monetary and fiscal policy under different exchange rate regimes and his analysis of optimum currency areas," work only loosely tied to the tax debates.5
Arthur Betz Laffer was born August 14, 1940, in Youngstown, Ohio. He took a Yale BA in 1963 and a Stanford PhD in 1972, was the first chief economist of the Office of Management and Budget under George Shultz from 1970 to 1972, and taught at the University of Chicago and then the University of Southern California. He sat on President Reagan's Economic Policy Advisory Board for both terms, and President Trump gave him the Presidential Medal of Freedom on June 19, 2019.6 Laffer never claimed to have invented the idea named for him. He said he learned it from the fourteenth-century historian Ibn Khaldun and from John Maynard Keynes. The name "Laffer curve" was Wanniski's, and it was Wanniski's journalism, including an essay in The Public Interest in 1978, that carried it to politicians.7
The idea in plain terms
James Gwartney of Florida State, a former chief economist of Congress's Joint Economic Committee, states the core supply-side claim in two sentences: "The marginal tax rate is crucial because it affects the incentive to earn." The marginal rate, he explains, "reveals how much of one's additional income must be turned over to the tax collector," and so how much the earner keeps.8 High marginal rates reduce work, saving and investment, and they push people into wasteful tax avoidance: shelters, deferred income, cash deals. Lower rates reverse those effects over time. Supply-siders present rate cuts as a long-run growth policy. They were never meant as a quick cure for a recession.
The Laffer curve adds a point of logic. At a tax rate of zero, government collects nothing. At 100 percent it also collects nothing, because nobody works for the tax collector alone. Somewhere between lies the rate that collects the most. If the actual rate is above that peak, cutting it raises revenue. If it is below the peak, cutting it loses revenue, though perhaps less than a simple calculation predicts. The logic is not in dispute. Everything turns on where the peak sits, and that is a question for evidence. Gwartney adds that a cut comes closest to paying for itself in the highest brackets, where rates start high, as the 70 percent top rate before 1981 did, and that the revenue-losing case is less likely when rates are already moderate.8
From Kemp-Roth to the 1981 tax act
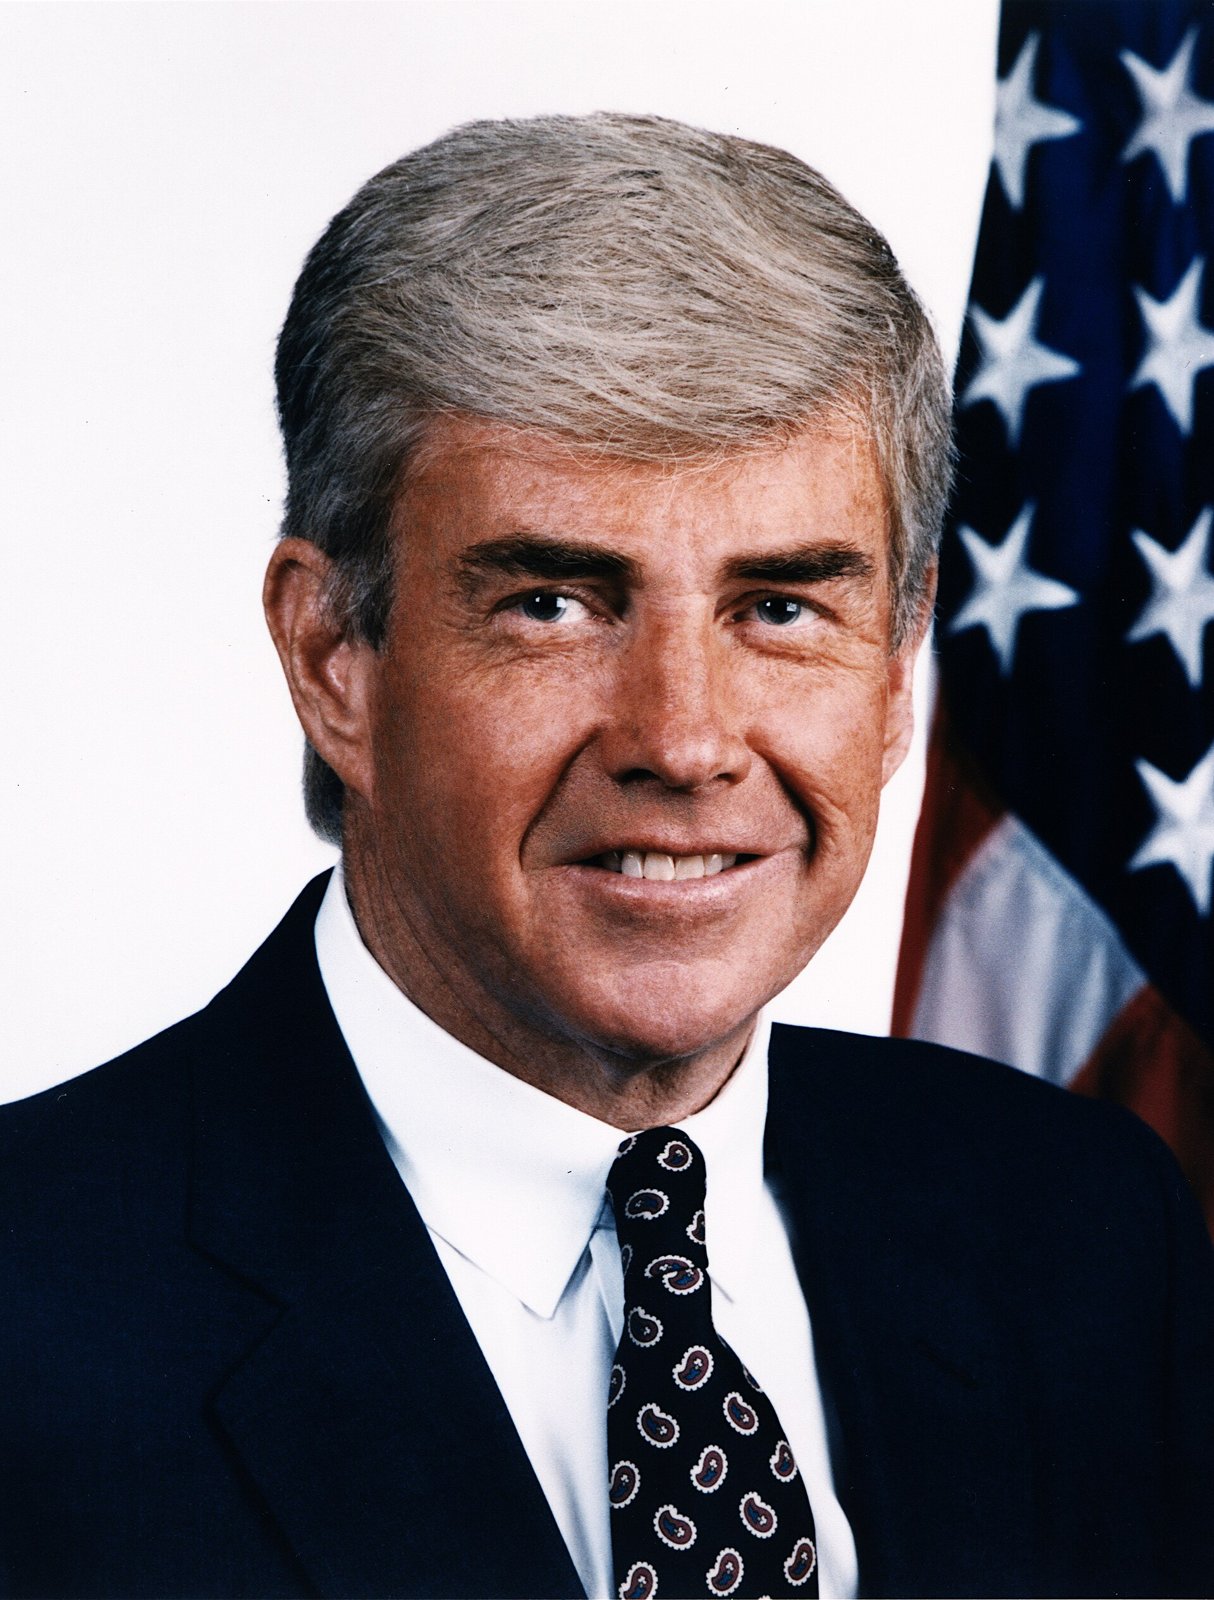
The politicians came next. Representative Jack Kemp, a Republican from New York, and Senator William Roth, a Republican from Delaware, proposed cutting personal income tax rates by 30 percent over three years, along with faster write-offs for business investment. The Christian Science Monitor, reporting in July 1980, called the bill the fruit of the Laffer curve and noted that the draft Republican platform endorsed it twice and pledged immediate action if the party won the White House that November.10
Ronald Reagan won, and the Economic Recovery Tax Act of 1981, H.R. 4242, was his first great legislative victory. The House passed its version 323 to 107 on July 29, 1981. The Senate agreed to the conference report 67 to 8 on August 3, and the House agreed 282 to 95 the next day.1112 On August 13 Reagan signed it at Rancho del Cielo, his ranch near Santa Barbara, California, together with the Omnibus Budget Reconciliation Act.13
The law cut individual income tax rates by about 23 percent over three years, in steps of 5 percent on October 1, 1981, 10 percent on July 1, 1982, and 10 percent on July 1, 1983. It cut the top rate from 70 percent to 50 percent, which also cut the top rate on long-term capital gains from 28 percent to 20 percent. It replaced the old depreciation rules with the Accelerated Cost Recovery System, which let businesses write off equipment and buildings faster. And starting in 1985 it indexed tax brackets to inflation, so that a raise that only kept pace with prices would no longer push a family into a higher bracket.14 Indexing may have been the most lasting change of all. In the 1970s inflation had raised taxes every year without a single vote in Congress.

The 1986 reform
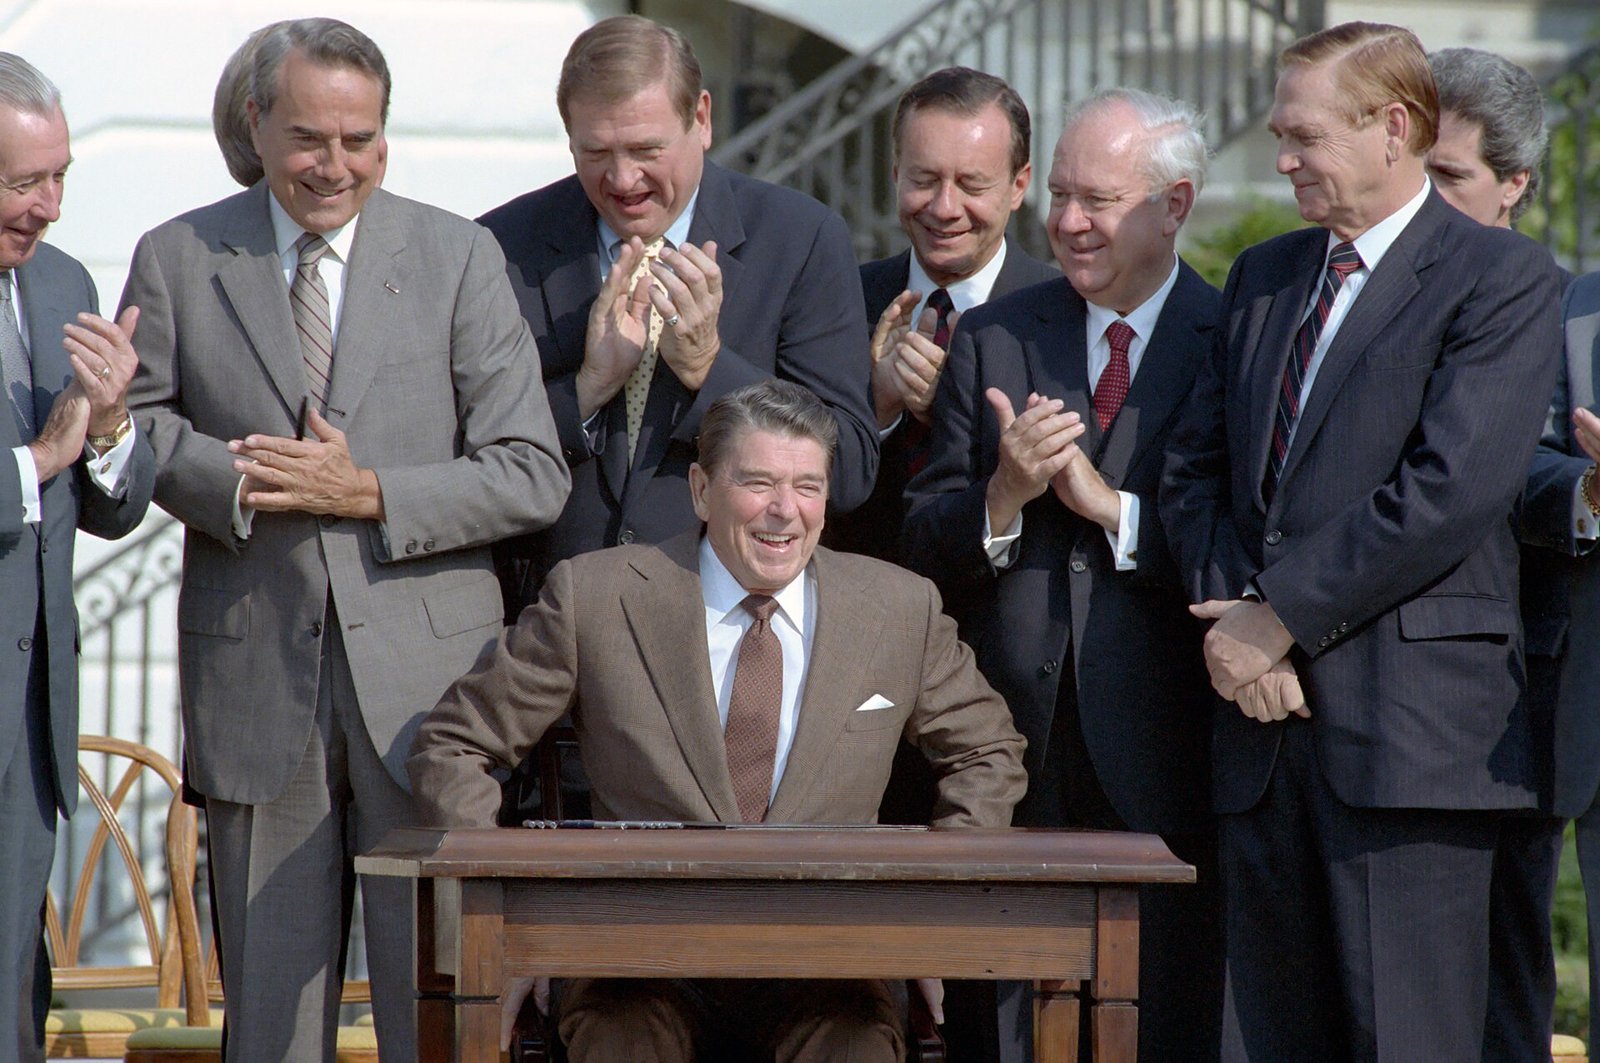
The second Reagan tax law was a different animal. In his 1984 State of the Union address Reagan asked the Treasury to produce a plan to simplify the tax code.16 The result, after two years of bargaining with a Democratic House led by Speaker Tip O'Neill and Ways and Means chairman Dan Rostenkowski, who introduced the bill as H.R. 3838, was the Tax Reform Act of 1986.17 The House agreed to the conference report 292 to 136 on September 25, 1986, and the Senate 74 to 23 on September 27.1819 Reagan signed it on the South Lawn on October 22, 1986, as Public Law 99-514.17
The law traded deductions for rates. It collapsed fifteen brackets into what was mostly a two-rate system of 15 and 28 percent, with a 33 percent rate on a band of upper-middle incomes. It taxed long-term capital gains at the same rates as other income. It cut the top corporate rate from 46 percent to 34 percent while repealing the investment tax credit and lengthening depreciation lives.1620 It removed about six million lower-income Americans from the income tax rolls, and it was designed to be roughly revenue-neutral.17
Supply-siders liked the low rates and disliked giving back the faster depreciation and the capital gains break they had won in 1981. Liberal reformers liked the closing of shelters. That the bill passed at all, with large majorities from both parties in both houses, shows how far the argument about marginal rates had moved the center of American politics in five years.
Did the tax cuts pay for themselves?
This is the claim most people associate with supply-side economics, and it is worth stating fairly what its leading academic defenders said. Gwartney, a sympathetic writer, says that Reagan argued that high marginal rates were hurting output, but that neither Reagan nor his advisers expected the rate cuts to increase tax revenue.8 Politicians and pamphleteers made bolder claims. The evidence speaks to both.
What Treasury's own economists found
The best single source on the size of past tax bills is a working paper by Jerry Tempalski of the Treasury's Office of Tax Analysis, "Revenue Effects of Major Tax Bills," revised in September 2006. Tempalski's figures are essentially conventional estimates, which, as he notes, do not take into account the effect of the bills on GDP. They measure each bill's own provisions and do not net out later laws.22 By his count ERTA was the largest tax cut since 1968: it reduced revenue by $38.3 billion in its first year after enactment and $176.7 billion in its fourth, equal to 4.15 percent of GDP and 18.6 percent of federal receipts that year. The Tax Equity and Fiscal Responsibility Act of 1982, which Reagan signed a year after ERTA to claw back part of the loss, raised revenue by 1.23 percent of GDP in its fourth year, the largest tax increase in his table. The 1986 reform came out close to even: plus 0.41 percent of GDP in its first year, minus 0.16 percent in its fourth.22
A static estimate leaves out growth, and growth is the whole supply-side point. So the fair question is how much of the conventional cost growth wins back. Three official estimates, from three decades, give consistent answers.
| Study | Tax change analyzed | Share of cost recovered through growth |
|---|---|---|
| CBO Technical Paper 2004-07 (May 2004) | 10 percent cut in all income tax rates | From 1 percent to 22 percent in the first five years, depending on the model; up to 26 percent in one model over the second five years |
| Joint Committee on Taxation, JCX-69-17 (December 2017) | Tax Cuts and Jobs Act | About $451 billion of a $1,456 billion conventional cost over 2018 to 2027, roughly 31 percent; net cost $1,071 billion with debt service |
| Clark Center (IGM) panel of economists (June 2012) | A cut in federal income tax rates "right now" | None of the 31 panelists who answered with a view agreed that revenue would be higher within five years; 28 disagreed and 3 were uncertain |
Sources: CBO, JCT and the Clark Center, notes 23 through 25.232425
The CBO paper tested a simple 10 percent cut in every income tax rate in six economic models. Feedback ranged from 1 percent of the cost in a textbook growth model to 21 or 22 percent in a model of an open economy, and CBO concluded that none of the models predicted that as much as 25 percent of the cost would be offset in the first ten years, apart from one model's 26 percent in the second five years if taxes were later expected to rise.23 The Joint Committee's analysis of the 2017 law found that it would raise the level of output by about 0.7 percent on average over the decade and recover about $451 billion of revenue.24 The same economists who reject the claim that tax cuts pay for themselves split almost evenly on whether they raise growth: in the 2012 panel, 14 agreed that a cut would raise GDP within five years, 14 were uncertain and 3 disagreed.25
Where the peak sits
How high would rates have to be before a cut paid for itself? That depends on how much reported income responds to rates, a number economists call the elasticity of taxable income. Emmanuel Saez, Joel Slemrod and Seth Giertz, reviewing the research in 2012, concluded that 0.25 is a reasonable midpoint.26 Studies built on numbers like that place the revenue-maximizing rate far above where American income tax rates now sit. A 2011 study by Mathias Trabandt and Harald Uhlig put the peak at around 70 percent and placed the United States and most European economies on the side of the curve where a cut loses revenue. Austan Goolsbee, studying American tax changes back to the 1920s, found no evidence that the United States had ever been past the peak.7
The supply-side answer is that revenue is the wrong test. A cut that recovers a fifth or a third of its cost through growth is still cheaper than it looks, and if it raises incomes, that is the purpose. Gwartney points to what happened among the highest earners after 1981. In constant 1982-84 dollars, income tax revenue collected from the top 10 percent of earners rose 32.7 percent, from $150.6 billion in 1981 to $199.8 billion in 1988, while the real tax liability of the bottom 90 percent fell 7.8 percent. Inflation, which had averaged 9 percent in the five years before the cut, averaged 3.3 percent in the five years after.8 Skeptics reply that much of the reported gain at the top came from income moving out of corporations and shelters onto individual returns after 1986, not from new work, and that the drop in inflation owed more to Paul Volcker's Federal Reserve than to the tax code. Gwartney himself notes that Slemrod judged some of the estimates of added income from the 1986 cuts too high.8
The Kansas test
States have run their own experiments. In 2012 Kansas, under Governor Sam Brownback, cut income tax rates sharply and virtually eliminated income taxes on some businesses, a step Brownback called a "real live experiment."27 The results disappointed its authors. A Kansas News Service fact check in June 2017 found that new business filings did rise, from about 13,000 a year in 2007 to 2011 to more than 18,000 in 2016, but that total employment grew 3.2 percent from January 2013 to January 2017 against about 8 percent nationally, and that the state ranked 42nd in GDP growth in 2016. By then Kansas faced a projected $900 million budget gap over two years.28 In June 2017 the legislature overrode Brownback's veto of Senate Bill 30, raising taxes by $1.22 billion over two years. The Senate just met the 27-vote threshold for an override.27 Defenders of the cuts argued that the business exemption invited gaming, that spending was never brought into line, and that five years is too short a test of a growth policy. Those points have some force. They do not change the fact that the revenue did not come back.
Idaho has taken a more gradual path. On March 6, 2025, Governor Brad Little signed House Bill 40, which cut the state's individual and corporate income tax rate from 5.695 percent to 5.3 percent at a cost of about $253 million a year, Its supporters made the case as tax relief. "This is the people's money, not ours in government," said House Speaker Mike Moyle, a co-sponsor.29 The federal and Kansas records give Idaho lawmakers a plain warning. Rate cuts cost money. Growth wins back part of the cost and not all of it. So a legislature that cuts rates has to decide honestly what spending it will give up.
Thomas Sowell: trade-offs, not solutions
Thomas Sowell was born June 30, 1930, in Gastonia, North Carolina, and moved with his family to Harlem at nine. He qualified for Stuyvesant High School but left at 17 because of money troubles and family conflict. Drafted in 1951, he served in the Marine Corps during the Korean War, where photography became his lifelong hobby. After his discharge in 1952 he took night classes at Howard University, then went on to Harvard, graduating magna cum laude in economics in 1958, to a Columbia master's in 1959 and to a Chicago doctorate in 1968, where George Stigler supervised him.3031
By his own account Sowell was a Marxist through his twenties. What began to change his mind, his biographers record, was a summer job as an intern at the U.S. Labor Department around 1960, studying the effect of the minimum wage on workers in the Puerto Rican sugar industry.30 The study started him toward free-market economics. The question of how a policy's effects differ from its intentions became the subject of his life's work. He joined the Hoover Institution at Stanford as a fellow in 1977 and became a senior fellow in 1980, and Hoover lists him as its Rose and Milton Friedman Senior Fellow on Public Policy, Emeritus. He received the National Humanities Medal in 2002 and the Bradley Prize in 2003.3031
Knowledge and Decisions (1980)
Sowell's most ambitious book built on Hayek's 1945 essay "The Use of Knowledge in Society." Knowledge and Decisions asked how a society uses knowledge that no single person or office possesses, and compared the ways markets, families, courts, bureaucracies and legislatures make decisions, each with its own feedback and its own costs of being wrong. Hayek praised it, and it won the 1980 Law and Economics Center Prize.30 The book's habit of asking who decides, with what knowledge, and who pays for a mistake reads like public choice applied to every institution at once.
A Conflict of Visions (1987)
In A Conflict of Visions, published by William Morrow in 1987 and revised in 2007, Sowell argued that most political disagreement rests on two unstated pictures of human nature. The constrained vision treats human nature as largely fixed and self-interested, whatever people's intentions, and so it trusts the rule of law, tradition and checks and balances, and expects compromise because there are only trade-offs to be had. The unconstrained vision treats human beings as perfectible, distrusts decentralized processes, looks for ideal solutions, and tends to believe that some people are wise enough to make decisions on behalf of others, whom Sowell later called "the self anointed."32 The line "There are no solutions, there are only trade-offs" is widely attributed to Sowell, and it captures the constrained vision well, but its exact wording and page could not be confirmed for this lesson.
The book has had an unusual second life. The psychologist Jonathan Haidt wrote that his own research left him "no choice but to agree" with some of the conservative claims Sowell set out.32 Founding-era readers will recognize the constrained vision in Madison's tenth Federalist, which designs a government around the fact that men are not angels.
Basic Economics (2000) and the critics
Basic Economics, published by Basic Books in 2000 and revised several times, is a long textbook with no graphs and no equations, built on case after case of price controls, tariffs and subsidies doing the opposite of what their sponsors promised.30 Sowell wrote it for readers who never took an economics course.
Sowell's work on race has drawn the fiercest criticism. In books from Race and Culture (1994) to Discrimination and Disparities (2018) he argued that group differences in income and outcomes have many causes, including culture, geography, age and skills, and that discrimination is only one, often not the largest. Critics have answered him at length. The economist Jennifer Doleac disputed his treatment of statistical discrimination in Discrimination and Disparities. The sociologist William Julius Wilson faulted Rhetoric or Reality? for neglecting discrimination against women in the workforce, and the legal scholar Richard Thompson Ford objected to the way Intellectuals and Race portrayed opposing views.30 Sowell's reply, made in book after book, is that the claim of discrimination is a hypothesis to be tested against comparisons, not a conclusion to be assumed from a gap.
Walter Williams: the state against the poor
Walter Edward Williams was born March 31, 1936, in Philadelphia, to humble origins, as Hoover's obituary put it.33 Drafted in 1959, he served as an Army private, and he was court-martialed over provocative statements about segregation, argued his own case and was found not guilty. He drove a Yellow Cab, took a BA in economics from California State College, Los Angeles, in 1965 and a doctorate from UCLA, taught at Temple University from 1973 to 1980, and then joined George Mason University, where he chaired the economics department from 1995 to 2001. Millions of Americans knew his voice from his years as a frequent guest host of The Rush Limbaugh Show. He died in Fairfax, Virginia, on December 1, 2020, at 84.34 Sowell said of him, "He was my best friend for half a century. There was no one I trusted more or whose integrity I respected more."33
The State Against Blacks (1982)
Williams's best-known book argued that laws regulating economic activity had become bigger obstacles to black economic progress than bigotry and discrimination.34 His targets were laws that close the bottom rungs of the job ladder: minimum wages, licensing rules and limits on entry into trades such as taxi driving, which he knew from the driver's seat.
His argument about the minimum wage went beyond the familiar claim that it prices low-skilled workers out of jobs. "What minimum-wage laws do is lower the cost of, and hence subsidize, racial preference indulgence," he wrote.33 An employer who must pay a wage above what the market would set will face more applicants than openings. He can then choose among them by any standard he likes, including prejudice, at no cost to himself. At a market wage, turning away a qualified worker because of his race costs the employer money. Above it, the bigot pays nothing.
Williams pressed a historical case too. The Davis-Bacon Act, signed by President Hoover on March 3, 1931, requires contractors on federally funded construction to pay the locally prevailing wage.35 In hearings on the bill, Representative Clayton Allgood of Alabama spoke of a contractor's "cheap colored labor" that "is in competition with white labor throughout the country," and Williams, in Race and Economics, cited such complaints as evidence that the law was meant to keep black workers off federal jobs. Defenders of Davis-Bacon answer that its purpose was to stop contractors from undercutting local wage standards with imported crews, whatever some members said, and the NAACP itself passed a resolution supporting the act, according to a 1995 entry in the Congressional Record.35
Licensing
On occupational licensing, the evidence has moved Williams's way, and a Democratic administration said so. In July 2015 the Treasury Department, the Council of Economic Advisers and the Labor Department under President Obama reported that the share of American workers needing a state license rose from less than 5 percent in the early 1950s to about 25 percent by 2008. Licensing raised wages for licensed workers by 10 to 15 percent after controls for education and experience, raised prices to consumers by 3 to 16 percent in the studies reviewed, and cut interstate migration in the most heavily licensed occupations by nearly 14 percent of the average rate.36 The report did not oppose all licensing, and neither did Williams. Nobody wants an unlicensed surgeon. But a license to braid hair or arrange flowers is a barrier to entry that falls hardest on the poor, the young and newcomers, exactly as Williams argued in 1982.
The minimum wage evidence today
On the minimum wage, the evidence is more divided than either Sowell or Williams allowed. The Congressional Budget Office, analyzing a federal minimum of $15 an hour by 2025, estimated in February 2021 that employment would fall by 1.4 million workers, or 0.9 percent, under its average estimate, while 0.9 million people would be lifted out of poverty and 17 million workers earning less than $15 would get a raise.37 That is the trade-off Sowell would insist on naming: real gains for most low-wage workers, paid for in part by the lost jobs of others.
Other research finds smaller job losses than the older consensus expected. A 2019 study of state minimum wage increases by Doruk Cengiz, Arindrajit Dube, Attila Lindner and Ben Zipperer found that the overall number of low-wage jobs remained essentially unchanged over five years following the increase, though it found some evidence of job losses in industries that trade across state lines.38 The older debate between David Card and Alan Krueger, whose study of New Jersey and Pennsylvania fast-food restaurants seemed to show no loss of jobs, and David Neumark and William Wascher, whose payroll data from similar restaurants showed a decline, has never been fully settled. Card and Krueger themselves eventually wrote that New Jersey's increase probably had no effect on total employment in its fast-food industry.39 That debate is set out at length in Lesson 9 of this course. Much of what remains in dispute is a matter of size, since a minimum set high relative to local wages is a different policy from a modest one.
Sowell and Williams were never only economists of the minimum wage. Their deeper argument was about the people on the receiving end of good intentions. Both grew up poor and black at a time when the law was openly against them. Both concluded that the most reliable friend of a poor man is an open door into work, and that governments of every party keep finding reasons to narrow that door for someone else's benefit. Readers can weigh their evidence against their critics'. Few can read them and still judge a policy by its label instead of its results.
Learn more
- James Gwartney, "Supply-Side Economics": A sympathetic but careful encyclopedia article with the Reagan-era numbers.
- Treasury OTA Working Paper 81, "Revenue Effects of Major Tax Bills": The Treasury's own tables on every major tax law from 1940 to 2006.
- CBO, Macroeconomic Analysis of a 10 Percent Cut in Income Tax Rates: The clearest official test of how much growth pays back.
- Joint Committee on Taxation, JCX-69-17: Congress's official dynamic estimate of the 2017 tax law.
- The Laffer napkin at the Smithsonian: See the object and its inscription, then read the 2017 Times article that disputes it.
- Thomas Sowell at the Hoover Institution: His books, essays and recorded interviews.
- Walter E. Williams, 1936-2020: Hoover's obituary, with Sowell's tribute.
- Occupational Licensing: A Framework for Policymakers (2015): The bipartisan case for licensing reform, in government numbers.
- CBO on a $15 minimum wage (2021): Jobs lost, people lifted out of poverty, and the trade-off in one report.
- Lesson 1: The map of free-market thought: Where supply-side economics and Sowell and Williams sit among the schools.
Notes
- National Museum of American History, "Laffer Curve Napkin," catalog record nmah_1439217: cloth napkin, 15 by 15 inches, inscription dated 9/13/74, gift of Patricia Koyce Wanniski, exhibited in American Enterprise. The inscription is quoted with its line breaks removed. Read it online. ↩
- Smithsonian Magazine, article on the Laffer napkin, on the meeting at the Two Continents restaurant in the Hotel Washington with Laffer, Wanniski, Rumsfeld and Cheney, and Laffer's recollection. Read it online. ↩
- Binyamin Appelbaum, "This Is Not Arthur Laffer's Famous Napkin," The New York Times, October 13, 2017 (reproduced by the Smithsonian). Read it online. ↩
- Columbia University, Center on Capitalism and Society, "The Passing of Robert Mundell," April 5, 2021. Read it online. ↩
- Nobel Prize Outreach, "Robert A. Mundell, Facts," Prize in Economic Sciences 1999: born October 24, 1932, Kingston, Ontario; affiliation Columbia University; prize motivation. Read it online. ↩
- "Arthur Laffer": born August 14, 1940, Youngstown, Ohio; Yale BA 1963; Stanford MBA 1965 and PhD 1972; OMB chief economist October 1970 to July 1972; Chicago and USC faculty; Economic Policy Advisory Board 1981 to 1989; Presidential Medal of Freedom, June 19, 2019; his crediting of Ibn Khaldun and Keynes. Read it online. ↩
- "Laffer curve," on Wanniski's naming of the curve and his 1978 essay in The Public Interest, Goolsbee (1999), Trabandt and Uhlig (2011), the 2012 Chicago survey and Kansas. Read it online. ↩
- James D. Gwartney, "Supply-Side Economics," Concise Encyclopedia of Economics (Library of Economics and Liberty). Read it online. ↩
- Official portrait of Secretary of Housing and Urban Development Jack Kemp, U.S. Department of Housing and Urban Development, public domain. View it online. ↩
- "Reagan's 'supply side' economics," Christian Science Monitor, July 15, 1980, on the Roth-Kemp bill and the draft Republican platform. Read it online. ↩
- Voteview, 97th Congress, Senate vote 251, August 3, 1981, on agreeing to the conference report on H.R. 4242, 67-8. Read it online. ↩
- Voteview, 97th Congress, House vote 179, August 4, 1981, H.R. 4242, 282-95, read it online; and House vote 167, July 29, 1981, H.R. 4242, 323-107, read it online. ↩
- Ronald Reagan Presidential Library, photograph C03488-06, signing ceremony for the Economic Recovery Tax Act (H.R. 4242) and the Omnibus Budget Reconciliation Act (H.R. 3982), Rancho del Cielo, August 13, 1981. Read it online. ↩
- "Economic Recovery Tax Act of 1981," on the phased rate cuts, the 70 to 50 percent top rate, capital gains, ACRS and indexing from 1985. For the bill record see congress.gov, H.R. 4242, 97th Congress, Public Law 97-34. Read it online. ↩
- Karl Schumacher, White House photograph C03490-4A, Ronald Reagan Presidential Library, public domain. View it online. ↩
- "Tax Reform Act of 1986," Encyclopedia.com, on Reagan's 1984 request to Treasury, the 15 and 28 percent rates with a 33 percent band, the corporate rate and the taxation of capital gains. Read it online. ↩
- "Tax Reform Act of 1986," on H.R. 3838, the signing on October 22, 1986, Public Law 99-514 (100 Stat. 2085), the removal of about six million lower-income Americans from the rolls and revenue neutrality. Read it online. ↩
- Voteview, 99th Congress, House vote 818, September 25, 1986, conference report on H.R. 3838, 292-136. Read it online. ↩
- Voteview, 99th Congress, Senate vote 677, September 27, 1986, conference report on H.R. 3838, 74-23. Read it online. ↩
- Patrick J. Wilkie, James C. Young and Sarah E. Nutter, "Corporate Business Activity Before and After the Tax Reform Act of 1986," IRS Statistics of Income, Figure A. Read it online. ↩
- "Signing Ceremony for Tax Reform Act of 1986 with Bob Dole, Dan Rostenkowski on South Lawn," White House photograph via the Digital Public Library of America, public domain. View it online. ↩
- Jerry Tempalski, "Revenue Effects of Major Tax Bills," U.S. Department of the Treasury, Office of Tax Analysis Working Paper 81, revised September 2006, Table 2, "Revenue Effects of Major Bills Enacted Since 1968," panels in current dollars, percent of GDP and percent of federal receipts. Read it online. ↩
- Congressional Budget Office, "Macroeconomic Analysis of a 10 Percent Cut in Income Tax Rates," Technical Paper 2004-07, May 2004, summary and Table 4. Read it online. ↩
- Joint Committee on Taxation, "Macroeconomic Analysis of the Conference Agreement for H.R. 1, the 'Tax Cuts and Jobs Act,'" JCX-69-17, December 22, 2017, summary and Table 1. Read it online. ↩
- Clark Center Forum (IGM Economic Experts Panel), "Laffer Curve," June 26, 2012, Questions A and B. Read it online. ↩
- "Taxable income elasticity," on Emmanuel Saez, Joel Slemrod and Seth H. Giertz, "The Elasticity of Taxable Income with Respect to Marginal Tax Rates: A Critical Review," Journal of Economic Literature 50, no. 1 (2012); NBER Working Paper 15012. Read it online. ↩
- "Kansas lawmakers end Brownback tax cut 'experiment' with veto override," The Bond Buyer, June 7, 2017. Read it online. ↩
- Kansas News Service, "Fact Check: Delving Into Brownback's Defense of Tax Cuts," KCUR, June 9, 2017. Read it online. ↩
- "Idaho Gov. Brad Little signs state's largest income tax cut into law," Idaho Capital Sun, March 6, 2025, on House Bill 40. Read it online. ↩
- "Thomas Sowell," on his birth, schooling, Marine Corps service, degrees, Marxist youth, Labor Department internship, Hoover appointments (fellow 1977, senior fellow 1980), Knowledge and Decisions, Basic Economics, Discrimination and Disparities, and the criticisms of Doleac (on Discrimination and Disparities), Wilson (on Rhetoric or Reality?) and Ford (on Intellectuals and Race). Read it online. ↩
- Hoover Institution, "Thomas Sowell," profile (the 1977 and 1980 appointment dates are from note 30): Rose and Milton Friedman Senior Fellow on Public Policy, Emeritus; Harvard 1958, Columbia 1959, Chicago 1968; National Humanities Medal 2002; Bradley Prize 2003; list of books. Read it online. ↩
- "A Conflict of Visions," on the 1987 William Morrow edition and the 2007 Basic Books revision, the constrained and unconstrained visions, and Jonathan Haidt's comment. Read it online. ↩
- Hoover Institution, "Walter E. Williams, 1936-2020," December 2020, with the minimum wage quotation and Thomas Sowell's tribute. Read it online. ↩
- "Walter E. Williams," on his birth, Army service and court-martial, education, Temple and George Mason, Yellow Cab work, The State Against Blacks (1982), radio work and death in Fairfax on December 1, 2020. Read it online. ↩
- "Davis-Bacon Act of 1931," Public Law 71-798, signed March 3, 1931, on the prevailing wage requirement, Representative Clayton Allgood's remarks, Walter Williams's Race and Economics, and the NAACP resolution supporting the act (Congressional Record, March 7, 1995). Read it online. ↩
- Department of the Treasury Office of Economic Policy, Council of Economic Advisers and Department of Labor, Occupational Licensing: A Framework for Policymakers, July 2015, executive summary. Read it online. ↩
- Congressional Budget Office, The Budgetary Effects of the Raise the Wage Act of 2021, February 8, 2021. Read it online. ↩
- Doruk Cengiz, Arindrajit Dube, Attila Lindner and Ben Zipperer, "The Effect of Minimum Wages on Low-Wage Jobs: Evidence from the United States Using a Bunching Estimator," NBER Working Paper 25434, January 2019. Read it online. ↩
- Linda Gorman, "Minimum Wages," Concise Encyclopedia of Economics, on Card and Krueger and on Neumark and Wascher's payroll data. Read it online. ↩


Check yourself
1. What does the Smithsonian's Laffer napkin, dated 9/13/74, have in common with the accounts of the people who were there?
Binyamin Appelbaum reported in The New York Times (October 13, 2017) that Laffer said, 'I believe that this is the napkin that Jude Wanniski asked me to do for him,' and that others recalled a paper napkin and a meeting after the November 1974 elections.
2. By what vote did the Senate agree to the conference report on the Economic Recovery Tax Act on August 3, 1981?
Voteview's record of Senate vote 251 in the 97th Congress shows the conference report on H.R. 4242 agreed to 67-8 on August 3, 1981. The House followed 282-95 the next day.
3. According to Treasury's Office of Tax Analysis, how did ERTA's revenue effect in its fourth year compare with the size of the economy?
Jerry Tempalski's OTA Working Paper 81 (revised 2006) estimates ERTA's fourth-year effect at -4.15 percent of GDP, the largest tax cut in the table. The -0.16 figure belongs to the Tax Reform Act of 1986.
4. In the Joint Committee on Taxation's 2017 macroeconomic analysis of the Tax Cuts and Jobs Act, what share of the conventional cost did higher growth recover?
JCX-69-17 estimated that macroeconomic effects would raise revenue by about $451 billion over 2018-2027 against a conventional loss of $1,456 billion, for a net cost of about $1,071 billion after added debt service.
5. In A Conflict of Visions (1987), how does Thomas Sowell describe the constrained vision?
Sowell contrasts the constrained vision, which sees human nature as unchanging and favors the rule of law, tradition and checks and balances, with the unconstrained vision, which sees people as perfectible and seeks ideal solutions.
6. What did Walter Williams write about minimum-wage laws, as quoted by the Hoover Institution?
Hoover's obituary quotes Williams: 'What minimum-wage laws do is lower the cost of, and hence subsidize, racial preference indulgence.' When an employer must pay above market wages, he faces many applicants and can pick by prejudice at little cost.
Terms in this lesson
- Supply-side economics
- The view that tax rates, especially marginal rates, change how much people work, save and invest, so that tax policy affects the economy's productive capacity and not only spending.
- Marginal tax rate
- The share of the next dollar of income that goes to taxes. Supply-siders argue it matters more for incentives than the average rate.
- Laffer curve
- A curve showing that tax revenue is zero at a 0 percent rate and at a 100 percent rate, so some rate in between raises the most revenue. Its real shape is an empirical question.
- Dynamic scoring
- A revenue estimate that includes the effect of a tax change on the size of the economy, as distinct from a conventional estimate that holds total output fixed.
- Bracket creep
- The movement of taxpayers into higher brackets because inflation raises their nominal income, not their real income. ERTA indexed brackets to inflation starting in 1985.
- Elasticity of taxable income
- How much reported taxable income changes when the marginal tax rate changes. A larger elasticity means a lower revenue-maximizing rate.
- Constrained vision
- Sowell's name for the tradition that sees human nature as limited and self-interested and therefore trusts rules, traditions and decentralized processes more than designed solutions.
- Occupational licensing
- A legal requirement that a worker hold a state-issued license, usually after training and fees, before doing a particular job.
Sources
- Laffer Curve Napkin, National Museum of American History checked 2026-10
- Binyamin Appelbaum, This Is Not Arthur Laffer's Famous Napkin, New York Times (October 13, 2017) checked 2026-10
- James D. Gwartney, Supply-Side Economics, Concise Encyclopedia of Economics checked 2026-10
- Economic Recovery Tax Act of 1981, H.R. 4242, 97th Congress (congress.gov) checked 2026-10
- Jerry Tempalski, Revenue Effects of Major Tax Bills, Treasury OTA Working Paper 81 (revised September 2006) checked 2026-10
- CBO, Macroeconomic Analysis of a 10 Percent Cut in Income Tax Rates, Technical Paper 2004-07 checked 2026-10
- Joint Committee on Taxation, JCX-69-17, Macroeconomic Analysis of the Conference Agreement for H.R. 1 (December 22, 2017) checked 2026-10
- Clark Center (IGM) Economic Experts Panel, Laffer Curve poll, June 26, 2012 checked 2026-10
- Thomas Sowell, Hoover Institution profile checked 2026-10
- Walter E. Williams, 1936-2020, Hoover Institution checked 2026-10
- Treasury, CEA and DOL, Occupational Licensing: A Framework for Policymakers (July 2015) checked 2026-10
- CBO, The Budgetary Effects of the Raise the Wage Act of 2021 (February 8, 2021) checked 2026-10
- Cengiz, Dube, Lindner and Zipperer, The Effect of Minimum Wages on Low-Wage Jobs, NBER Working Paper 25434 (2019) checked 2026-10