Lesson 8 of 10 · about 23 minutes
Comparing the Record
You'll be able to
- Explain what a natural experiment is and why divided countries are the closest history offers to one
- Read the Maddison GDP-per-capita figures for Hong Kong, China, South Korea, North Korea, Chile and Venezuela and say what they show
- Describe the complications that cut against a clean story: state-led industrial policy in South Korea, Hong Kong's government-owned land, Chile's dictatorship
- State what the Fraser Institute and Heritage Foundation freedom indexes measure and where their limits lie
- Say what the comparisons prove, what they leave open, and what Milton Friedman himself conceded
Look at the Korean Peninsula from orbit at night. South Korea glitters with cities and highways. North Korea, apart from the capital, is dark. The picture below is a composite of satellite images made by NASA for the year 2012.1 Nobody had to design that experiment. History split one people into two states in the 1940s, put one under a planned economy and the other under a mixed one, and then left the results where everyone could see them.
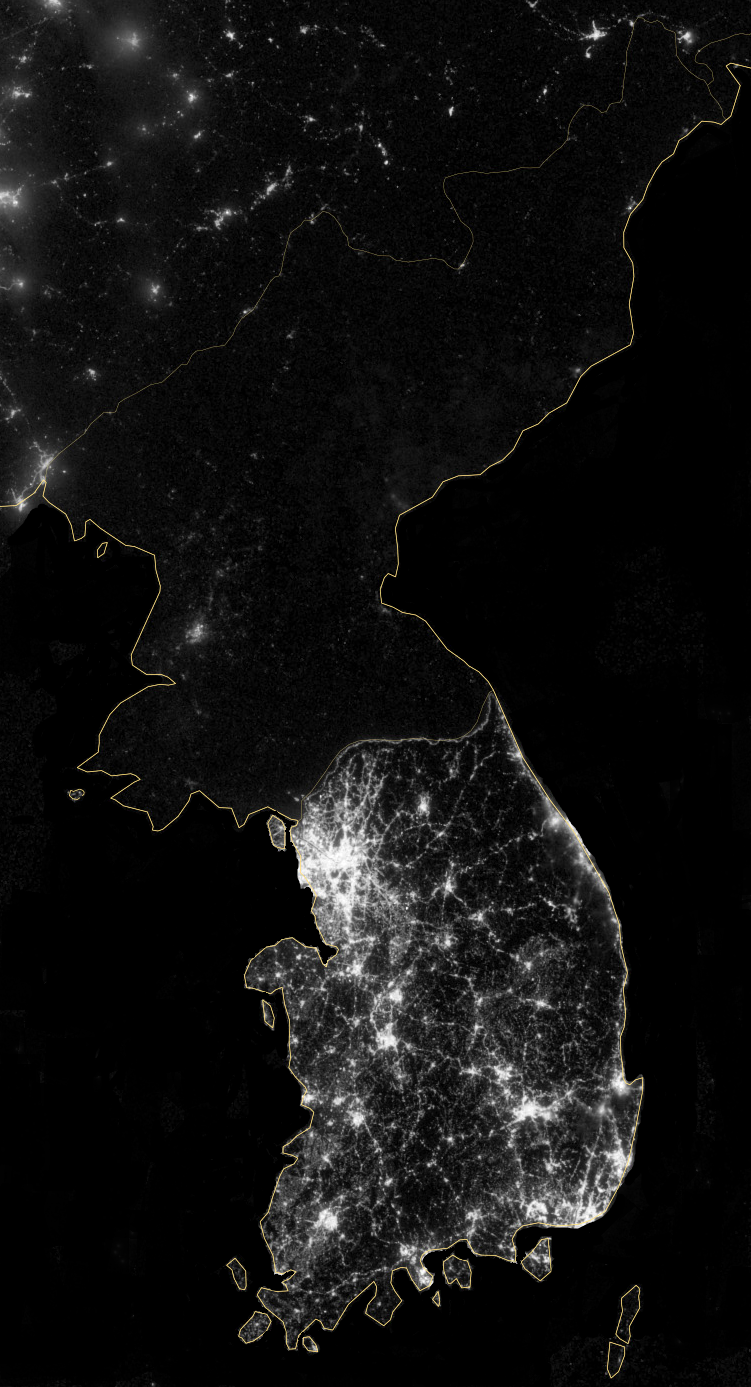
This lesson looks at a handful of such pairs. Milton Friedman named them in the preface he wrote in 2002 for the fortieth anniversary edition of Capitalism and Freedom, describing the fall of the Berlin Wall and the Soviet collapse as the end of a seventy-year experiment, and noting that "a number of similar experiments on a smaller scale" had foreshadowed it: "Hong Kong and Taiwan versus mainland China; West Germany versus East Germany; South Korea versus North Korea."2 To those, this lesson adds two Latin American cases, Chile and Venezuela, and China after 1978.
What a natural experiment can show
A scientist tests a drug by giving it to half of a group and a dummy pill to the other half. Nobody can do that to countries. What history sometimes offers instead is a split: a single people, language and culture cut by a border, with different rules on each side. The comparison is rough. The two halves are never identical, and outside events hit them differently. Even so, a gap that opens quickly, widens for decades and shows up in income, in life expectancy and in how many people try to leave is hard to explain away.
The income measure used here is GDP per capita from the Maddison Project Database 2023, which estimates output per person in "2011 international dollars" so that different countries and years can be compared. It covers 169 countries and runs to 2022.3 Life expectancy comes from the World Bank. All numbers are averages, which hide the poor and the rich alike, and GDP leaves out much that matters. They are still the best long-run comparisons available.
The two Germanys
Before the war the territory that became East Germany was richer than the West: according to the economic historian Jaap Sleifer's comparison, its GDP per capita was 103 percent of West Germany's.4 By 1990, on the figures Sleifer's work is reported to give, West German GDP per capita was about $18,000 and East German about $9,000, a ratio of two to one.4 Those East German statistics are contested, since planned economies reported output in ways that are hard to compare, and a gap of that general size is not in doubt.
Germany is also a case where the border had to be guarded against the people it enclosed. A research center in Potsdam and the Berlin Wall memorial count at least 140 people killed at the Wall, 101 of them escapees who were shot, died in accidents or took their own lives during attempts to cross.4 A comparison of two systems that includes a wall to keep people in carries information that the income figures do not.
The strongest objection is that the two halves were occupied by different powers after 1945 and started the postwar years from different positions, so a difference in outcome cannot be put down to economic systems alone. That is a fair caution. It leaves unexplained why the gap kept widening for decades after the early reconstruction years, and why people walked and tunneled toward one side and not the other.
The two Koreas
After the Korean War, South Korea was poor. Maddison puts its income per person at $998 in 1950 and $1,548 in 1960. North Korea's series in the database begins only in 1990, so the early comparison relies on other sources. From 1990 the figures are stark: South Korea rose from $13,874 to $41,321 in 2022, almost tripling. North Korea fell from $2,456 to $1,569.3
The human side shows up in the 1990s. After Soviet aid and cheap oil ended in 1991 and floods and drought struck, North Korea's famine killed between a few hundred thousand and several million people, depending on the source. Goodkind and West estimate 600,000 to 1 million. The US Census Bureau (Goodkind, West and Johnson) estimates 500,000 to 600,000 excess deaths from 1993 to 2000. Other estimates range from 240,000 to 3.5 million. The Wikipedia summary of this research notes that the planned system was too inflexible to respond and refused policies that would have allowed food imports and fair distribution.5
A complication
The tidy story hides something. South Korea's rise was not an example of laissez-faire. After the coup of 1961 the government of Park Chung-hee directed the economy through five-year plans. State banks sent credit to chosen conglomerates, and a 1973 drive put heavy investment into six strategic industries: steel, non-ferrous metals, shipbuilding, industrial machinery, electronics and petrochemicals.6 The World Bank criticized the approach at the time.6 Real GDP grew by more than 8 percent a year from 1962 to 1989.6 Friedman's followers must say that South Korea was nonetheless a market economy with private firms, prices and exports. Its critics must say that the North's planners and the South's planners were doing something very different, since the South competed on world markets and lost money when it failed. Both statements are fair.
Hong Kong, Taiwan and the mainland
In 1950 Hong Kong's income per person was $4,082 and mainland China's was $799. By 1978, the year China began its reforms, Hong Kong was at $14,689 and China at $1,744, a ratio of more than eight to one. Taiwan stood at $7,519 in 1978, more than four times the mainland's level.3 Then China changed course.
Hong Kong's financial secretary from 1961 to 1971, Sir John Cowperthwaite, kept taxes low, ran budget surpluses and refused to compile GDP statistics, arguing that the data would only invite officials to meddle. Asked what poor countries could do to grow, he is reported to have answered: "They should abolish the office of national statistics."7 Friedman and the Cato Institute held up Hong Kong as an example of laissez-faire capitalism. Others note that the government owned all the land, leased it to private users and raised a significant share of its revenue from the leases, which let it keep income tax low, and that it was active in public works, health, education and housing.8 The label "laissez-faire" is a simplification. What is clear is that Hong Kong relied on private enterprise, open trade, low taxes and the rule of law, and that the mainland did not.
China after 1978
China is the biggest test of the story. Under Mao the country went through the Great Leap Forward. In Maddison's series, income per person was $1,173 in 1958 and $874 in 1961. In 1978 it was $1,744.3 After 1978 the government of Deng Xiaoping began what the World Bank calls reform and opening-up, starting with agriculture. By 2022 China's income per person stood at $19,238, eleven times its 1978 level.3 The World Bank says GDP growth has averaged more than 9 percent a year since 1978 and that growth lifted almost 800 million people out of extreme poverty, with extreme poverty eradicated by 2020 by its measure.9 Life expectancy rose from 63.1 years in 1978 to 78.2 in 2022.10
Friedman read China as confirmation. In his 2002 preface he wrote that Deng's market reforms of the late seventies, "in effect privatizing agriculture, dramatically increased output," and that "there is no doubt that the residents of China are freer and more prosperous than they were under Mao."2 He also said China was "still very far from being a free society."2
The hard part for the argument
China has grown as a one-party state. That is the best challenge to Friedman's claim in 1962 that economic freedom is an indispensable means to political freedom. He answered it himself. In the same preface he wrote that Hong Kong, before it was returned to China, persuaded him that "political freedom, desirable though it may be, is not a necessary condition for economic and civil freedom," and he called his own treatment of political freedom in the book inadequate.2 The claim that survives is narrower. Markets can coexist with authoritarian rule and produce wealth. They do not guarantee liberty, and the Fraser Institute's 2026 report notes that Hong Kong's own economic freedom score has fallen steeply since 2018.11
Chile and Venezuela
In 1978 Venezuela's GDP per capita was $17,481, more than twice Chile's $7,936. By 2022 Chile stood at $22,741 and Venezuela at $5,267.3 The reversal is among the starkest in Latin America. It is also easy to misread.
Chile's reforms began after the 1973 coup. In 1975 General Augusto Pinochet gave key posts to the "Chicago Boys," Chilean economists trained at the University of Chicago, who pursued privatization, deregulation, trade liberalization and spending cuts.12 The early results were poor: income per person fell from $8,195 in 1970 to $6,731 in 1975, recovered to $9,427 in 1981, and fell again to $8,016 in 1982, a drop of about 15 percent that matches the GDP contraction reported for the 1982 crisis.312 By 1990, when democracy returned, income per person was $10,203, only about 25 percent above its 1970 level. Then it more than doubled under elected governments that kept most of the market framework.312
That history is argued about in Chile and abroad. Supporters credit the reforms with a stable, growing economy, the "Chilean miracle." Critics point to the social costs, to rising inequality, and to the fact that the reforms were carried out under a repressive military dictatorship that gave the regime international legitimacy.12 A fair reading is that the market framework helped Chile in the long run and that its adoption by a dictator is a moral stain that results cannot erase. This course does not endorse the Pinochet government. It records that the later gains came after 1990, under elected governments.
| Economy | Start year | Start | 2022 | Multiple | Life expectancy, start / 2022 |
|---|---|---|---|---|---|
| Hong Kong | 1978 | $14,689 | $48,289 | 3.3 | 73.5 / 83.7 |
| China | 1978 | $1,744 | $19,238 | 11.0 | 63.1 / 78.2 |
| South Korea | 1990 | $13,874 | $41,321 | 3.0 | 71.6 / 82.7 |
| North Korea | 1990 | $2,456 | $1,569 | 0.6 | 70.5 / 73.6 |
| Chile | 1978 | $7,936 | $22,741 | 2.9 | 68.0 / 79.2 |
| Venezuela | 1978 | $17,481 | $5,267 | 0.3 | 68.1 / 72.6 |
Sources: GDP from the Maddison Project Database 20233; life expectancy at birth from the World Bank.10 North Korea's figures come from outside estimates and deserve extra caution, since outside researchers cannot check them.
Look at life expectancy and one item stands out: it rose in nearly every place on the list, including the poor and the planned ones. Medical knowledge crosses borders. North Korea's rose by 3.1 years from 1990 to 2022, while South Korea's rose by 11.1 and China's by 10.0.10 Income and health do not always move together, and Cuba, discussed in Lesson 7, is the standing example. But the gap in life expectancy here grew along with the gap in income.
Freedom indexes and their limits
Two organizations publish yearly rankings of economic freedom. The Fraser Institute's Economic Freedom of the World, which the Cato Institute summarizes on its website, ranks 165 countries and territories. Its 2026 edition, using 2024 data, puts Hong Kong first, then Switzerland, Singapore, New Zealand and the United States. Venezuela is last.11 The Heritage Foundation's Index of Economic Freedom, now in its 32nd edition, ranks more than 180 countries and lists Singapore first, then Switzerland, Ireland and Australia.13
The Fraser Institute reports that countries in the top quartile of its index had an average GDP per capita of $65,596 in 2024 against $9,552 for the bottom quartile, and life expectancy of 80.7 years against 67.1.11 Those are large gaps. They have limits.
Four limits of the indexes
The first is that the numbers are correlations, and the Cato page presents them that way and does not claim causation.11 Rich countries can afford the courts, police and stable money that earn high scores, so the line of cause may run in both directions. The second is that the two indexes disagree at the top, with Hong Kong first on one list and not among the top four on the other, so the scores depend on the choices of the authors.1113 The third is that freedom in any index is a sum of many parts, such as tax rates, trade rules, legal protection and regulation, and a country can score well by doing some things very well and others poorly. The fourth is that the indexes count a larger government as a loss of economic freedom. Cato's page attributes a preliminary 0.12-point decline in the American score in 2025 to larger government, weaker property rights and rule of law, and trade restrictions, and voters may reasonably weigh those items differently.11 Cato's page also records that Hong Kong has fallen steeply since 2018 and still ranks first, which shows how slowly an index can move.11
Treat the indexes the way a doctor treats a blood test. They give a number worth taking seriously and a reason to look further. They do not settle what caused the patient's condition.
Myth: South Korea proves that government planning works
South Korea's planners worked through private firms. Conglomerates that met export targets earned subsidies and credit, and the state steered investment into steel, shipbuilding and electronics.6 That is a long way from North Korea, where the state owned the enterprises and gave orders. The South Korean case shows that state guidance can coexist with markets, trade and private ownership. It does not show that a command economy can match them, and North Korea's figures show the opposite.
What the numbers cannot see
GDP counts what is bought and sold. It misses the freedom to speak, worship and leave. China is, in Friedman's words, "still very far from being a free society" even as its income climbs.2 Cuba's life expectancy, 77.6 years in 2022, is close to the United States' 77.4 on an income that is a small fraction of it.103 A fair comparison has to hold all of these in view, and the tables in this lesson hold only some of them.
Taiwan is the easiest case to forget. Its income per person was $7,519 in 1978, about half of Hong Kong's $14,689. By 2022 it stood at $53,143, above Hong Kong's $48,289 and about 91 percent of the United States' $58,487.3 The numbers show a gap closing fast. They do not say which Taiwanese policies mattered most, and that question needs its own study.
What the pairs prove
A tidy conclusion is available and should be resisted. The comparisons do not prove that any one policy produced any one number, or that markets are free of cost. They do show a pattern. In every pair, the side that gave more room to private ownership, prices and trade ended with higher income, and in most cases with longer lives. The side that centralized ownership and planning ended poorer, and in several cases (the Ukrainian famine, the Great Leap Forward, North Korea in the 1990s) had famines that no market economy of comparable income has suffered in modern times.
The exceptions teach something as well. South Korea and Taiwan show that markets can work alongside serious state guidance. China shows that an authoritarian state can use markets to grow. Chile shows that markets under a dictator are no moral victory. And Venezuela, a market economy that moved in the opposite direction, shows how far an oil-rich country can fall. Friedman's own summary is more careful than his critics allow: capitalism, he wrote, is "a necessary condition for political freedom" and "clearly it is not a sufficient condition."14 The next lesson takes up the strongest criticisms of markets and the replies.
Learn more
- Maddison Project Database 2023: The long-run income series used in the chart. The workbook lets you compare any countries.
- World Bank, life expectancy at birth: Interactive chart for any country back to 1960.
- Economic Freedom of the World, 2026: The Fraser Institute's annual ranking, summarized on Cato's page.
- Heritage Foundation Index of Economic Freedom: The second major index; compare its rankings with the first.
- World Bank, China overview: The Bank's account of reform and poverty reduction since 1978.
- Economic history of South Korea: An account of state-led industrial policy and its critics.
- FEE, 17 Facts on the Reunification of Germany: A readable summary of the German comparison, with the caveat in note 4.
Notes
- NASA, composite satellite image of the Korean Peninsula at night, 2012, as catalogued on Wikimedia Commons ("Korean Peninsula at night - 2012 - NASA.png"). Read it online. ↩
- Milton Friedman, preface to the 2002 edition, Capitalism and Freedom, Fortieth Anniversary Edition (Chicago: University of Chicago Press, 2002). Read a scan online. ↩
- Jutta Bolt and Jan Luiten van Zanden, "Maddison style estimates of the evolution of the world economy: A new 2023 update," Journal of Economic Surveys (2024); Maddison Project Database 2023, GDP per capita in 2011 international dollars, "Full data" sheet. The database covers 169 countries to 2022; post-2008 figures draw on the Conference Board Total Economy Database, and original papers for each series are listed in the database. Read it online. ↩
- Mitchell Nemeth, "17 Facts on the Reunification of Germany," Foundation for Economic Education, 9 November 2019, summarizing Jaap Sleifer, Planning Ahead and Falling Behind: The East German Economy in Comparison with West Germany, 1936-2002 (2006), and a count of Berlin Wall deaths from the Centre for Research on Contemporary History Potsdam and the Berlin Wall Memorial. Read it online. This is a secondary summary; Sleifer's own figures should be consulted for precise comparisons. ↩
- "North Korean famine," Wikipedia, summarizing Goodkind and West (2001), Goodkind, West and Johnson (U.S. Census Bureau, 2011), Haggard and Noland (2007) and others. Read it online. ↩
- "Economic history of South Korea," Wikipedia, on the state-led policy after 1961, the 1973 heavy and chemical drive and growth from 1962 to 1989. Read it online. ↩
- "John James Cowperthwaite," Wikipedia, on his term as financial secretary of Hong Kong (1961-1971), his refusal to compile GDP statistics and his reported remark. Read it online. ↩
- "Economy of Hong Kong," Wikipedia, on the government ownership of land, lease revenue, and the debate over whether Hong Kong was laissez-faire. Read it online. ↩
- World Bank, "China Overview." Read it online. ↩
- World Bank, World Development Indicators, life expectancy at birth, total (years), SP.DYN.LE00.IN, retrieved through the World Bank API for China, Hong Kong SAR, South Korea, North Korea, Chile and Venezuela. Read it online. ↩
- Cato Institute, "Economic Freedom of the World: 2026 Annual Report" (Fraser Institute), 165 jurisdictions using 2024 data. Read it online. ↩
- "Chicago Boys," Wikipedia, on the 1975 appointments, the policies, the 1982 contraction of about 15 percent and the controversy. Read it online. ↩
- Heritage Foundation, Index of Economic Freedom, 32nd edition (2026). Read it online. ↩
- Milton Friedman, Capitalism and Freedom (Chicago: University of Chicago Press, 1962), chapter 1. Read the chapter online. ↩

Check yourself
1. In the Maddison Project Database 2023, what happened to North Korea's GDP per capita between 1990 and 2022?
North Korea's series begins in 1990 at about $2,456 and ends 2022 at about $1,569. South Korea rose from about $13,874 to about $41,321 over the same years.
2. Which complication does the lesson raise about the claim that South Korea's rise shows pure free markets at work?
South Korea combined private firms, prices and exports with heavy state direction in the 1960s and 1970s. It still looks nothing like North Korea's planned economy, but the clean story needs that qualification.
3. What did Friedman say in his 2002 preface that Hong Kong had persuaded him of?
Friedman wrote that, after he finished the book, Hong Kong persuaded him that political freedom is not a necessary condition for economic and civil freedom. He was conceding a point against his own earlier formulation.
4. Chile's GDP per capita in the Maddison data was about $8,195 in 1970 and about $10,203 in 1990. How does the lesson read this?
Chile's income fell to about $6,731 in 1975, recovered to $9,427 in 1981, fell again to $8,016 in 1982, and reached $22,741 by 2022. The reforms were controversial, were carried out under a dictatorship, and the biggest gains came after 1990.
5. What is the most important limit of the Economic Freedom of the World and Heritage indexes?
The Fraser Institute's own summary presents differences in income and life expectancy between top and bottom quartiles as correlations. The two indexes also rank countries differently, for example Hong Kong first on one and Singapore first on the other.
Terms in this lesson
- Natural experiment
- A situation in which history divides similar populations and applies different policies, giving a rough comparison without a researcher controlling anything.
- GDP per capita
- A country's total output divided by its population, a rough measure of average income.
- 2011 international dollars
- The price base used by the Maddison Project so that incomes in different countries and years can be compared.
- Economic Freedom of the World
- An annual Fraser Institute ranking of 165 jurisdictions that scores how much people are free to make their own economic choices.
- Index of Economic Freedom
- The Heritage Foundation's annual ranking of more than 180 countries, now in its 32nd edition.
- Industrial policy
- Government steering of credit, trade and investment toward chosen industries.
- Chicago Boys
- Chilean economists trained at the University of Chicago who held key posts in Chile's government after 1975.
Sources
- Maddison Project Database 2023 (Bolt and van Zanden) checked 2026-10
- World Bank, life expectancy at birth (SP.DYN.LE00.IN) checked 2026-10
- Friedman, Capitalism and Freedom, 2002 preface (scan) checked 2026-10
- Cato Institute, Economic Freedom of the World 2026 checked 2026-10
- Heritage Foundation, Index of Economic Freedom checked 2026-10
- World Bank, China overview checked 2026-10
- Wikipedia, Economic history of South Korea checked 2026-10
- Wikipedia, Economy of Hong Kong checked 2026-10
- Wikipedia, North Korean famine checked 2026-10
- Wikipedia, Chicago Boys checked 2026-10
- FEE, 17 Facts on the Reunification of Germany (citing Sleifer) checked 2026-10