Lesson 7 of 7 · about 18 minutes
The Publishing Package
You'll be able to
- Build a citations list that lets any reader check every key fact
- Plan a simple infographic with a text description for readers who cannot see it
- Write a short glossary for terms a general reader will not know
- Write a reader Q&A with full answers to the questions people actually ask
- Write an Interrogatories section that answers the strongest opposing questions in full
On the web an article can carry more than its body. Readers who want to check you can. Readers who are confused can find answers. Readers who disagree can see that you already faced their best argument. The package below is the standard for finished advocacy and analysis pieces on this site. News briefs can skip parts of it. Long pieces should not.
Every part goes inside the article file, after the body and before the byline. Readers should not have to open five documents.
The running example: an analysis piece arguing that the Marlow Water and Sewer District's 22 percent rate increase was necessary but should have come with a low-income discount. (Invented town, invented district.)
Citations and links
Link inline, in the sentence where the fact appears, to the original document. Then repeat every key source in a numbered list at the end. The inline link serves the reader in the moment. The list serves the reader who wants to check everything, and it survives when the article is printed or pasted somewhere links get stripped.
Each citation needs: the document's title, who published it, the date, and a link to the original. Add the date you last checked the link for anything that might change or vanish. The SPJ Code of Ethics asks journalists to use original sources and give readers access to source material. A citations list is the plainest way to do it.
Mini example: citations
- Marlow Water and Sewer District, Resolution 2026-04, Residential Rate Schedule, adopted March 10, 2026. [link to district PDF]
- Hartline Engineering, East Side Distribution Main Condition Assessment, prepared for the district, June 2024. [link]
- Marlow Water and Sewer District, Fiscal Year 2025 Audited Financial Statements, p. 14, general fund balance. [link]
- Board meeting video, March 10, 2026, public comment begins at 0:42:10. [link]
- Government Finance Officers Association, Fund Balance Guidelines for the General Fund. [link to gfoa.org]
Notice item 4 gives a timestamp. Item 3 gives a page. Make it easy.
Before publishing, open every link. Run the list through Source Checker. Replace any link to a news story about a document with the document itself.
Infographic
One chart that shows the central number beats a paragraph of figures. Pick the single comparison that carries your point and draw only that.
Rules that keep a chart honest:
- Bar charts start at zero. A cut axis makes small changes look huge.
- Label units and the time period. "$ per month, residential base rate, 2022 to 2026."
- Put the source under the chart, in small type.
- One idea per chart. If you need two ideas, make two charts.
- Do not rely on color alone to tell things apart. Label directly.
Every chart also needs a text version. The W3C's guidance on complex images calls for a short description identifying the image plus a longer description that gives the essential data in text, available to everyone, ideally in the main content. A caption with the actual numbers does both jobs.
Mini example: infographic plan and description
The caption carries every number in the chart, so a reader who cannot see the image loses nothing.
You can build a simple chart in a spreadsheet and export it as an image, or make a clean graphic in ImageStudio as a background and add exact numbers yourself. Never let an image generator draw the numbers. It will invent them.
Glossary
Short. Three to eight terms. Only words a general reader may not know or may misread. Define each in one plain sentence, in the sense your article uses it.
Mini example: glossary
- Base rate: the fixed monthly charge every residential customer pays before any water is used.
- Capital fund: money set aside for building or replacing long-lived equipment like pipes, kept separate from day-to-day costs.
- Fund balance: money left in a fund at the end of the year and carried forward. Often called reserves.
- Lifeline rate: a reduced rate for low-income customers, usually for a basic amount of water.
Reader Q&A
The Q&A answers what ordinary readers will ask after reading: what it costs them, when, what they can do. Five questions is typical. Find them by asking people, reading comments on earlier stories, or listening to what got asked at the meeting.
Answer in full. A Q&A answer of "It depends" is useless. Give the number, the date, the phone number, the link. Write the question the way a reader would say it.
Mini example: reader Q&A (two of five)
How much more will I pay?
The base rate goes from $38 to $46.50 a month on July 1, which is $102 more a year. Usage charges did not change, so if you use more water in summer, your summer bills rise by the same $8.50 a month, not by more. Your first bill at the new rate arrives in August for July service (citation 1).
Can I get help paying?
Not from the district right now. Marlow has no low-income rate. The regional community action agency runs a utility assistance program that can cover water bills for households under its income limit; call its intake line or apply on its website. Separately, the board said it would discuss a lifeline rate at its May meeting, which is open to the public.
Interrogatories
This is the hard part, and the part that makes an argument trustworthy. List the 5 to 10 hardest questions someone who disagrees with your position would ask. Skip the straw men and write the questions you hope nobody asks. Then answer each one in full, with evidence.
Rules:
- Write the question as the opponent would, in their strongest form.
- Concede what is true. If they have a point, say so plainly, then answer the rest.
- Answer with evidence and citations, not with tone.
- If you cannot answer a question, say what you do not know. That is better than a dodge.
- Cover both flanks. A piece arguing for a discount gets attacked by people who think the hike was unnecessary and by people who think a discount is unfair to other ratepayers.
Mini example: Interrogatories (two of seven)
The district had reserves. Why not spend those instead of raising rates?
Partly fair. The district's audited statements show a general fund balance of about $1.3 million at the end of fiscal 2025 (citation 3), against roughly $3.6 million in annual operating spending. That is a bit over four months of spending. The Government Finance Officers Association recommends at least two months for a general-purpose government's general fund (citation 5) and, in a separate best practice for utility and other enterprise funds, at least 45 days of working capital. By either yardstick the district is above the floor. So there is room. But spending all of it on pipe would cover about a third of the $4.1 million plan and leave nothing for a main break or a failed pump. A better question is whether the board could have used part of the reserve to phase the increase in over two years. It could have. It did not discuss doing so.
A low-income discount just shifts the cost to other customers. Isn't that unfair to the family that earns $1 too much to qualify?
Yes, a discount is paid for by everyone else, and any income line leaves someone just over it. Those costs are real. At the scale proposed here, the numbers are small: if 10 percent of Marlow's 3,100 households took a $10 monthly discount, the cost would be $37,200 a year, or about $1 a month for everyone else. Some districts soften the cliff with a sliding discount instead of a single line. Whether $1 a month is worth it is a values question, and readers can disagree. The math is not in dispute.
Order on the page
Headline and dek. Body with the infographic near the number it shows. Reader Q&A. Interrogatories. Glossary. Citations. Byline and rights line at the bottom. Readers looking for the reference material will find it at the end. Readers who stop after the body still got the story.
Try it
- Pick a finished draft of your own, or the Fenwick road bond facts from the structure lesson.
- Write a citations list with title, publisher, date and link for every key fact. Check each with Source Checker.
- Sketch one chart on paper. Write its caption so the caption alone carries every number.
- Write a glossary of three to six terms.
- Write five reader Q&A questions with full answers.
- Write at least five Interrogatories from opponents on both sides of your position. Answer each in full. Mark any where you had to concede a point.
- Paste the full package into Article Values Graph. If the Interrogatories section carries values your body never addresses, the body may be missing something.
Pictures, Numbers and Infographics
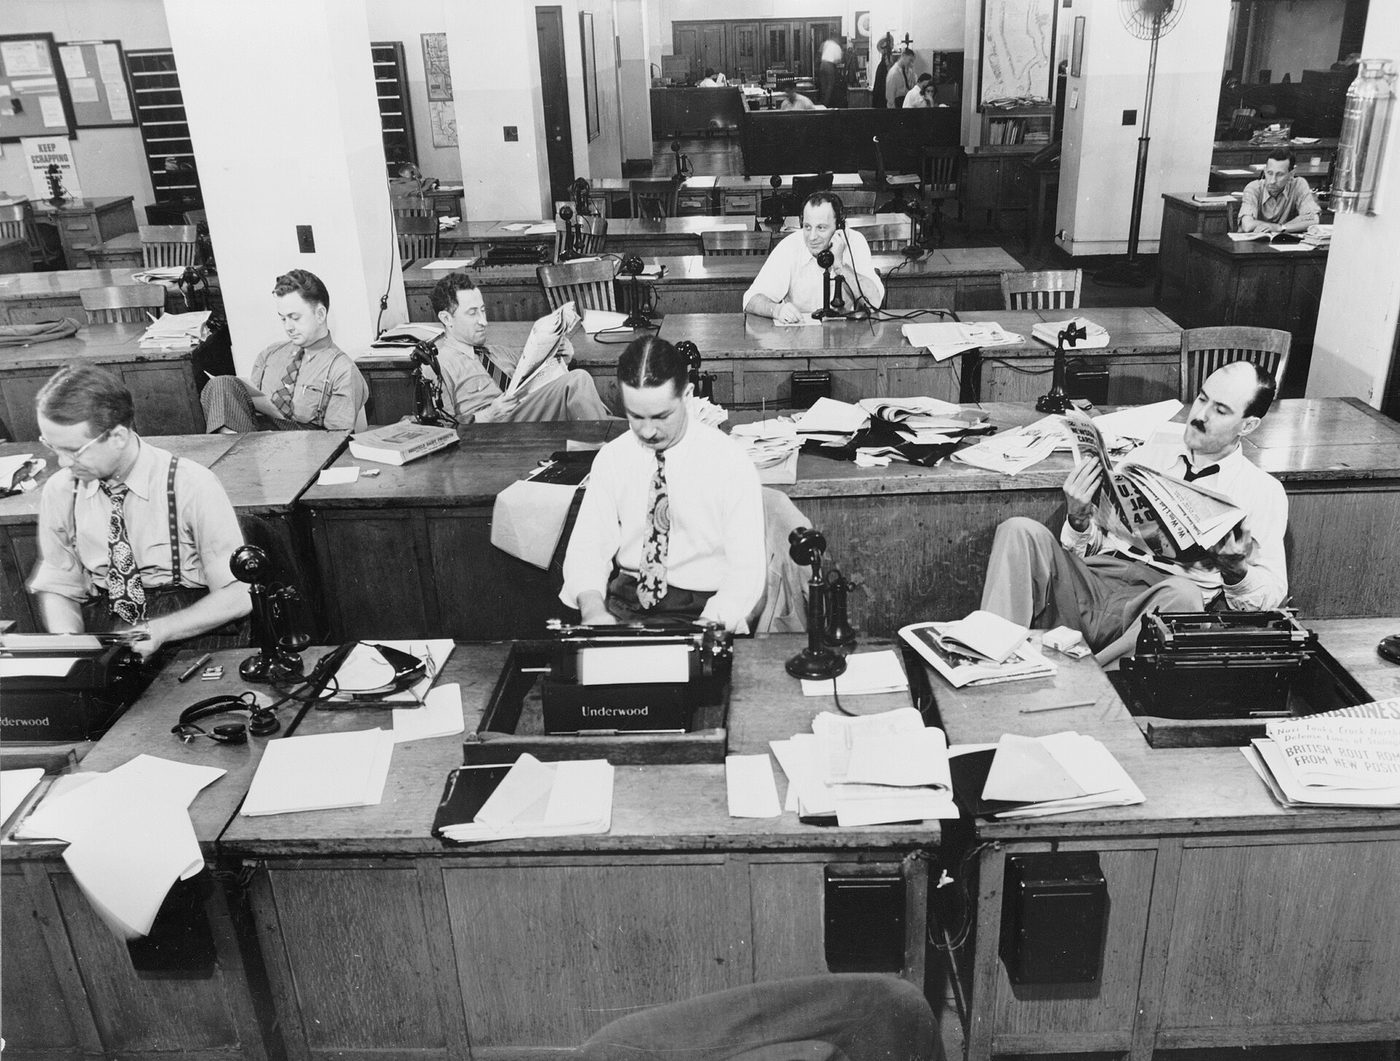
Most readers now meet an article in a social feed, next to a headline and a picture, before they ever reach the site that published it. Fewer people are paid to write those articles than in 2008, so more of the work falls to citizen writers.
By the numbers
- 54%: share of people surveyed in the United States who got news from social media and video networks in the past week, passing TV news (50%) and news websites and apps (48%) for the first time. Reuters Institute Digital News Report, 2025
- 54% and 50%: share of Americans ages 18 to 24 and 25 to 34 who say social media and video networks are their main source of news. Reuters Institute, 2025
- 53%: share of U.S. adults who at least sometimes get news from social media. Pew Research Center, 2025
- 38% and 35%: share of U.S. adults who regularly get news on Facebook and on YouTube, the two biggest sites for news. Pew Research Center, 2025
- 20%: share of people surveyed in the United States who pay for online news. Reuters Institute, 2025
- 26%: drop in U.S. newsroom employment from 2008 to 2020, from about 114,000 jobs to about 85,000. Pew Research Center analysis of Bureau of Labor Statistics data, 2021
- 57%: drop in newspaper newsroom jobs over the same years, from roughly 71,000 to about 31,000. Pew Research Center, 2021
Current: In the News
News coverage
- "News sites are the new newspapers: People are abandoning them for social media", Nieman Lab, June 15, 2026. Coverage of the 2026 Digital News Report on readers finding stories in feeds instead of on news sites.
Check yourself
1. What makes a citation useful to a reader?
A reader should be able to go straight to the original source and find the fact. Title, publisher, date and link make that possible.
2. An infographic shows the rate rising from $38 to $46.50, but the bar chart's axis starts at $35. What is the problem?
Bar lengths should start at zero. A truncated axis exaggerates the change and misleads readers.
3. What is the difference between the reader Q&A and the Interrogatories section?
One serves the curious reader, the other faces the skeptic. Both go inside the article file.
4. How should an Interrogatories answer handle a challenge that is partly right?
Conceding a fair point builds trust. Pretending an opponent is wrong about everything makes readers doubt the rest.
5. Which term belongs in a short glossary for a general reader of a water rate story?
Glossaries are for terms a general reader may not know or may misread. 'Capital fund' fits; everyday words do not.
6. Why should an infographic come with a text description?
W3C guidance for complex images calls for a short description plus a longer text version of the data, available to everyone.
Terms in this lesson
- Citation
- A reference that tells the reader exactly where a fact came from, with enough detail to find it.
- Infographic
- A chart, map or diagram that shows data or a process visually.
- Long description
- A text version of a complex image's essential information, so the content is available without seeing it.
- Reader Q&A
- A section answering the practical questions ordinary readers are likely to ask about the story.
- Interrogatories
- In this course, a section posing the hardest questions an opponent of the article's position would ask, each answered in full.
Sources
- W3C Web Accessibility Initiative, Complex Images tutorial checked 2026-10
- Society of Professional Journalists, SPJ Code of Ethics checked 2026-10
- GFOA, Fund Balance Guidelines for the General Fund checked 2026-10
- GFOA, Working Capital Targets for Enterprise Funds checked 2026-10