Lesson 8 of 8 · about 17 minutes
The debates: bridge or lock-in, cold snaps, and gas versus storage
You'll be able to
- State the bridge fuel and lock-in arguments in their strongest forms
- Explain what FERC and NERC found about gas during Winter Storms Uri and Elliott
- Compare gas and battery storage costs and the jobs each can and cannot do
- Weigh a local gas plant proposal fairly, with questions that test both sides
A few arguments run under almost every fight over a new gas plant or pipeline. Is gas a bridge to a cleaner grid or a trap that keeps us burning it for decades? Can gas be counted on when the weather turns brutal? And is gas still the cheapest way to keep the lights on when the sun is down and the wind is still, or have batteries caught up? Each side has real evidence. Anyone taking part in one of these fights should know the strongest version of each case and where the evidence settles the matter.
Bridge fuel or lock-in
The strongest case for gas as a bridge
The US cut power sector CO2 a great deal after 2008, and gas replacing coal did much of that work. EIA's numbers show why: gas plants emit 0.96 pounds of CO2 per kWh versus coal's 2.31. Gas plants also emit far less sulfur dioxide, mercury and soot, which matters for public health near plants. Supporters, including most utilities, the gas industry, many grid operators and some energy economists, add that a grid with lots of wind and solar needs flexible backup that can run for days, and gas is the proven, available option. Building gas now, they argue, lets coal retire sooner and lets renewables grow without risking blackouts. Some new plants are being designed to burn hydrogen blends later or to add carbon capture, which supporters cite as a path to lower emissions over the plant's life.
The strongest case for lock-in
A combined-cycle plant is built to run 30 to 40 years, and its cost is usually recovered from customers over a similar period. A plant approved in 2026 could still be running in 2066. Opponents, including many climate scientists, environmental groups and some state energy agencies, argue that once customers are paying for a plant, regulators and utilities face heavy pressure to keep running it, and shutting it early leaves customers with stranded costs. They point to methane leakage, which narrows the climate gap with coal (lesson 6), and to measurement studies like Sherwin and colleagues in Nature (2024), which found leak rates about three times the government inventory. And they note that hydrogen and carbon capture at gas plants remain mostly unbuilt at commercial scale, so promises of later conversion should be weighed as plans, not facts.
Where the evidence points
The historical record supports the bridge argument for gas replacing coal: CO2 fell. Whether new gas in 2026 is a bridge depends on what it replaces and how long it runs. A gas plant that lets a coal plant retire early cuts emissions. A gas plant built to serve new load, such as a data center, adds emissions unless something else is retired. Both sides often blur that difference. Ask which one it is.
Reliability in cold snaps
Gas is sold as reliable, dispatchable power. The two worst US winter grid events in recent memory both involved gas failing in large numbers. Neither side's favorite version of these events matches the federal record.
Winter Storm Uri, February 2021
Extreme cold hit Texas and the south-central US. ERCOT ordered 20,000 MW of rolling blackouts, the largest manually controlled load shed in US history per FERC. More than 4.5 million people in Texas lost power, some for up to four days. Texas's state health department put the final death toll at 246; some independent analyses of excess deaths estimated considerably more. The joint FERC-NERC report found that gas-fired units were 58% of generating units with outages, derates or failures to start. Freezing problems caused 44.2% of outages and fuel problems 31.4%. Gas production fell sharply as wellheads and gathering equipment froze, and some gas equipment itself lost power during the blackouts, making the fuel shortage worse.
Wind turbines also froze. ERCOT data reported by Power Engineering showed about 27 GW of gas capacity lost, out of about 52 GW of total generating capacity lost, with wind, coal and nuclear units also failing. Early political claims blaming frozen wind turbines for the blackouts did not match the data; gas was the largest single source of lost power. Claims that renewables played no role were also wrong.
Winter Storm Elliott, December 2022
Elliott hit the eastern US on December 21 to 26, 2022. FERC and NERC reported unplanned outages peaking at 90,500 MW, with more than 127,000 MW unavailable counting units already out. Grid operators shed a combined 5,400 MW, the largest controlled load shed in Eastern Interconnection history. Of the 1,702 affected generating units, 47% were gas, 21% wind, 12% coal, 3% solar, under 1% nuclear and 17% other. Causes: mechanical and electrical failures (41%), freezing (31%) and fuel problems (24%). Gas fuel problems alone were 20% of all lost megawatts. Marcellus production fell 23% and Utica 54% from freeze-offs.
| Measure | Uri (Feb 2021) | Elliott (Dec 2022) |
|---|---|---|
| Controlled load shed | 20,000 MW (ERCOT) | 5,400 MW (several operators) |
| Gas share of affected units | 58% | 47% |
| Freezing as a cause | 44.2% | 31% |
| Fuel supply as a cause | 31.4% | 24% |
| Deaths | 246 in Texas (state estimate) | Not a single official total for the grid event |
What each side takes from this
Gas supporters argue the problem is fixable: winterize wells and plants, secure firm pipeline capacity, add backup fuel oil at plants, and coordinate gas and electric operations. FERC approved mandatory NERC cold-weather standards after Uri, and Texas passed winterization laws. Critics argue that gas and electric systems depend on each other in a way that makes cold snaps a shared point of failure: cold drives heating demand up and gas production down at the same time, and pipelines are not built to the same reliability standards as the grid. Both points stand. Gas is dispatchable when the fuel shows up, and the fuel did not reliably show up in either storm.
Gas versus storage
Batteries now do jobs gas used to own. EIA's count of planned 2026 additions included 24 GW of batteries and 6.3 GW of gas. The comparison depends on which job.
| Resource (Lazard 2025, unsubsidized) | Cost range | Best job | Limits |
|---|---|---|---|
| Gas combined cycle | $48 to $109/MWh | Running most hours, multi-day firming | Fuel price risk, emissions, turbine backlog |
| Gas peaker | $149 to $251/MWh | Rare peak hours, multi-day backup if fueled | High cost per MWh at low hours, emissions |
| Battery, 2-hour (LCOS) | $81 to $174/MWh | Short peaks, frequency response | Short duration |
| Battery, 4-hour (LCOS) | $145 to $319/MWh | Evening ramp, daily solar shifting | Empty after 4 hours at full output |
Lazard's figures leave out tax credits, fuel price assumptions in some comparisons, carbon costs and differences in financing, so they are a starting point. Levelized costs also miss what each resource adds to reliability, which is why grid planners use separate measures, such as how much each megawatt counts toward meeting a peak.
Example: covering a five-day cold snap in Cedar Bend
Cedar Bend is an invented utility. In a five-day cold, still, cloudy event, it is short 300 MW around the clock after counting all other plants.
Energy needed: 300 MW x 24 hours x 5 days = 36,000 MWh.
Option A: four-hour batteries. Each MW of 4-hour battery stores 4 MWh. To cover 36,000 MWh without recharging (solar and wind are weak), Cedar Bend would need 36,000 / 4 = 9,000 MW of 4-hour batteries, 30 times the 300 MW gap. In practice, batteries recharge partially from whatever wind and solar show up, but they cannot cover a long event alone at today's durations.
Option B: a 300 MW peaker with firm fuel. Fuel: 36,000 MWh x 11 MMBtu/MWh = 396,000 MMBtu. At normal $4 gas: $1,584,000. At $25 gas in a regional crisis: $9,900,000. And if the pipeline gas does not arrive, the peaker needs backup fuel oil on site.
Option C: a mix. Batteries handle daily peaks and the evening ramp the other 360 days a year; a smaller gas fleet with firm fuel or oil backup covers rare long events. This is roughly what many utility resource plans now propose. The arguments are over the size of each piece, who pays, and how fast longer-duration storage and other firm resources (geothermal, nuclear, demand response, transmission to neighbors) can shrink the gas piece.
The strongest case for gas here is duration: a fueled gas plant can run for days, and nothing else as cheap and available today can. The strongest case for storage is that it is cheaper for the hours it covers, has no fuel price exposure, can be built in a year or two while gas turbines are backlogged for years (GE Vernova reported 116 GW of backlog and reservations in mid-2026), and gets cheaper over time. Both are true, which is why the answer in most places is a mix and the fight is over the proportions.
Common mix-ups
- Claim: Frozen wind turbines caused the Texas blackouts. What the evidence shows: Wind did lose output, but gas units were the largest source of lost generation, and FERC-NERC found freezing and fuel supply problems at gas facilities central to the event.
- Claim: Gas is always reliable in winter. What the evidence shows: In both Uri and Elliott, gas units were the largest category of failures, from frozen equipment and fuel supply problems.
- Claim: Batteries make gas unnecessary today. What the evidence shows: Batteries are cheaper for short peaks. Today's 2- to 4-hour systems cannot cover multi-day events alone. Long-duration storage is growing but small.
- Claim: New gas plants always cut emissions. What the evidence shows: Only if they displace coal or older gas. Plants built to serve new demand add emissions.
Reporting angle
- When a utility proposes gas, ask: what does it replace, how many years is it depreciated over, and what happens to customers if it closes early?
- Ask for the alternatives analysis in the resource plan. Did the utility model batteries, demand response, transmission or other firm resources at current costs?
- Ask whether the plant will have firm pipeline capacity, on-site backup fuel and winterization, and what happened at the utility's plants during the last cold snap.
- Read NERC's annual Winter Reliability Assessment for your region. It names specific risks.
- Track state PUC dockets on cold-weather preparedness and on cost recovery from past storms.
- For any hydrogen-ready or capture-ready claim, ask for the hydrogen supply plan, the capture project timeline and who pays.
Research angle
- FERC, NERC and Regional Entity staff report on the February 2021 cold weather outages.
- Power Engineering on gas spot prices and outages in the Texas freeze.
- EIA Today in Energy on planned capacity additions.
- EIA FAQ on CO2 per kilowatthour of electricity.
- pv magazine USA on the Lazard 2025 cost figures.
- Turbomachinery Magazine on the GE Vernova gas turbine backlog.
Pictures, Numbers and Infographics
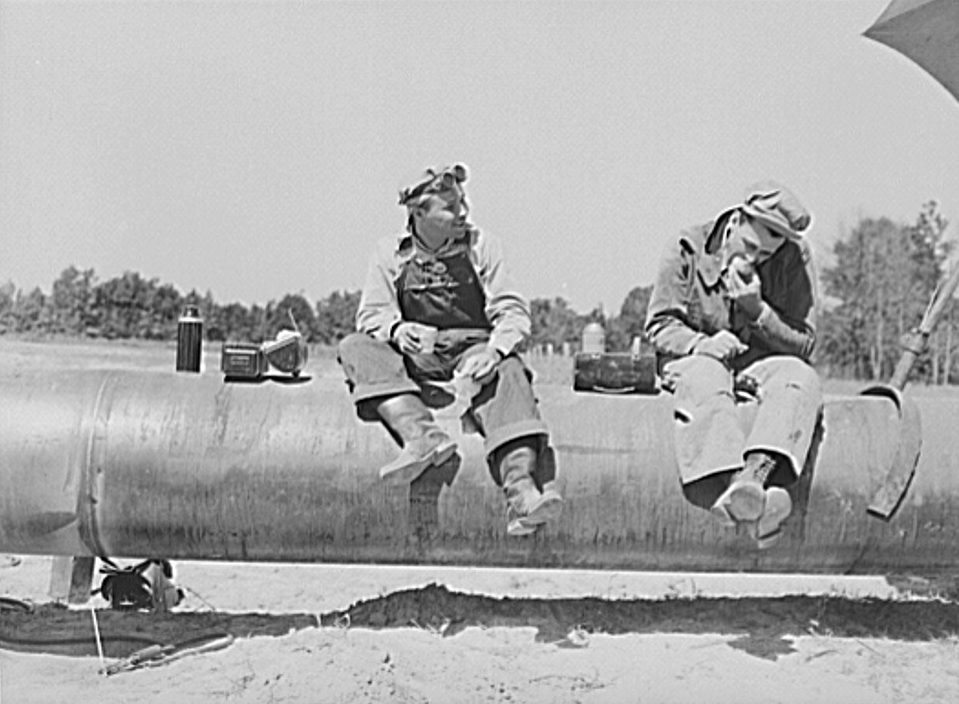
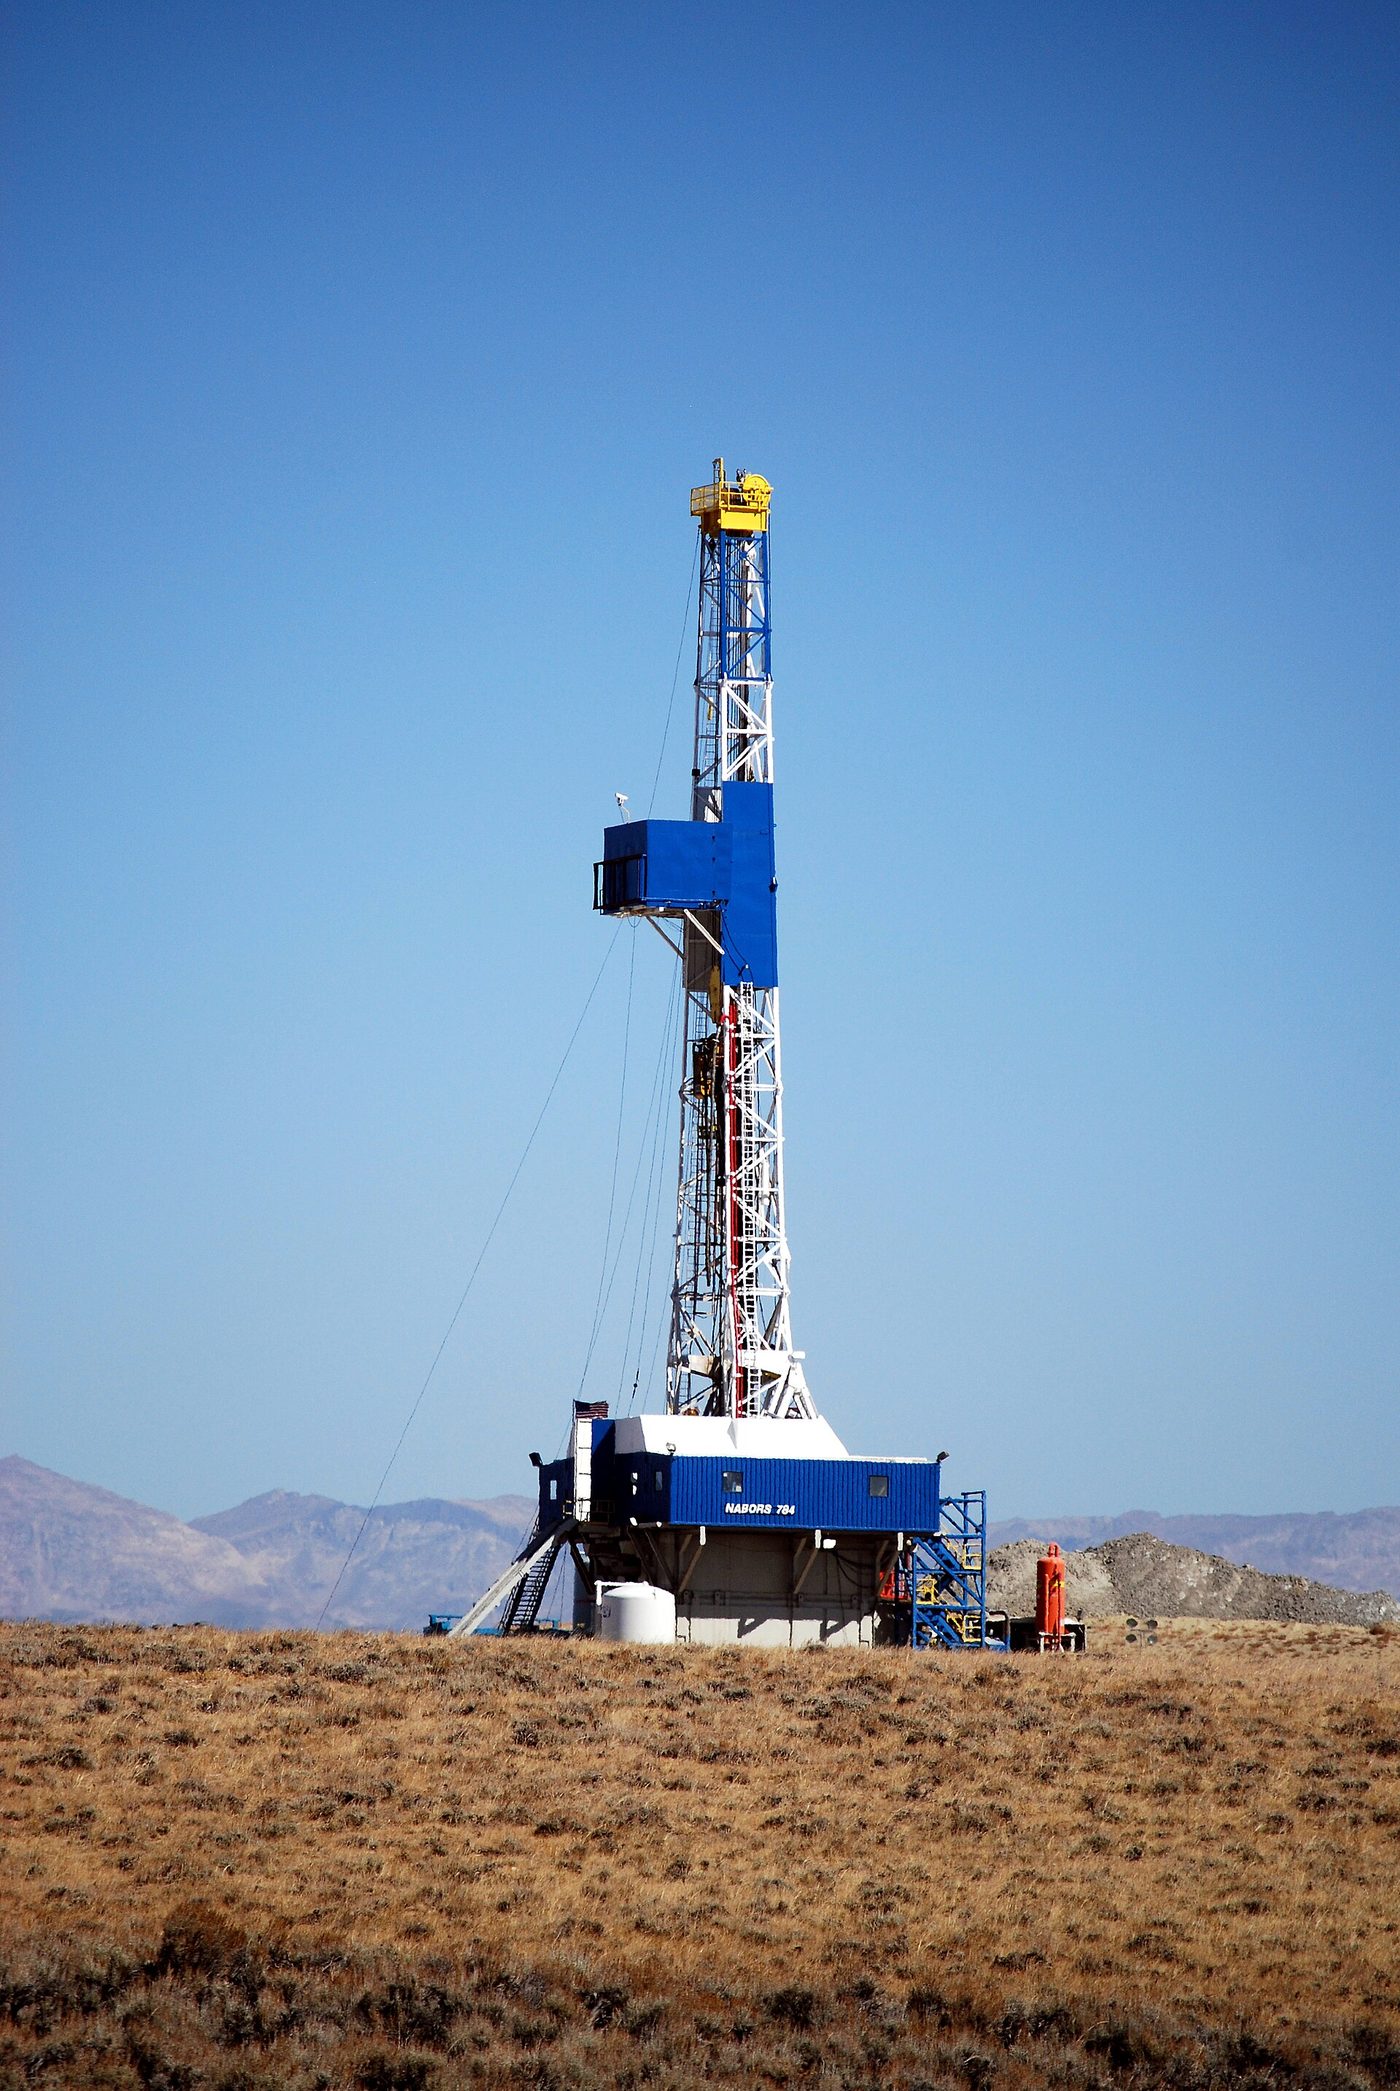
Natural gas is the largest single source of U.S. electricity and the biggest single use of the gas the country burns. The photos show the pipe and the drill rig at each end of the system; the numbers cover plants, prices, emissions and scale.
By the numbers
- About 41 percent: natural gas share of U.S. utility-scale electricity generation in 2025, the largest of any source. EIA, Electricity in the U.S., 2026
- 0.96 vs. 2.31 pounds: CO2 per kWh from U.S. gas-fired and coal-fired utility plants in 2023, measured at the stack. EIA, FAQ: CO2 emissions per kWh, 2024
- 7,548 vs. 10,999 Btu per kWh: average tested heat rates of U.S. gas combined-cycle units and simple-cycle gas turbines in 2024. A peaker burns about 46 percent more gas for the same kilowatt-hour. EIA, Electric Power Annual, Table 8.2
- About 3 million miles: U.S. natural gas pipeline network. In 2022 it delivered about 29.2 trillion cubic feet of gas to about 78.3 million consumers. EIA, Natural gas pipelines
- $7.72 per MMBtu: Henry Hub average price in January 2026, during and after winter storm Fern. EIA forecasts a $3.16 average for 2027. EIA, Short-Term Energy Outlook, 2026
- 6.3 GW: new gas-fired capacity planned for 2026 (3.3 GW combined cycle, 2.8 GW combustion turbines), out of 86 GW of all planned additions. EIA, Today in Energy, Feb. 2026
Check yourself
1. Per the FERC-NERC report on February 2021 (Uri), what share of generating units with outages, derates or failures to start were gas-fired?
Gas units made up 58% of affected units. Freezing (44.2%) and fuel supply problems (31.4%) caused about three quarters of the outages.
2. During Winter Storm Elliott in December 2022, what peak unplanned generation outage did FERC and NERC report?
Unplanned outages peaked at 90,500 MW. Controlled load shed totaled 5,400 MW, the largest in Eastern Interconnection history.
3. What is the core of the 'lock-in' argument against new gas plants?
Long-lived assets with long cost-recovery schedules create financial and political pressure to keep using them, or leave customers paying for plants that close early.
4. Lazard's 2025 analysis put unsubsidized 4-hour standalone battery storage at about what levelized cost?
Lazard's 2025 levelized cost of storage for a 100 MW, 4-hour system was $145 to $319 per MWh. Its gas peaker range was $149 to $251.
5. Which statement about winter reliability is best supported by the federal reports?
Gas units were the largest category in both reports. Other sources also failed. In Elliott 21% of affected units were wind and 12% coal.
6. Why do many grid planners still count on gas for multi-day winter events?
Battery duration limits coverage of week-long events. The reports show gas also has winter risks, so firm fuel and winterization matter.
Terms in this lesson
- Bridge fuel
- The idea that gas can cut emissions now by replacing coal while cleaner sources scale up.
- Lock-in
- The risk that long-lived gas plants and pipelines keep emissions high for decades or leave customers paying for stranded assets.
- Stranded asset
- Infrastructure retired or idled before its costs are paid off, leaving the remaining cost with owners or customers.
- Load shed
- Deliberate, controlled power cuts (rolling blackouts) ordered by a grid operator to keep the grid from collapsing.
- Firm fuel
- Gas supply and pipeline capacity contracted so it cannot be cut off when other customers need it, or backup fuel stored on site.
- LCOE
- Levelized cost of energy: the lifetime cost of building and running a plant divided by the energy it makes, in $/MWh.
Sources
- FERC: Final report on February 2021 freeze underscores winterization recommendations checked 2026-10
- FERC, NERC and Regional Entity Staff Report: The February 2021 Cold Weather Outages in Texas and the South Central United States checked 2026-10
- Power Engineering: FERC-NERC final report on Winter Storm Elliott (November 2023) checked 2026-10
- Power Engineering: Texas freeze caused record gas spot prices and outages checked 2026-10
- Texas Tribune: Texas puts final estimate of winter storm death toll at 246 (January 2022) checked 2026-10
- pv magazine USA: Lazard 2025 LCOE and LCOS figures (June 2025) checked 2026-10
- EIA Today in Energy: Planned U.S. capacity additions for 2026 checked 2026-10
- EIA Today in Energy: In SPP and MISO, coal sometimes generates more than natural gas checked 2026-10
- Sherwin et al., Nature 2024 (Stanford summary) checked 2026-10
- EIA FAQ: CO2 per kWh of US electricity generation checked 2026-10
- Turbomachinery Magazine: GE Vernova gas turbine backlog hits 116 GW (July 23, 2026) checked 2026-10