Lesson 9 of 9 · about 18 minutes
Hydrogen, Emerging Options and How to Judge a New Energy Claim
You'll be able to
- Explain how hydrogen is produced today and by electrolysis, and do the energy loss arithmetic for power-to-hydrogen-to-power
- Name where hydrogen makes the most sense and where cheaper options usually win
- Describe the 2025 changes to the 45V credit and DOE hydrogen hub funding
- Apply a checklist to judge a new energy claim: units, scale, stage, cost, independent data and who benefits
Hydrogen is the most abundant element in the universe and almost none of it lies around free on Earth. It is bound up in water and hydrocarbons, so you have to spend energy to pull it loose. That makes hydrogen an energy carrier, like electricity, and not an energy source like sunlight or gas. Everything about its economics follows from that.
How hydrogen is made
The U.S. produces about 10 million metric tons of hydrogen a year, according to DOE, mostly for oil refining and ammonia fertilizer. Nearly all of it today comes from natural gas through steam methane reforming, which releases CO2. Industry shorthand uses colors: "gray" for reforming without carbon capture, "blue" for reforming with capture, "green" for electrolysis with renewable power. The colors are marketing labels, not standards; what matters legally for the federal credit was lifecycle emissions per kilogram.
Electrolysis splits water with electricity. Hydrogen holds roughly 33 kWh of energy per kilogram (on a lower heating value basis), and today's electrolyzers use roughly 50 to 55 kWh of electricity to make that kilogram. DOE's Hydrogen Shot goal is to cut the cost of clean hydrogen 80 percent to $1 per kilogram within a decade; DOE says renewable hydrogen costs about $5 per kilogram.
Worked example: what a kilogram costs in electricity alone
Electricity per kg:      52 kWh
Power at $30/MWh:        52 x $0.030 = $1.56 per kg
Power at $60/MWh:        52 x $0.060 = $3.12 per kg
Electricity alone blows past the $1 target unless power is very cheap, and that is before the electrolyzer's capital cost, water, compression and storage. To run on surplus solar at near-zero prices, the electrolyzer sits idle much of the day, which raises its capital cost per kilogram. That tension is the core of the green hydrogen business case.
The round-trip problem
Hydrogen can store energy for weeks or seasons, something batteries cannot do cheaply. But each conversion loses energy. Using illustrative efficiencies (actual equipment varies):
| Step | Efficiency | Energy left from 100 MWh |
|---|---|---|
| Electrolysis | 70% | 70 MWh |
| Compression and storage | 90% | 63 MWh |
| Burned in a turbine or used in a fuel cell | 50% | 31.5 MWh |
About a third comes back, against roughly 82 percent for lithium-ion batteries in EIA's measurements. So hydrogen for grid storage only makes sense where its strength (long duration, large volume) is worth paying that loss. Utah's Intermountain Power Project was built to blend hydrogen made from excess renewable power into a gas turbine, with salt caverns for storage; EIA noted in May 2025 that it was scheduled to come online that year; check how much hydrogen it actually burns before citing it as a working example.
Where hydrogen fits
| Use | Case for hydrogen | Main competitor | Verdict most analysts reach |
|---|---|---|---|
| Refineries, ammonia | Already use hydrogen; cleaner supply cuts emissions directly | Gray hydrogen from gas | Strongest near-term use |
| Steelmaking | Can replace coal in reducing iron ore | Coal, gas-based processes | Promising, costly, early |
| Seasonal grid storage | Stores huge energy for months | Gas peakers, long-duration batteries | Possible niche; big losses |
| Long-haul trucks, shipping fuels | Energy-dense, quick refuel | Batteries, biofuels, ammonia | Contested |
| Home heating | Could use converted gas pipes | Heat pumps | Weak; heat pumps use far less energy |
| Passenger cars | Fast refuel | Battery electric | Weak; few stations, higher fuel cost |
Policy whiplash, 2022 to 2025
The 2022 Inflation Reduction Act created the 45V clean hydrogen production credit, worth up to $3 per kilogram for the cleanest production, for facilities that began construction before 2033. In 2023 DOE selected seven regional hydrogen hubs for up to $7 billion. Then the 2025 tax law, Public Law 119-21, moved the 45V deadline: facilities must now begin construction before January 1, 2028. On October 1, 2025, DOE terminated $7.56 billion in awards for 223 projects, including $1.2 billion for California's ARCHES hub and $1 billion for the Pacific Northwest Hydrogen Association, which covered projects in Washington, Oregon and Montana. The Pacific Northwest group appealed; ARCHES officials said the hub would continue.
Supporters of the hubs argued they would build an industry and cut emissions from hard-to-electrify sectors. Skeptics argued hydrogen subsidies were costly per ton of CO2 avoided and that electrolysis on a carbon-heavy grid could raise emissions. Both arguments turned on the same technical detail: where the electricity comes from, and in which hours.
Other emerging options, briefly
- Enhanced geothermal: Fervo's Cape Station in Utah began sending power to the grid in September 2026 (see the geothermal lesson). The next test is long-run reservoir performance and cost.
- Long-duration batteries: Form Energy's iron-air system is designed to discharge for up to 100 hours using reversible rusting of iron and a water-based electrolyte.
- Offshore and floating wind: Large resource near coasts; Lazard's 2026 unsubsidized range was $105 to $167/MWh, and U.S. projects faced federal permitting reversals in 2025.
- Advanced nuclear and small modular reactors: Covered in the nuclear module.
- Perovskite and tandem solar cells: Higher lab efficiencies stacked on silicon; durability in the field is the open question.
How to judge a new energy claim
Breakthrough announcements arrive weekly. Most are real research described in unreal terms. Run every one through these questions before you repeat it, cite it or vote on it.
Checklist
- Units: Is it MW or MWh? DC or AC? Lab cell or full panel? "Efficiency" of what, measured how?
- Stage: Lab result, pilot, first commercial plant, or many plants running for years? Each step fails more often than the last.
- Scale: How big is it next to the problem? Compare to your state's annual use (EIA state tables) or the national fleet.
- Capacity factor and timing: How many hours a year, and which hours?
- Cost: Is there a price per MWh or per kilogram? Who estimated it? What discount rate and lifetime?
- Independent data: Peer-reviewed paper? Certified test lab? Operating data filed with a regulator or EIA? Or just a press release?
- Contracts: Has anyone signed a binding contract to buy the output (a PPA) or the product? Memoranda of understanding are not contracts.
- Interconnection and permits: Does it have a grid connection agreement? LBNL found only about 13 percent of capacity that applied for interconnection from 2000 to 2020 was ever built.
- Who benefits: Is the claim timed to a fundraising round, stock offering, legislative vote or subsidy deadline?
- Physics: Does it break a known limit, like the Betz limit for wind or the Carnot limit for heat engines? If so, it is wrong.
Worked example: testing an announcement
Press release from an invented company, Aurora Hydrogen Works: "Our new plant in Cedar Fork will produce enough clean hydrogen to power 50,000 homes."
- Units: hydrogen is measured in kilograms or tons a year. "Homes powered" is a conversion; ask for the tons.
- They say 2,000 metric tons a year. At about 33 kWh per kg, that is 66,000 MWh of chemical energy. Burned at 50 percent, about 33,000 MWh of electricity. At 10,000 kWh per home a year, that is 3,300 homes, not 50,000.
- Electricity in: 2,000,000 kg x 52 kWh = 104,000 MWh, roughly what a 47-MW solar farm at 25 percent produces in a year.
- Stage and contracts: Is the plant built? Who buys the hydrogen? Did it rely on the 45V credit, and has it started construction before 2028?
Twenty minutes of arithmetic and the homes claim shrank by more than 90 percent.
Common mix-ups
- Claim: Hydrogen is a clean energy source. What the evidence shows: It is a carrier. It is only as clean as the energy used to make it, and most U.S. hydrogen today comes from natural gas.
- Claim: A breakthrough in the lab means cheaper power soon. What the evidence shows: The gap from lab to commercial scale is usually many years, and most ideas do not make it. Ask what stage it is at.
- Claim: "Powers X homes" tells you how big a project is. What the evidence shows: It depends on assumed home use and capacity factor, and companies pick generous assumptions. Ask for MWh or tons.
Reporting angle
- For a hydrogen project, ask for its electricity source and hours, its expected emissions per kilogram, its construction start date (for 45V) and its buyers.
- For a DOE-funded project, check DOE's award announcements and any termination letters. Ask the recipient whether it appealed.
- Get water rights filings for any electrolyzer; it needs about 9 kilograms of water per kilogram of hydrogen in theory, more in practice.
- For any startup claim, look for SEC filings, test lab certifications, and regulator filings rather than relying on the release.
Research angle
- DOE, hydrogen production: Production methods and their inputs.
- DOE, Hydrogen Shot: The federal cost target.
- S&P Global on the Pacific Northwest hydrogen hub appeal: Grant termination and the appeal.
- EIA on round-trip efficiency: Baseline storage efficiency to compare against.
- Form Energy, battery technology: Maker's claims on iron-air storage.
- LBNL Queued Up: Queue data for projects that depend on new supply.
Pictures, Numbers and Infographics
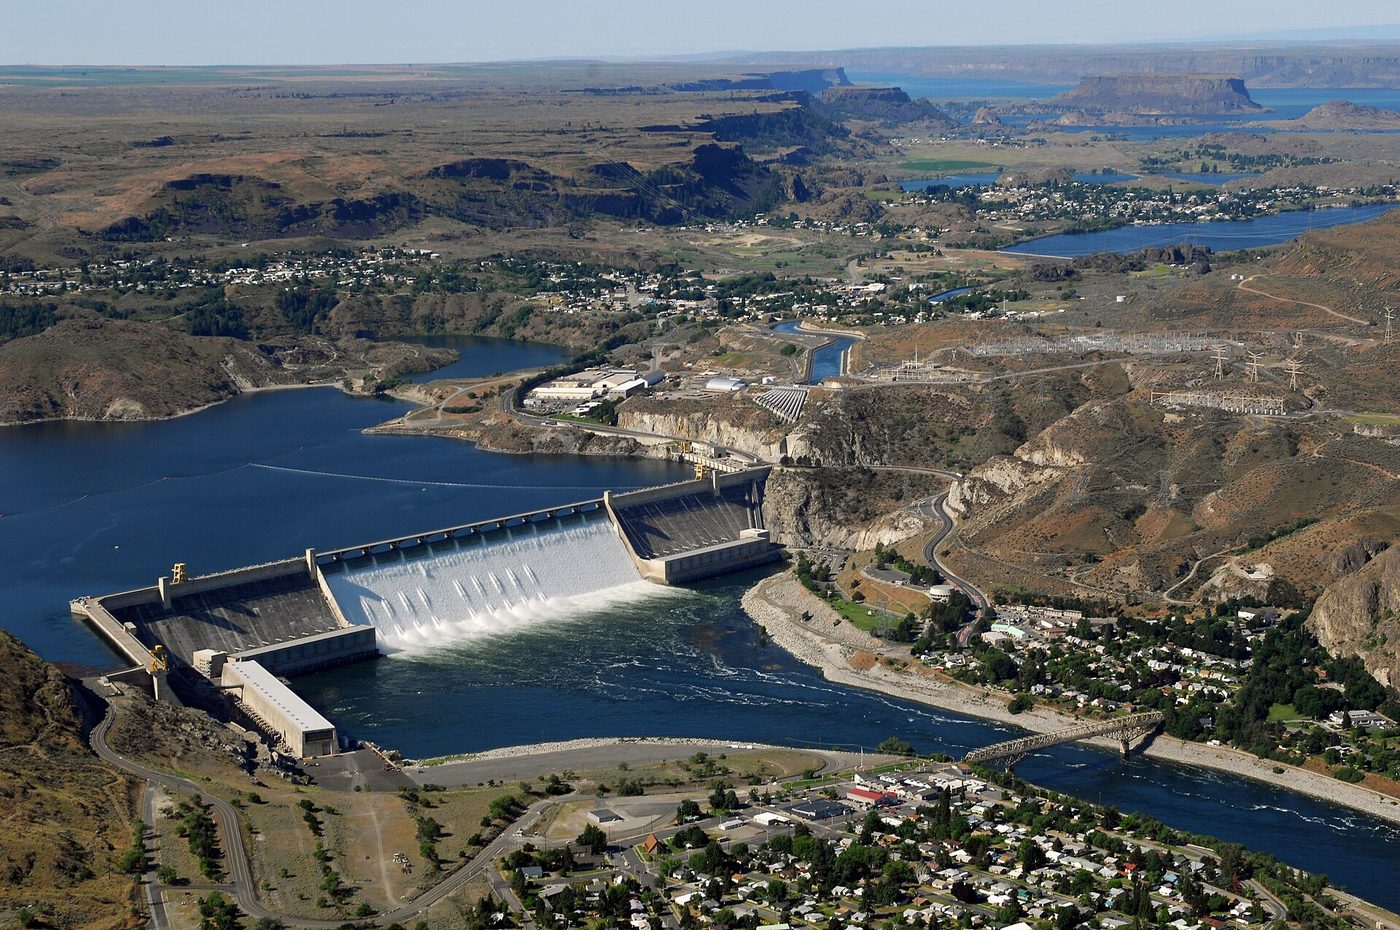
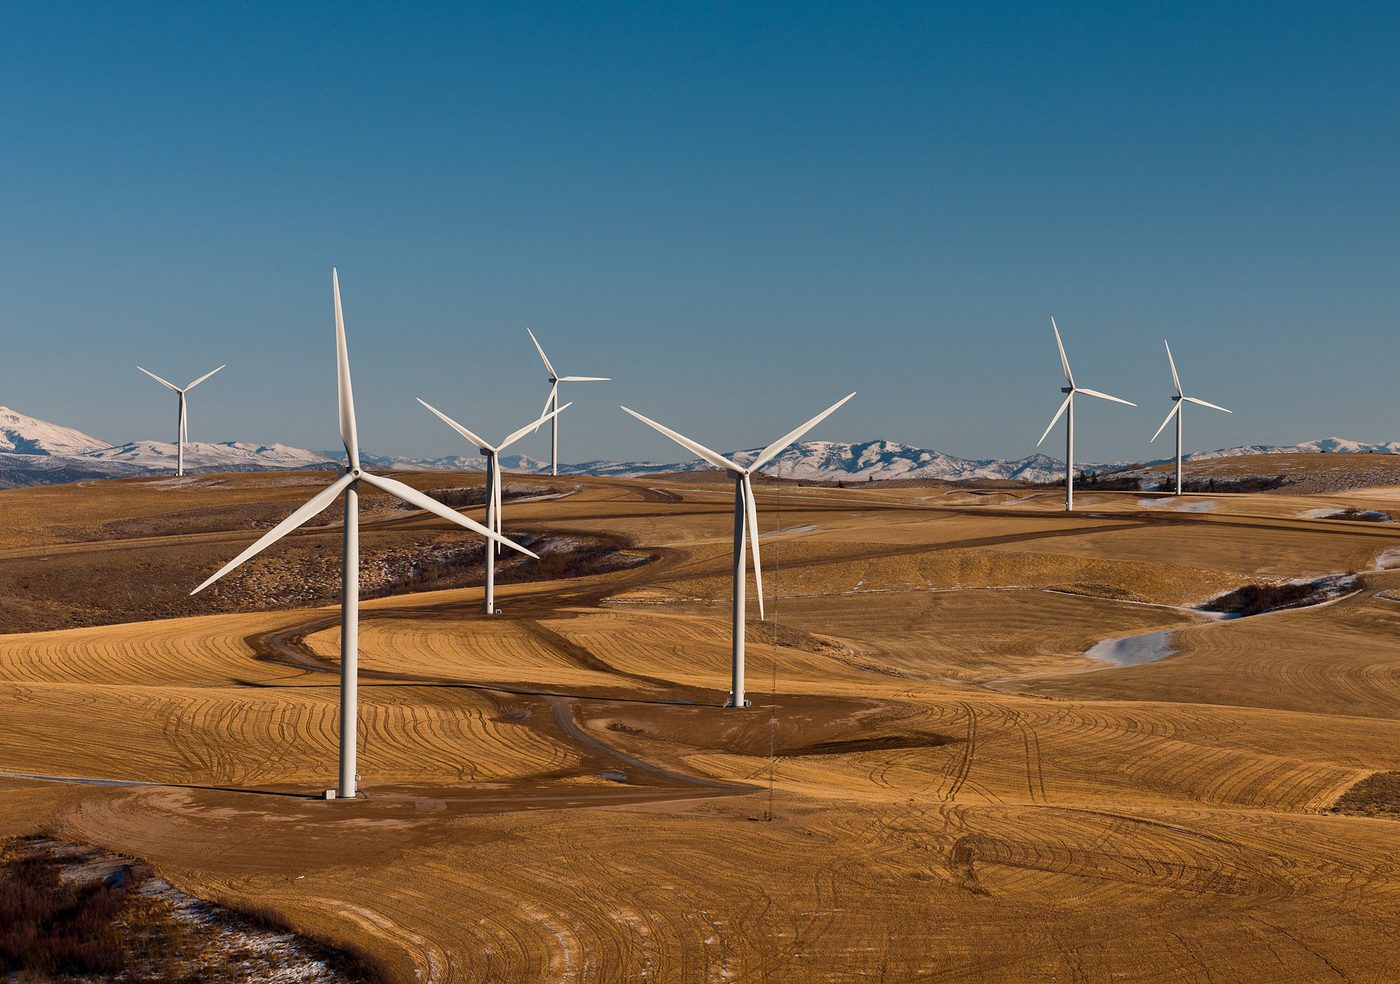
Hydro, wind, solar and geothermal plants run very different shares of the year, and what developers plan to build next is not what produces most of the power today. The pictures show three of the technologies this module covers; the charts compare how hard each fleet runs and what is in the 2026 pipeline.

By the numbers
- 247 billion kWh: U.S. conventional hydropower generation in 2025, about 6 percent of utility-scale electricity. Washington produced 26 percent of it. EIA, Where hydropower is generated, 2026
- 464 billion kWh: U.S. wind generation in 2025, about 10 percent of utility-scale electricity, from projects in 43 states. Texas, Iowa, Oklahoma, Kansas and Illinois produced about 52 percent of it. EIA, Where wind power is produced, 2026
- 16 billion kWh: U.S. geothermal generation in 2025, about 0.4 percent of utility-scale electricity, from plants in seven states. EIA, Use of geothermal energy, 2026
- 20,035,438 MWh: Idaho's net electricity generation in 2024. Hydroelectric was the state's primary energy source. EIA, Idaho Electricity Profile 2024
- 15 GW: utility-scale battery storage added in the U.S. in 2025, a record. Developers planned 24 GW more for 2026, with 12.9 GW of that in Texas. EIA, Today in Energy, Feb. 2026
- 3.4 million MWh: wind and solar output curtailed by the California grid operator in 2024, up 29 percent from 2023. Solar was 93 percent of it. EIA, Today in Energy, May 2025
Check yourself
1. About how much hydrogen does the U.S. produce each year, according to DOE?
DOE says about 10 million metric tons a year, mostly used in oil refining and ammonia production.
2. Electricity goes into an electrolyzer at 70 percent efficiency, the hydrogen is stored with 10 percent losses, and a turbine burns it at 50 percent efficiency. How much of the original electricity comes back?
0.70 x 0.90 x 0.50 = 0.315. Roughly two-thirds is lost, compared with 15 to 20 percent for batteries.
3. What did the 2025 federal tax law do to the 45V clean hydrogen production credit?
Public Law 119-21 moved the begin-construction deadline from 2033 to before 2028.
4. On October 1, 2025, DOE terminated funding for which two regional hydrogen hubs, among 223 projects?
S&P Global reported terminations of $1.2 billion for ARCHES and $1 billion for the Pacific Northwest Hydrogen Association, part of $7.56 billion cut that day.
5. A startup says its new panel is '50 percent more efficient.' What is the first thing to pin down?
'Fifty percent more efficient' could mean going from 20 to 30 percent conversion, or a lab cell under special light. Units and test conditions come first.
6. Which use of hydrogen do most analysts consider the strongest near-term case?
Those industries already use hydrogen at scale, so cleaner production cuts emissions without new pipelines or appliances. Homes and cars have cheaper electric options.
Terms in this lesson
- Electrolysis
- Using electricity to split water into hydrogen and oxygen.
- Steam methane reforming
- Making hydrogen by reacting natural gas with steam, which releases CO2. The main way hydrogen is made today.
- Round-trip efficiency
- The share of energy you get back after converting and storing it, then converting it back.
- Technology readiness
- How far an idea has come: lab, pilot, first commercial plant, or proven at scale.
- Power purchase agreement (PPA)
- A long-term contract to buy electricity from a specific project at set terms.
Sources
- U.S. DOE Hydrogen and Fuel Cell Technologies Office, Hydrogen Production checked 2026-10
- U.S. DOE, Hydrogen Shot checked 2026-10
- Clifford Chance, OBBBA: notable terminations of tax credits for solar, wind, hydrogen and clean vehicles (Nov. 2025) checked 2026-10
- S&P Global, Pacific Northwest hydrogen hub appeals DOE's $1 billion grant termination (Nov. 3, 2025) checked 2026-10
- EIA Today in Energy, CAISO curtailment and planned hydrogen at Intermountain Power Project (May 28, 2025) checked 2026-10
- EIA Today in Energy, round-trip efficiency of utility-scale batteries and pumped storage (Feb. 2021) checked 2026-10
- Form Energy, Battery technology checked 2026-10
- Power Engineering, Fervo Energy achieves first power at flagship Utah geothermal project (Sept. 24, 2026) checked 2026-10
- Lawrence Berkeley National Laboratory, Queued Up: 2026 Edition checked 2026-10